The ride-hailing and mobility services industry grows quickly because more customers prefer app-based bookings for taxis, autos, bikes, and shared rides. As the business expands, companies need fast, accurate, and clear performance insights. However, most teams depend on multiple reports, manual files, and scattered data. This slows down decision-making and hides important operational issues.
A Ride-Hailing & Mobility Apps KPI Dashboard in Power BI solves these challenges. It displays all operational KPIs, trip data, revenue trends, customer behavior, and fleet performance in a clean and interactive way. Because Power BI updates visuals instantly, teams make better decisions and improve service quality within minutes.
In this complete guide, you will learn how the dashboard works, what each page includes, and why it is essential for fast-growing mobility platforms.
Click to Purchases Ride-Hailing & Mobility Apps KPI Dashboard in Power BI
What Is a Ride-Hailing & Mobility Apps KPI Dashboard in Power BI?
A Ride-Hailing & Mobility Apps KPI Dashboard in Power BI is a ready-to-use analytics solution that helps mobility companies measure performance across trips, fares, customers, vehicles, and operators. It combines data from Excel sheets and converts it into dynamic charts, KPI cards, trend visuals, and detailed reports.
The dashboard gives a structured view of:
-
Month-to-Date (MTD) performance
-
Year-to-Date (YTD) summary
-
Previous Year (PY) comparison
-
Target vs Actual results
-
KPI status using color-coded icons
-
Trend analysis for all key metrics
This dashboard helps mobility companies improve operational efficiency, reduce delays, optimize pricing, and enhance customer satisfaction.
Click to Purchases Ride-Hailing & Mobility Apps KPI Dashboard in Power BI
Why Do Ride-Hailing Businesses Need a KPI Dashboard?
Ride-hailing operations involve many fast-moving parts—driver behavior, trip timings, surge pricing, cancellations, customer ratings, base fare, promo usage, trip type performance, and more. Manually reviewing all this data becomes difficult.
A KPI dashboard makes the process simple because:
-
It updates visuals instantly.
-
It shows real-time insights.
-
It highlights problem areas quickly.
-
It improves the accuracy of reports.
-
It helps managers take timely actions.
Since mobility platforms operate round-the-clock, data-driven decision-making becomes essential. This is exactly what Power BI delivers.
What Are the Main Pages of This Dashboard?
The dashboard contains three key pages inside the Power BI file:
-
Summary Page
-
KPI Trend Page
-
KPI Definition Page (Drill-through Page)
Let’s explore each page in detail.
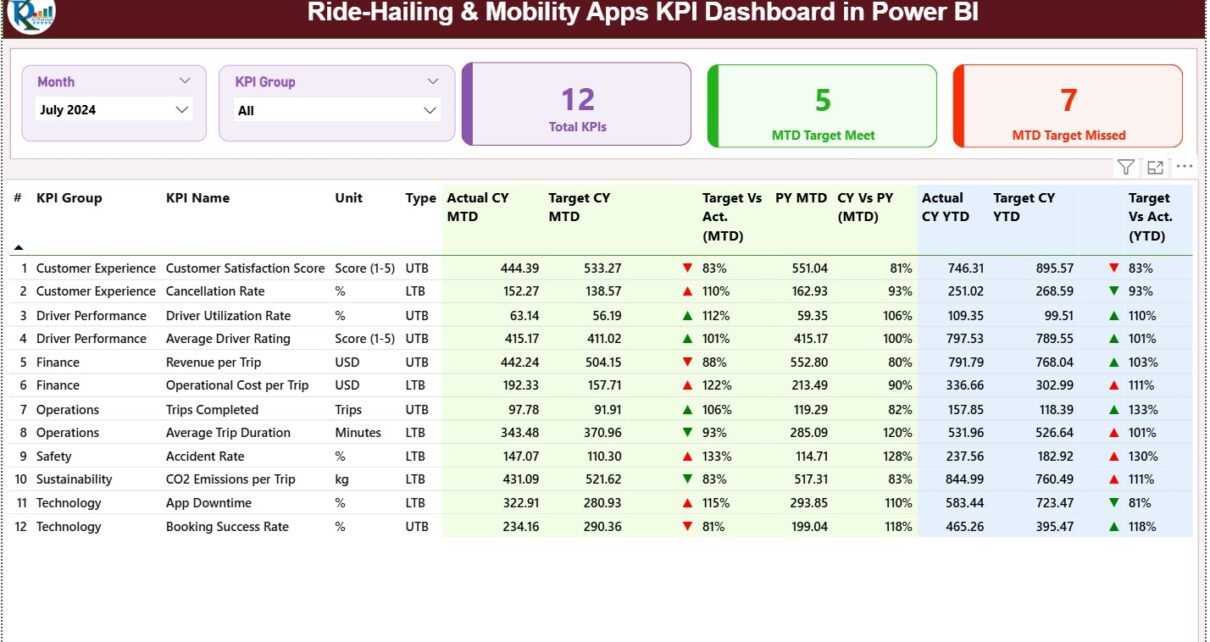
1. Summary Page

The Summary Page is the central hub of this dashboard. It shows the overall performance of all KPIs in one place. This page is used most frequently by operations leaders, analysts, and management teams.
Top Section: Interactive Slicers
The page includes:
-
Month Slicer
-
KPI Group Slicer
These slicers help users filter results instantly. For example:
-
Select “Revenue KPIs” to view fare and share metrics
-
Select “Trip KPIs” to view trip count or trip type analysis
-
Select “Customer KPIs” to view ratings or cancellations
This gives a clearer and more focused view.
KPI Cards in the Summary Page
There are three essential KPI cards displayed at the top:
1. Total KPIs
Shows the total number of metrics tracked in the dashboard.
2. MTD Target Met
Shows how many KPIs have achieved their Month-to-Date target.
3. MTD Target Missed
Shows how many KPIs did not meet their Month-to-Date target.
These three values give a quick overview of business performance without scrolling through the entire page.
Detailed KPI Table on the Summary Page
Below the KPI cards, you will find a detailed performance table. This table gives complete information about every KPI used in the dashboard.
Here is what you see inside this table:
✔ KPI Number
The sequence number of each KPI.
✔ KPI Group
The category such as:
-
Trip KPIs
-
Revenue KPIs
-
Vehicle KPIs
-
Customer KPIs
-
Operational KPIs
✔ KPI Name
The specific metric name, such as:
-
Gross Fare
-
Net Fare
-
Base Fare
-
Trip Count
-
Trip Duration
-
Customer Rating
-
Promo Usage
-
Surge Trips
-
On-Time Pickup %
✔ Unit
Measurement unit — USD, %, count, hours, etc.
✔ Type (UTB or LTB)
-
UTB (Upper the Better) – Higher values show better performance (e.g., trip count, gross fare)
-
LTB (Lower the Better) – Lower values show better performance (e.g., cancellations, complaints)
MTD and YTD Performance Metrics
The table also includes powerful performance insights like:
Actual CY MTD
Current Year Month-to-Date actual value.
Target CY MTD
Target value for the same period.
MTD Icon
A status icon that shows:
-
▲ Green – Performing better than target
-
▼ Red – Not meeting the target
Target vs Actual (MTD)
Percentage calculation using:
Actual CY MTD / Target CY MTD
This instantly shows performance gaps.
Previous Year Comparison (PY MTD)
The dashboard compares current MTD performance with the same month last year. This helps you understand growth or decline.
CY vs PY (MTD)
Comparison using:
Current MTD / Previous MTD
YTD Performance Section
The dashboard also shows:
-
Actual CY YTD
-
Target CY YTD
-
YTD Icon
-
Target vs Actual (YTD)
-
PY YTD
-
CY vs PY (YTD)
Together, these values give teams a long-term view of business performance.
Click to Purchases Ride-Hailing & Mobility Apps KPI Dashboard in Power BI
2. KPI Trend Page

The KPI Trend Page is designed for performance monitoring over time. It helps answer questions like:
-
How is trip performance changing month-to-month?
-
Are fares increasing or decreasing?
-
Are cancellations rising?
-
Are targets met consistently?
To analyze these questions, the page includes:
✔ KPI Name Slicer
Users can select a KPI to see its monthly performance across the year.
✔ Two Combo Charts
There are two charts:
-
MTD Trend Chart
-
YTD Trend Chart
Each chart shows:
-
Actual Current Year values
-
Previous Year values
-
Target values
These visuals help businesses compare month-wise performance easily.
Click to Purchases Ride-Hailing & Mobility Apps KPI Dashboard in Power BI
3. KPI Definition Page

This is a drill-through page and is hidden from regular view. When you right-click on any KPI on the Summary Page, you can view:
-
KPI Number
-
KPI Group
-
KPI Name
-
Unit
-
Formula
-
KPI Definition
-
Type (UTB or LTB)
This page is especially useful for:
-
New analysts
-
Reporting teams
-
Training purposes
A Back Button on the top-left corner brings you back to the Summary Page.
How Does the Excel Data Source Work?
This dashboard uses an Excel sheet with three tabs:
1. Input_Actual Sheet
Fill the following:
-
KPI Name
-
Month (first date of the month)
-
MTD Actual value
-
YTD Actual value
2. Input_Target Sheet
Fill:
-
KPI Name
-
Month
-
MTD Target
-
YTD Target
3. KPI Definition Sheet
Fill:
-
KPI Number
-
KPI Group
-
KPI Name
-
Unit
-
Formula
-
Definition
-
KPI Type (LTB or UTB)
Once the data is filled, Power BI refreshes and updates all visuals automatically.
Click to Purchases Ride-Hailing & Mobility Apps KPI Dashboard in Power BI
Advantages of Ride-Hailing & Mobility Apps KPI Dashboard in Power BI
Using this dashboard helps businesses improve performance at all levels. Here are the top advantages:
✔ Real-Time Insights
Teams view up-to-date trip numbers, fares, and ratings instantly.
✔ Fast Decision-Making
Managers act quickly when cancellations increase or fares drop.
✔ Better Trip Management
Trends show if trips are increasing or decreasing during peak hours.
✔ Improved Customer Satisfaction
KPIs like rating, cancellation rate, and response time guide improvements.
✔ Better Promo Optimization
You track promo usage and understand discount performance.
✔ Revenue Growth Opportunities
Fare trends highlight areas where earnings can improve.
✔ Easy Reporting
Teams use clean visuals instead of manual spreadsheets.
Click to Purchases Ride-Hailing & Mobility Apps KPI Dashboard in Power BI
Best Practices for Using the Ride-Hailing KPI Dashboard
Follow these best practices to get maximum value:
1. Update Data Regularly
Refresh Excel data daily or weekly for accuracy.
2. Use Clear KPI Definitions
Keep formulas short and easy to understand.
3. Set Smart Targets
Use previous year and past trends while setting goals.
4. Monitor Daily Trends
Use the KPI Trend Page to catch early issues.
5. Reduce Cancellations Fast
Identify which customer type or region shows higher cancel rates.
6. Improve Driver Behaviour
Monitor ratings, trip delays, and incidents.
7. Keep the Dashboard Clean
Remove unused visuals and keep KPIs focused.
Conclusion
The Ride-Hailing & Mobility Apps KPI Dashboard in Power BI is a complete solution for tracking trip performance, customer ratings, fare trends, and operational KPIs. It simplifies complex mobility data, updates instantly, and helps teams take faster decisions.
With its three powerful pages—Summary, KPI Trends, and KPI Definition—this dashboard gives a full 360-degree view of business performance. When mobility companies use this tool consistently, they improve trip quality, reduce cancellations, and enhance customer experience.
Click to Purchases Ride-Hailing & Mobility Apps KPI Dashboard in Power BI
Frequently Asked Questions (FAQs)
1. What is a Ride-Hailing KPI Dashboard?
It is a Power BI report that tracks key metrics related to trips, fares, customers, vehicles, and operations.
2. Can the dashboard connect to Excel?
Yes, this dashboard uses Excel sheets for Actuals, Targets, and KPI Definitions.
3. How many KPIs can I track?
You can track as many KPIs as needed by adding data to the Excel file.
4. Is the dashboard interactive?
Yes, it includes slicers, drill-through pages, combo charts, and dynamic visuals.
5. Who should use this dashboard?
Operations teams, business leaders, analysts, CX teams, and pricing managers.
6. Can I add more visuals to the dashboard?
Yes, you can modify the Power BI file and expand it based on your needs.
Click to Purchases Ride-Hailing & Mobility Apps KPI Dashboard in Power BI
Visit our YouTube channel to learn step-by-step video tutorials