Road and highway construction projects demand strict monitoring. Budgets run into millions. Deadlines stay tight. Quality standards remain non-negotiable. Therefore, project leaders must track every cost element, performance indicator, and completion milestone in one clear system.
However, many construction firms still depend on scattered Excel sheets and manual reports. As a result, managers struggle to see cost overruns early. They miss quality issues. They fail to compare regional performance properly.
So, how can construction companies monitor equipment cost, material usage, labor expense, and project quality in one structured system?
The answer is simple.
Click to Purchases Road and Highway Construction Dashboard in Excel
You need a Road and Highway Construction Dashboard in Excel.
This ready-to-use dashboard centralizes construction KPIs into one powerful Excel reporting solution. Moreover, it gives real-time visibility into project performance. In addition, it helps executives, site engineers, and finance teams make data-driven decisions faster.
In this complete guide, you will learn:
-
What a Road and Highway Construction Dashboard in Excel is
-
Why construction companies need it
-
Detailed explanation of all 5 dashboard pages
-
Advantages of using this dashboard
-
Best practices for implementation
-
Frequently Asked Questions with answers
Let us explore everything step by step.
What Is a Road and Highway Construction Dashboard in Excel?
A Road and Highway Construction Dashboard in Excel is an interactive reporting tool built inside Microsoft Excel. It tracks construction performance indicators such as:
-
Equipment Cost
-
Material Cost
-
Labor Cost
-
Budget vs Actual Cost
-
Quality Score Percentage
-
Completion Percentage
Instead of reviewing multiple files, managers can:
-
Monitor monthly expenses
-
Compare actual cost against budget
-
Analyze performance by region
-
Evaluate project manager efficiency
-
Track highway type performance
Because Excel supports charts, slicers, and pivot tables, the dashboard delivers dynamic insights with just one click.
Why Do Construction Companies Need a Road and Highway Construction Dashboard?
Construction projects involve complex operations. Therefore, companies must track multiple cost heads and quality indicators simultaneously.
Without a structured dashboard:
-
Budgets exceed planned limits
-
Equipment utilization remains unclear
-
Material wastage increases
-
Labor cost rises unexpectedly
-
Quality standards decline
However, with a dashboard:
-
Managers identify cost overruns early
-
Teams compare performance by region or manager
-
Leaders track project progress monthly
-
Executives review financial and quality metrics instantly
For example, if equipment cost rises by 12% in one region, the dashboard highlights it immediately. As a result, managers can take corrective action before losses grow.
Key Features of the Road and Highway Construction Dashboard in Excel
This dashboard includes a clean design and structured analysis pages. Moreover, it contains interactive navigation tools that improve usability.
1️⃣ Page Navigator
The Page Navigator appears on the left side. It allows users to move easily across different analytical pages.
Therefore, users can switch between:
-
Overview Page
-
Highway Type Analysis
-
Project Manager Analysis
-
Region Analysis
-
Month Analysis
This design saves time and improves workflow.
Detailed Explanation of All Dashboard Pages
Let us explore each page in detail.
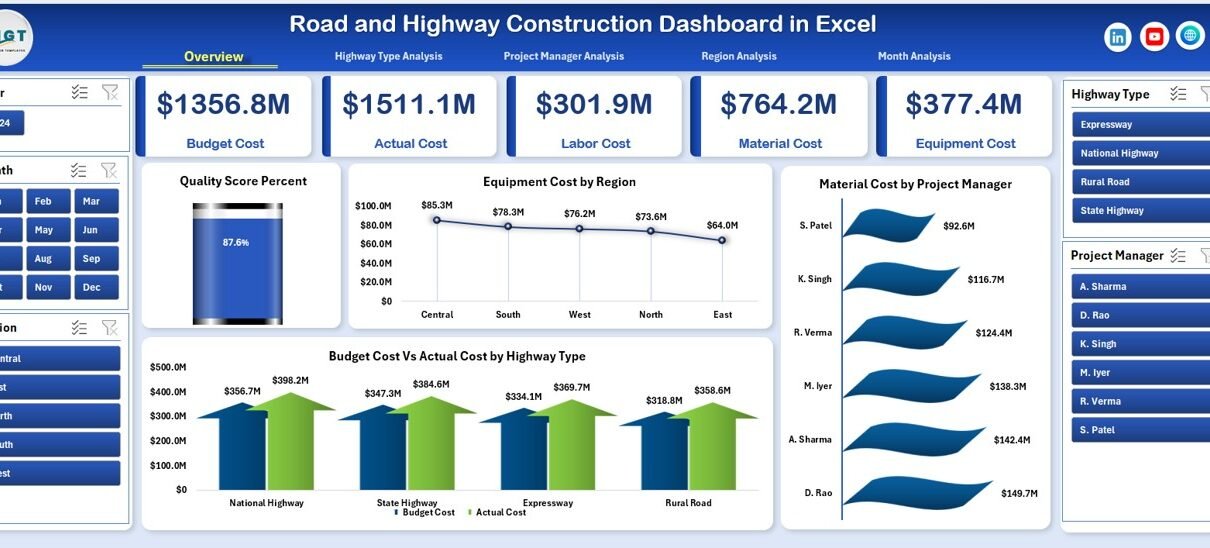
1️⃣ Overview Page – What Does the Main Dashboard Show?
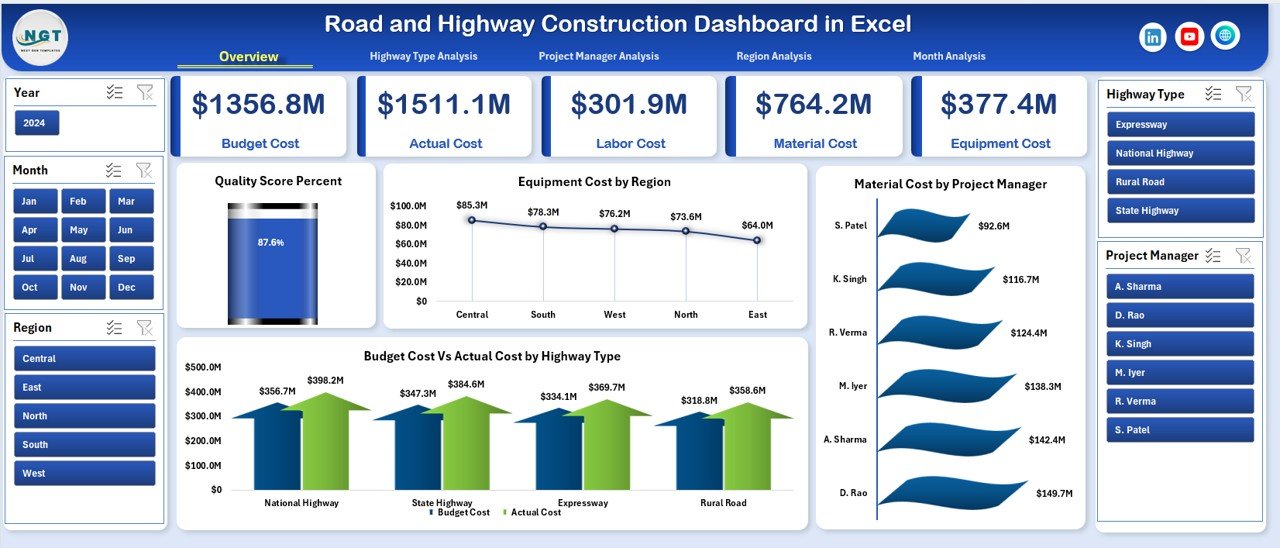
The Overview Page acts as the central control panel.
Key Elements:
-
Right-side slicer for filtering
-
4 KPI cards
-
4 analytical charts
KPI Cards
The dashboard displays four cards that summarize key metrics:
-
Total Budget Cost
-
Total Actual Cost
-
Overall Completion Percentage
-
Average Quality Score %
These cards provide instant performance visibility.
Charts on the Overview Page
📊 Quality Score Percent
This chart shows overall project quality performance. If quality falls below 90%, managers can act immediately.
📊 Equipment Cost by Region
This chart compares equipment expenses across regions.
📊 Material Cost by Project Manager
This view highlights which project manager controls material spending effectively.
📊 Budget Cost vs Actual Cost by Highway Type
This chart compares planned and actual cost across highway types such as:
-
National Highways
-
State Highways
-
Expressways
-
Rural Roads
Therefore, leaders can identify which highway type generates maximum cost variance.
2️⃣ Highway Type Analysis – How Does Cost Vary by Highway Type?
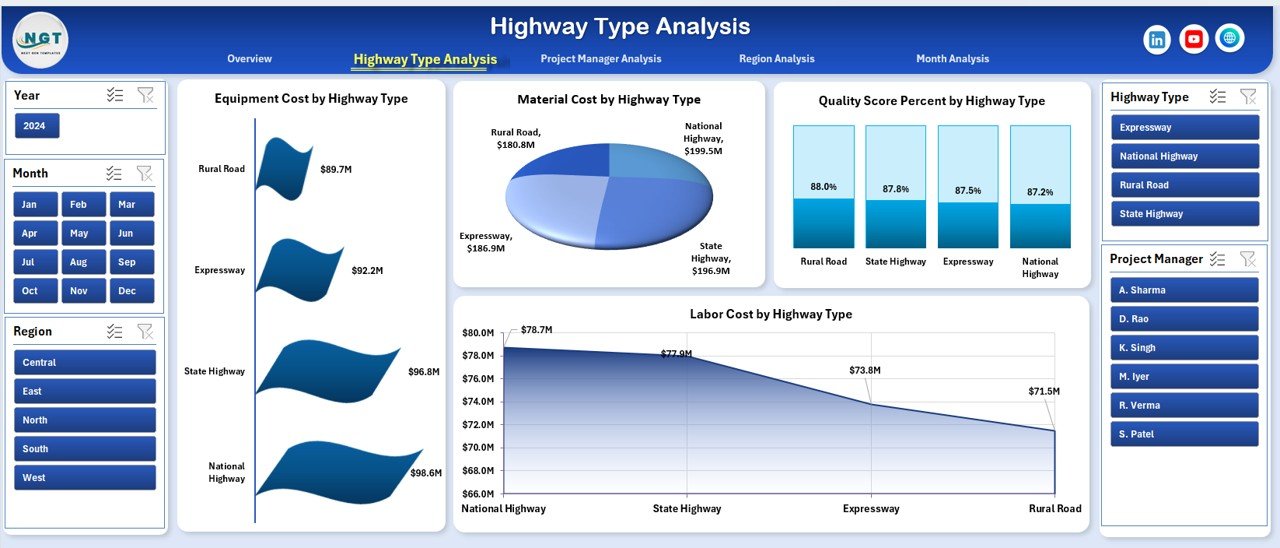
Highway Type Analysis provides deeper insights into each construction category.
It includes 4 Charts:
-
Equipment Cost by Highway Type
-
Material Cost by Highway Type
-
Quality Score Percentage by Highway Type
-
Labor Cost by Highway Type
For example:
-
Expressways may require higher equipment cost.
-
Rural roads may have lower material expense.
Because each highway type differs in design and complexity, this page helps management allocate resources wisely.
Click to Purchases Road and Highway Construction Dashboard in Excel
3️⃣ Project Manager Analysis – Who Controls Cost and Quality Better?
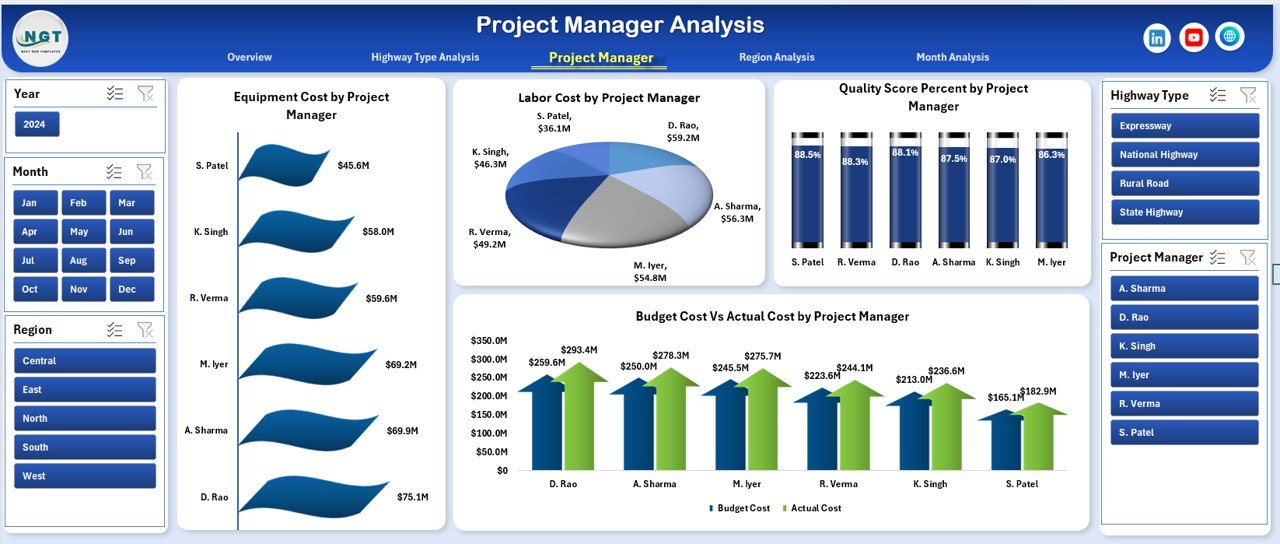
Project Manager Analysis evaluates individual performance.
Charts Included:
-
Equipment Cost by Project Manager
-
Quality Score Percentage by Project Manager
-
Labor Cost by Project Manager
-
Budget Cost vs Actual Cost by Project Manager
Therefore, leadership can:
-
Compare cost control ability
-
Evaluate project quality standards
-
Identify high-performing managers
-
Detect areas needing improvement
For instance, if one manager keeps labor cost 8% lower than average while maintaining 95% quality score, that manager sets a benchmark for others.
4️⃣ Region Analysis – Which Region Performs Better?
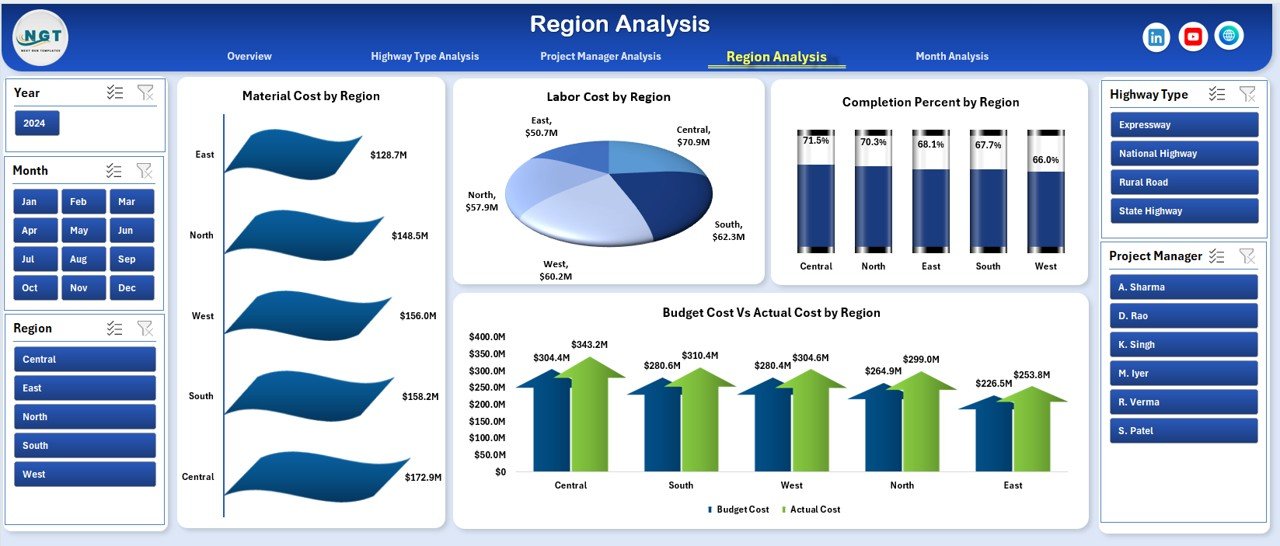
Construction companies operate in multiple regions. Therefore, regional comparison remains essential.
This page includes:
-
Material Cost by Region
-
Labor Cost by Region
-
Completion Percentage by Region
-
Budget Cost vs Actual Cost by Region
As a result:
-
Leaders detect regional inefficiencies
-
Finance teams control cost escalation
-
Operations teams improve resource distribution
If the North region shows 85% completion while the South region shows 92%, management can analyze delays instantly.
5️⃣ Month Analysis – How Does Performance Change Over Time?
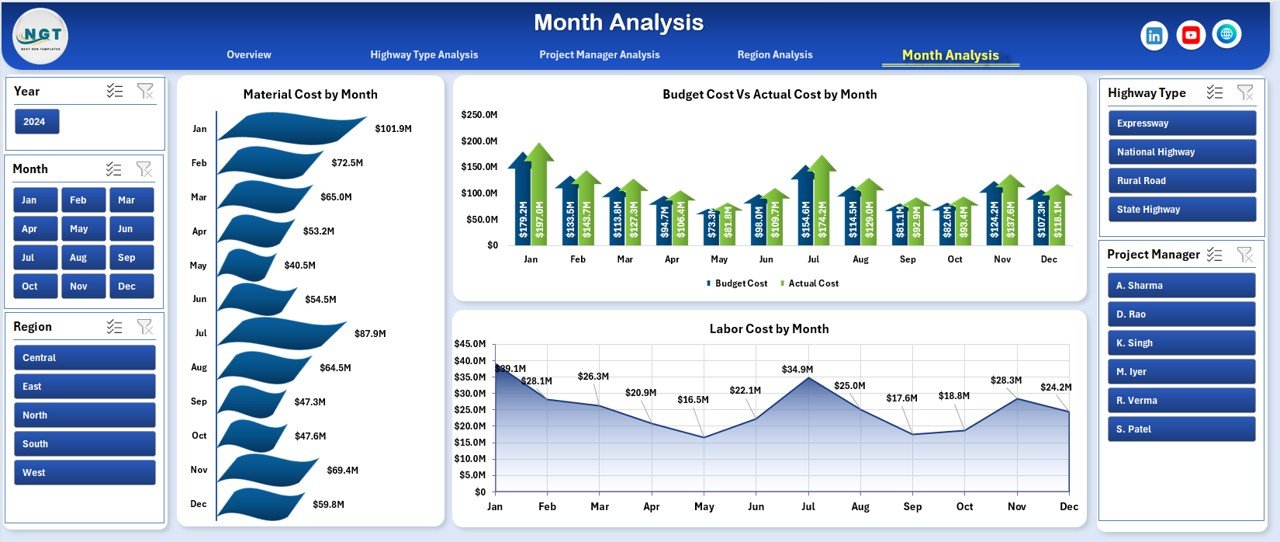
Month Analysis tracks trends across months.
Charts Included:
-
Material Cost by Month
-
Labor Cost by Month
-
Budget Cost vs Actual Cost by Month
Because construction projects evolve monthly, this page helps track:
-
Seasonal cost variation
-
Material price fluctuations
-
Labor cost trends
-
Budget deviations
For example, monsoon months may increase material waste. The dashboard reveals this trend clearly.
What Data Does the Dashboard Use?
The dashboard includes two important sheets:
1️⃣ Data Sheet
This sheet stores:
-
Project Name
-
Region
-
Highway Type
-
Project Manager
-
Equipment Cost
-
Material Cost
-
Labor Cost
-
Budget Cost
-
Actual Cost
-
Quality Score %
-
Completion %
-
Month
Because the dashboard connects to this structured data, it updates automatically.
Click to Purchases Road and Highway Construction Dashboard in Excel
2️⃣ Support Sheet
This sheet stores:
-
Pivot tables
-
Helper calculations
-
Data validation lists
Therefore, the dashboard maintains clean structure and smooth performance.
Advantages of Road and Highway Construction Dashboard in Excel
Now let us explore the major benefits.
1️⃣ Centralized Cost Control
The dashboard consolidates equipment, labor, and material cost into one system. As a result, managers reduce reporting errors.
2️⃣ Real-Time Decision Making
Because Excel updates instantly, leaders identify cost overruns quickly.
3️⃣ Better Resource Allocation
Managers compare performance by region and highway type. Therefore, they allocate machinery and workforce efficiently.
4️⃣ Improved Quality Monitoring
Quality Score Percentage remains visible at all times. Hence, teams maintain construction standards above 90%.
5️⃣ Budget Optimization
The Budget vs Actual chart highlights cost deviation clearly. Consequently, finance teams prevent overspending.
6️⃣ Enhanced Accountability
Project Manager Analysis increases transparency. Therefore, each manager focuses on performance improvement.
Best Practices for the Road and Highway Construction Dashboard
To maximize results, follow these best practices.
1️⃣ Update Data Monthly
Always enter accurate monthly data. Without consistent updates, analysis loses accuracy.
2️⃣ Use Structured Data Format
Avoid blank rows. Keep consistent column names. Therefore, pivot tables work smoothly.
3️⃣ Monitor Quality Score Weekly
Do not wait for monthly review. Instead, track quality weekly to prevent rework.
4️⃣ Set Clear Budget Thresholds
Define acceptable variance, such as:
-
±5% for equipment cost
-
±3% for material cost
This method ensures quick corrective action.
5️⃣ Train Project Managers
Teach managers how to interpret charts. When they understand numbers clearly, they improve decision-making speed.
How Does This Dashboard Improve Profitability?
Construction margins remain tight, often between 5% to 12%. Therefore, small cost savings create significant profit impact.
For example:
-
If a ₹50 crore project reduces cost by 2%, it saves ₹1 crore.
-
If quality rework reduces by 10%, profit increases directly.
Because the dashboard reveals hidden inefficiencies, companies protect margins effectively.
Who Should Use This Dashboard?
This dashboard suits:
-
Construction Company Owners
-
Project Managers
-
Site Engineers
-
Finance Controllers
-
Regional Heads
-
Infrastructure Consultants
Therefore, any stakeholder involved in road or highway projects can benefit.
Conclusion
Road and highway construction projects require strict cost control, quality monitoring, and timely completion. However, manual reporting creates confusion and delays.
The Road and Highway Construction Dashboard in Excel solves this problem effectively. It centralizes cost data, compares budget vs actual performance, tracks regional efficiency, and measures quality scores.
Moreover, it delivers actionable insights through interactive charts and slicers. As a result, companies reduce cost overruns, improve quality, and increase profitability.
If you manage infrastructure projects, this dashboard can transform your reporting process immediately.
Frequently Asked Questions with Answers
1️⃣ What is a Road and Highway Construction Dashboard in Excel?
It is an interactive Excel tool that tracks construction cost, quality, and completion metrics in one structured reporting system.
2️⃣ Can small construction companies use this dashboard?
Yes. Small companies benefit even more because they need strict cost control.
3️⃣ How often should I update the dashboard?
You should update it monthly. However, you can also update weekly if needed.
4️⃣ Does the dashboard require advanced Excel skills?
No. Basic Excel knowledge helps. Moreover, the ready-to-use format simplifies usage.
5️⃣ Can I customize the dashboard?
Yes. You can add new KPIs, regions, or highway types according to your project needs.
6️⃣ How does this dashboard reduce cost overruns?
It highlights budget vs actual variance instantly. Therefore, managers act before expenses increase further.
Visit our YouTube channel to learn step-by-step video tutorials