Running a SaaS company without clear KPIs feels like driving without a dashboard. You move forward, but you don’t know your speed, fuel level, or direction. However, when you track the right metrics in one structured system, you make smarter decisions, faster.That is exactly why a SaaS Development KPI Dashboard in Excel becomes a game changer.In this detailed guide, you will learn:
- What a SaaS Development KPI Dashboard in Excel is
- Why SaaS companies need it
- Complete explanation of all 7 worksheets
- Key SaaS KPIs you should track
- Advantages of SaaS Development KPI Dashboard in Excel
- Best Practices for the SaaS Development KPI Dashboard
- Frequently Asked Questions with Answers
Click to buy SaaS Development KPI Dashboard in Excel
What Is a SaaS Development KPI Dashboard in Excel?
A SaaS Development KPI Dashboard in Excel is a ready-to-use performance tracking template designed specifically for SaaS businesses. It helps founders, product managers, and operations teams monitor development performance, revenue metrics, customer behavior, and growth indicators in one centralized system.
Instead of using scattered spreadsheets, you can:
- Track MTD (Month-To-Date) performance
- Monitor YTD (Year-To-Date) performance
- Compare Target vs Actual
- Compare Previous Year vs Current Year
- Analyze KPI trends with charts
- Use conditional formatting arrows for instant insights
As a result, you save time and improve decision-making clarity.
Why Do SaaS Companies Need a KPI Dashboard in Excel?
SaaS businesses grow fast. However, growth without control creates chaos.
You need clarity on:
- Monthly Recurring Revenue (MRR)
- Customer Acquisition Cost (CAC)
- Churn Rate
- Feature Release Velocity
- Active Users
- Conversion Rate
If you track these metrics manually, you waste time. On the other hand, if you use a structured KPI dashboard, you gain instant visibility.
Moreover, Excel provides flexibility. You can customize formulas, adjust KPIs, and scale as your business grows.
Therefore, a SaaS Development KPI Dashboard in Excel gives you control, speed, and insight — all in one place.
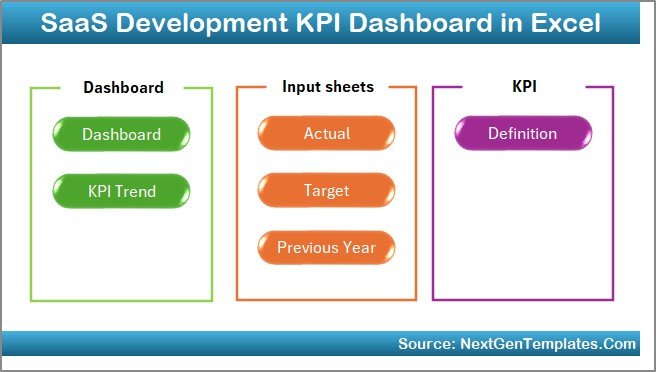
How Is the SaaS Development KPI Dashboard in Excel Structured?
This dashboard includes 7 powerful worksheets, and each sheet plays a critical role.
Let’s break them down clearly.
Summary Page
The Summary Page works as the index sheet.
Here, you get:
- 6 navigation buttons
- Quick access to all sheets
- Simple and clean layout
Instead of searching manually, you click a button and jump directly to the required sheet.
As a result, you improve usability and user experience.
Click to buy SaaS Development KPI Dashboard in Excel
Dashboard Sheet
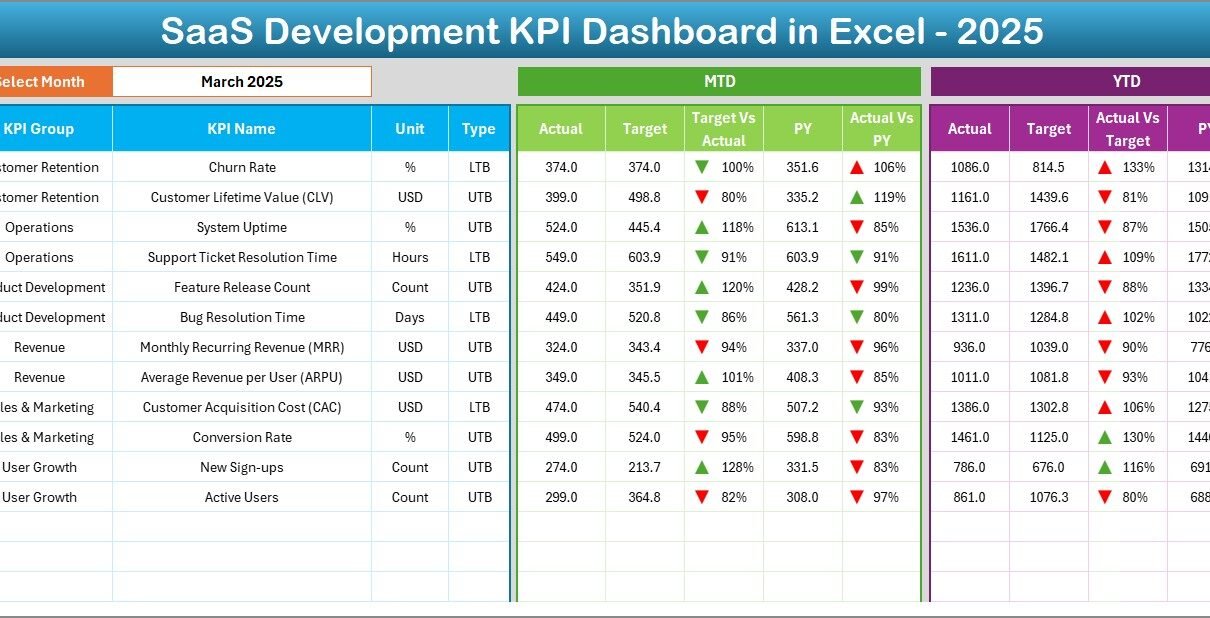
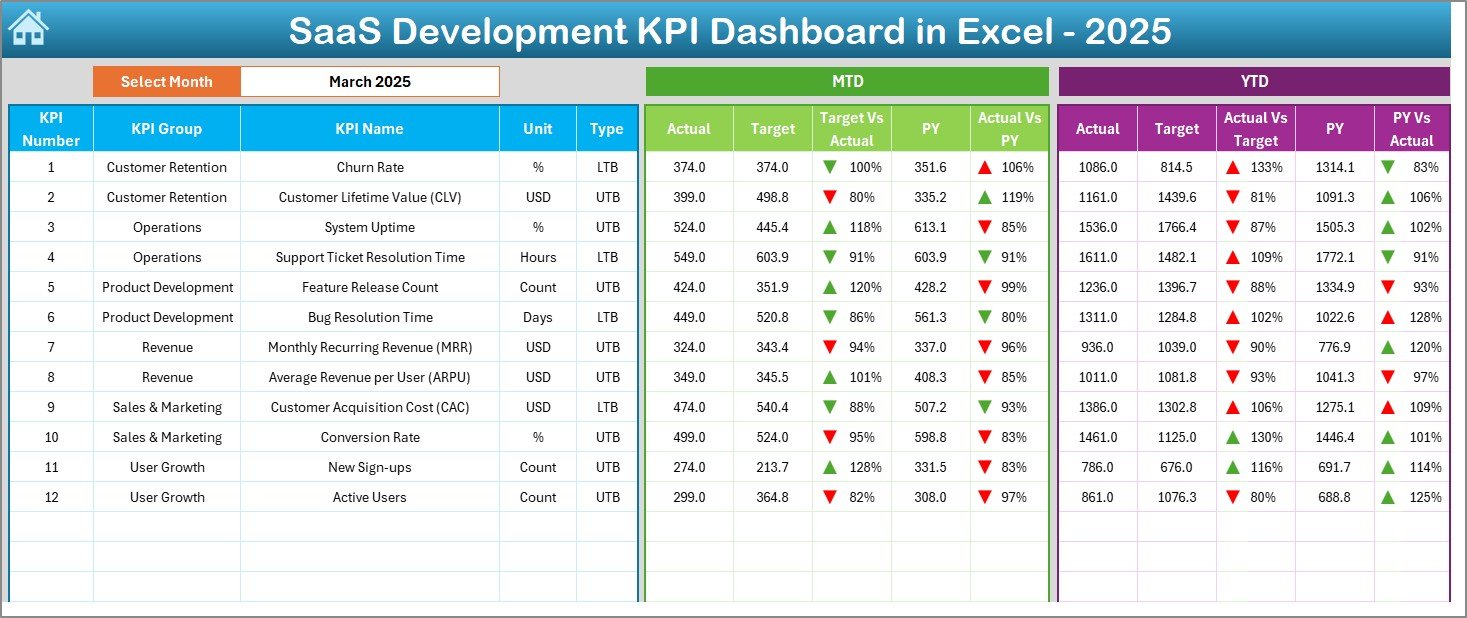
The Dashboard Sheet serves as the main control center.
Month Selection (Cell D3)
You can select the month from the drop-down in Range D3.
Once you select a month:
- All MTD numbers change automatically
- All YTD numbers update instantly
- All comparisons refresh
This dynamic feature saves hours of manual reporting.
What Data Does the Dashboard Show?
The dashboard displays:
MTD Section
- MTD Actual
- MTD Target
- MTD Previous Year
- Target vs Actual (%)
- Previous Year vs Actual (%)
- Conditional formatting arrows (Up/Down)
YTD Section
- YTD Actual
- YTD Target
- YTD Previous Year
- Target vs Actual (%)
- Previous Year vs Actual (%)
- Conditional formatting arrows
Because of this structured comparison, you immediately identify:
- Overperforming KPIs
- Underperforming KPIs
- Growth trends
- Warning signals
Moreover, color-coded arrows improve readability.
Click to buy SaaS Development KPI Dashboard in Excel
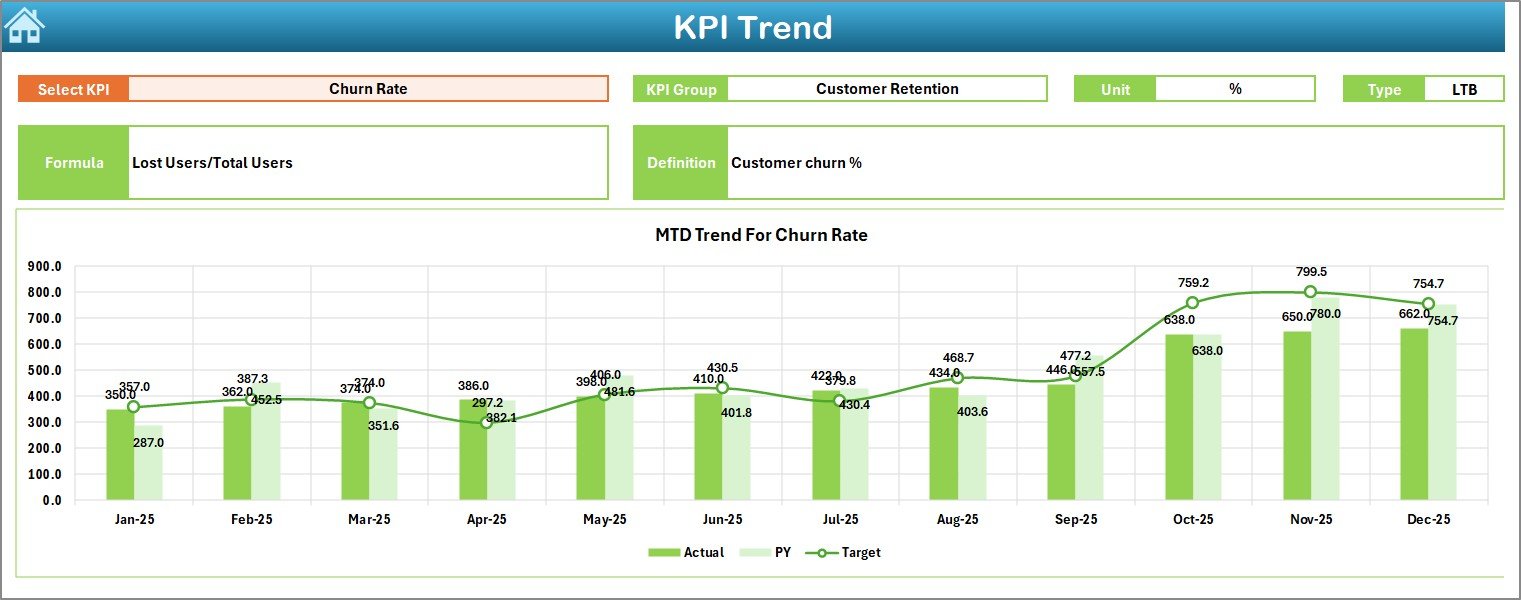
Trend Sheet
The Trend Sheet Tab gives deeper analysis.
KPI Selection (Cell C3)
You can select any KPI from the drop-down in Range C3.
Once selected, the sheet displays:
- KPI Group
- Unit
- KPI Type (Lower the Better / Upper the Better)
- Formula
- Definition
In addition, it shows:
- MTD Trend Chart (Actual, Target, PY)
- YTD Trend Chart (Actual, Target, PY)
Therefore, you do not just see numbers. Instead, you see patterns.
For example:
- If churn rate rises for 3 consecutive months, you take immediate action.
- If MRR grows steadily, you plan expansion.
Because trends tell stories, this sheet becomes extremely powerful.
Click to buy SaaS Development KPI Dashboard in Excel
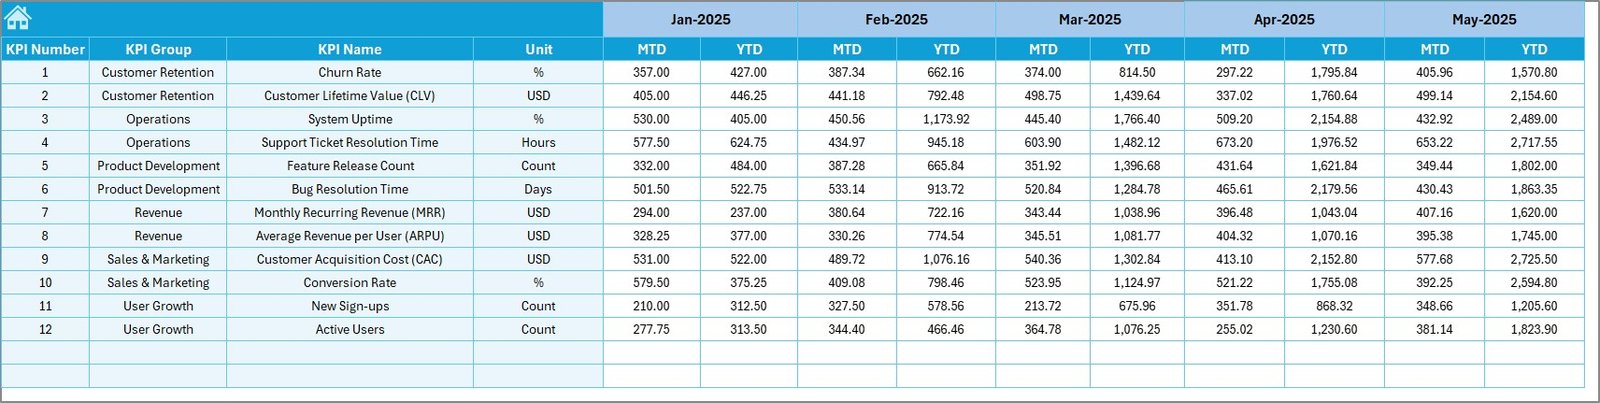
Actual Numbers Input Sheet
The Actual Numbers Input Sheet stores current year data.
Key Feature:
- Change the first month of the year in Range E1.
After that, enter:
- MTD numbers
- YTD numbers
This structured input ensures consistency.
Instead of editing formulas, you simply input data.
Click to buy SaaS Development KPI Dashboard in Excel
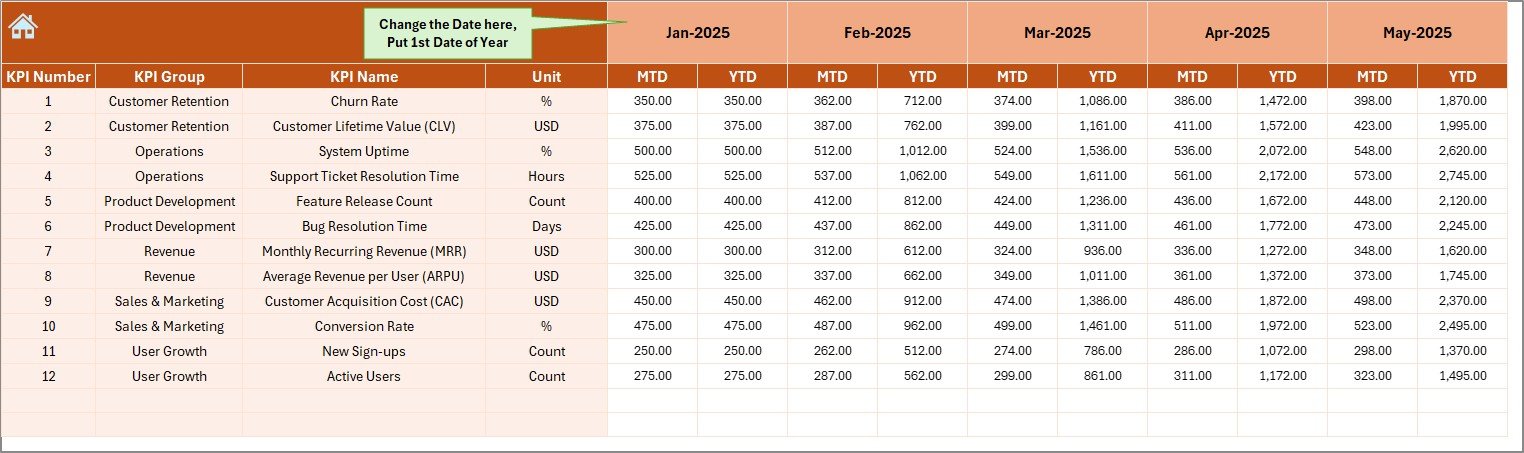
Target Sheet
In the Target Sheet, you enter:
- Monthly MTD Targets
- Monthly YTD Targets
Because targets drive performance, this sheet becomes critical.
You can:
- Increase revenue targets
- Adjust development velocity targets
- Reduce churn targets
Therefore, you align your goals clearly.
Click to buy SaaS Development KPI Dashboard in Excel
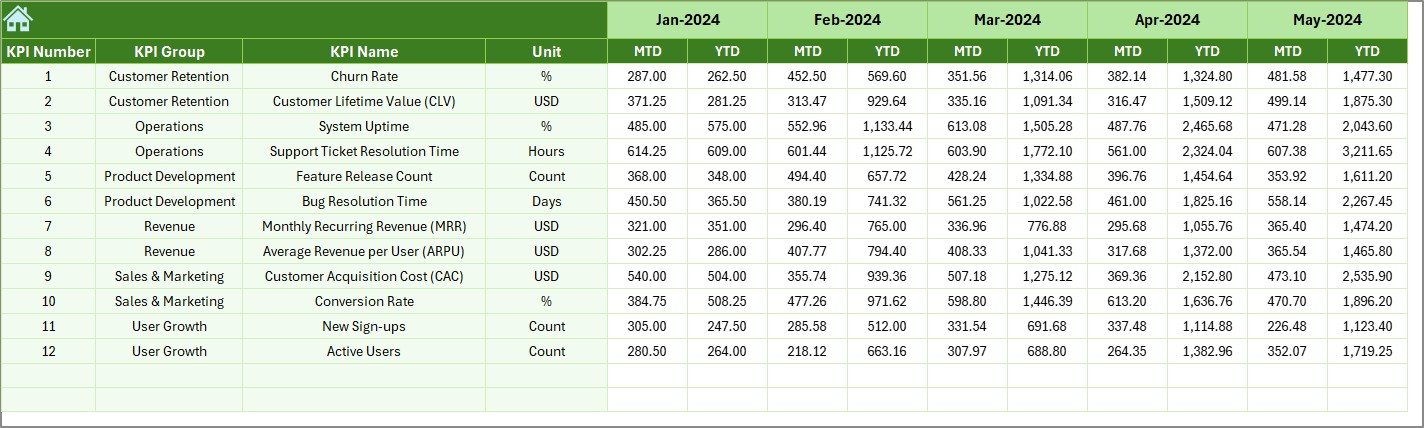
Previous Year Sheet
The Previous Year Number Sheet stores historical data.
You enter previous year MTD and YTD values.
Then, the dashboard compares:
- Current year vs previous year
- Growth rate
- Improvement trends
As a result, you measure true progress.
Click to buy SaaS Development KPI Dashboard in Excel
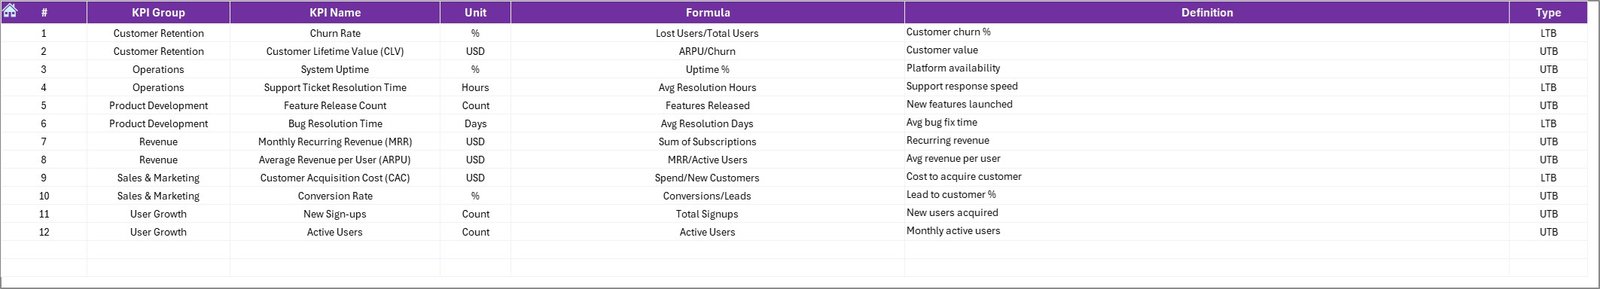
KPI Definition Sheet
The KPI Definition Sheet provides structure.
You enter:
- KPI Name
- KPI Group
- Unit
- Formula
- KPI Definition
This sheet ensures clarity.
Because every KPI has a formula and definition, teams avoid confusion.
Click to buy SaaS Development KPI Dashboard in Excel
Which KPIs Should You Track in a SaaS Development KPI Dashboard?
Here are some essential SaaS KPIs:
Revenue KPIs
- Monthly Recurring Revenue (MRR)
- Annual Recurring Revenue (ARR)
- Average Revenue Per User (ARPU)
Customer KPIs
- Customer Acquisition Cost (CAC)
- Customer Lifetime Value (CLV)
- Churn Rate
- Retention Rate
Product Development KPIs
- Feature Release Cycle Time
- Bug Resolution Rate
- Deployment Frequency
Engagement KPIs
- Daily Active Users (DAU)
- Monthly Active Users (MAU)
- Conversion Rate
Because SaaS businesses rely on subscriptions, these metrics directly impact profitability.
Advantages of SaaS Development KPI Dashboard in Excel
Using this dashboard gives multiple advantages.
- Centralized Reporting
You track everything in one file. Therefore, you avoid scattered spreadsheets.
- Dynamic Month Selection
With one dropdown, the entire dashboard updates instantly.
- Clear Performance Comparison
You compare:
- Actual vs Target
- Actual vs Previous Year
As a result, you make faster decisions.
- Visual Indicators
Up/down arrows and conditional formatting highlight performance instantly.
- Trend Analysis
Charts show growth direction clearly.
- Easy Customization
Excel allows formula adjustments, new KPIs, and additional analysis.
- Cost-Effective
You do not need expensive BI tools for early-stage SaaS companies.
How Can You Improve Decision-Making Using This Dashboard?
You can use this dashboard for:
- Monthly board meetings
- Investor reporting
- Internal team reviews
- Growth planning
- Risk identification
For example:
If CAC rises while MRR stays flat, you revise marketing strategy.
If churn increases, you improve onboarding.
If development velocity slows, you review sprint processes.
Therefore, the dashboard supports strategic action.
Best Practices for the SaaS Development KPI Dashboard
To get maximum benefit, follow these best practices.
- Update Data Monthly Without Delay
Enter actual numbers consistently. Do not skip months.
- Define KPIs Clearly
Use the KPI Definition sheet properly. Write simple formulas.
- Avoid Too Many KPIs
Track only meaningful metrics. Focus on 15–25 core KPIs.
- Review Trends, Not Just Numbers
Look at 3–6 month trends before making decisions.
- Align Targets with Business Goals
Set realistic targets. However, push for growth.
- Use Conditional Formatting Properly
Ensure arrows reflect correct KPI type (LTB or UTB).
- Back Up the File Regularly
Protect historical data.
How Does This Dashboard Help in SaaS Growth?
This dashboard supports growth in three major ways:
- Financial Growth
You monitor revenue, profitability, and acquisition costs.
- Product Growth
You track feature releases and deployment efficiency.
- Customer Growth
You measure retention and engagement.
Because SaaS revenue compounds over time, small improvements create large impact.
Conclusion
SaaS companies operate in a fast-moving environment. However, growth without measurement leads to confusion.
A SaaS Development KPI Dashboard in Excel gives you structure, clarity, and control. It centralizes reporting, simplifies analysis, and highlights performance instantly.
Moreover, with 7 structured worksheets — including Summary, Dashboard, Trend, Actual Input, Target, Previous Year, and KPI Definition — this template covers every aspect of SaaS performance tracking.
If you want smarter decisions, better growth visibility, and structured KPI management, this dashboard becomes an essential tool.
Frequently Asked Questions with Answers
- What is the main purpose of a SaaS Development KPI Dashboard in Excel?
It helps SaaS companies track revenue, customer, and development metrics in one centralized system.
- Can startups use this dashboard?
Yes. Early-stage SaaS startups benefit greatly because Excel remains affordable and flexible.
- What does MTD and YTD mean?
- MTD = Month-To-Date performance
- YTD = Year-To-Date performance
- Why compare with previous year data?
Previous year comparison shows real growth and performance improvement.
- How often should I update the dashboard?
You should update it monthly. However, high-growth SaaS companies can update it weekly.
- Can I customize the KPIs?
Yes. You can add or remove KPIs based on your SaaS model.
- Does this dashboard require advanced Excel skills?
No. You only need basic Excel knowledge to input data and use dropdown selections.
Visit our YouTube channel to learn step-by-step video tutorials
Watch the step-by-step video tutorial:
Click to buy SaaS Development KPI Dashboard in Excel