SaaS Financial Model Dashboard in Excel — Track MRR, Revenue, Churn, and Profitability
SaaS Financial Model Dashboard in Excel is a professionally designed, interactive financial analytics template that helps SaaS founders, CFOs, finance analysts, and subscription business managers track Total MRR, Total Revenue, Total New Customers, Total Churned, and Total Expansion Revenue from a single, powerful Excel dashboard. This template includes 5 interactive dashboard pages — Overview, Revenue Breakdown, Customer Metrics, Profitability, and Retention Analysis — plus a dedicated Data Sheet and Support Sheet for seamless data management. If you are searching for the best way to build a SaaS financial model in Excel, this dashboard template gives you everything you need out of the box.
Whether you are running a SaaS startup or managing the finances of an established subscription business, this dashboard transforms raw financial data into stunning, actionable insights. Explore additional SaaS analytics solutions like the SaaS Metrics Dashboard in Excel and the Subscription Business Dashboard in Power BI for complementary financial reporting capabilities.Click here to Purchase SaaS Financial Model Dashboard in Excel
Key Features of SaaS Financial Model Dashboard in Excel
This Excel dashboard template is built with a pivot-driven architecture that allows all 20+ charts and 5 KPI cards to update automatically when you refresh your data. The template includes interactive slicers for instant filtering by plan type, region, industry, billing cycle, and payment method. It is designed for Microsoft Excel 2016 and later — no macros or VBA required.
- 5 Interactive Dashboard Pages — Overview, Revenue Breakdown, Customer Metrics, Profitability, and Retention Analysis
- 5 KPI Cards — Total MRR, Total Revenue, Total New Customers, Total Churned, Total Expansion Revenue
- 20+ Dynamic Charts — Revenue by Plan, MRR by Region, CAC by Plan, Churned by Month, and many more
- Slicer-Powered Filtering — Filter the entire dashboard instantly by any dimension
- Plug-and-Play Data Sheet — Replace sample data with your own records and click Refresh All
- Support Sheet with Pivot Tables — Hidden sheet powers all charts dynamically
Dashboard Pages Explained
1. Overview Page
The Overview page is the main command center of the SaaS Financial Model Dashboard in Excel. At the top, 5 high-level KPI cards display Total MRR, Total Revenue, Total New Customers, Total Churned, and Total Expansion Revenue. Below the cards, 4 dynamic charts provide quick visual analysis: Total Records by Payment Method shows how customers pay, Total Revenue by Sales Channel reveals which channels drive the most revenue, Total MRR by Plan breaks down recurring revenue across subscription tiers, and Total Revenue Vs Total Cost of Revenue by Month highlights monthly profitability trends. Multiple slicers allow you to filter everything instantly.
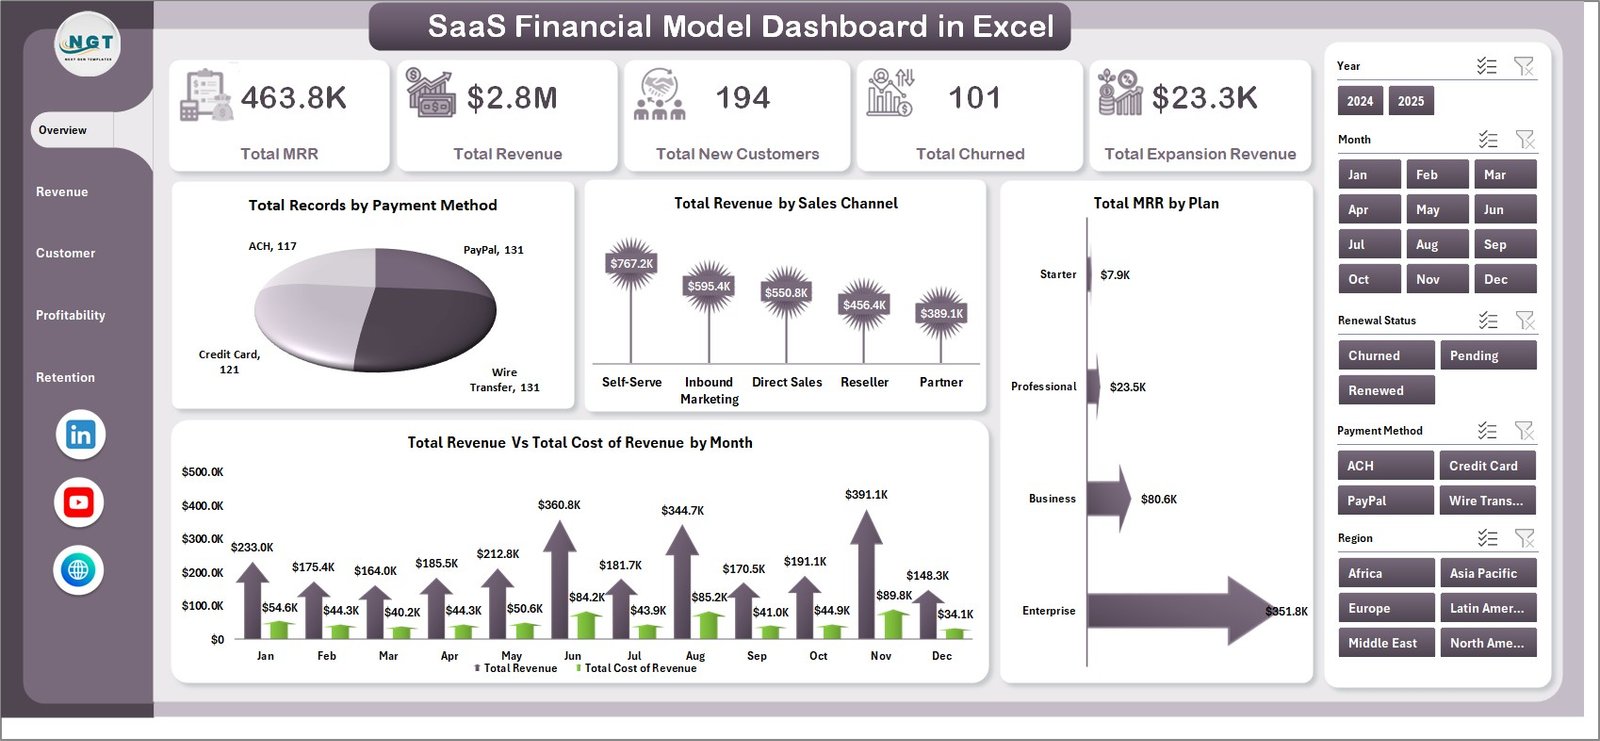
SaaS Financial Model Dashboard in Excel
2. Revenue Breakdown
The Revenue Breakdown page dives deep into where your revenue comes from. It includes 4 focused charts: Total Revenue by Plan shows which subscription tiers generate the most income, Total Revenue by Billing Cycle compares monthly vs annual billing performance, Total Expansion Revenue by Sales Channel identifies upsell and cross-sell success across channels, and Total Revenue Vs Total MRR by Industry reveals how different industries contribute to both total revenue and recurring revenue. This page is essential for understanding revenue composition and identifying growth opportunities.

Revenue Breakdown
3. Customer Metrics
The Customer Metrics page focuses on acquisition and churn analysis. It features 4 charts: Total New Customers by Region shows geographic acquisition patterns, Total New Customers by Plan reveals which subscription tiers attract the most customers, Total New Customers Vs Total Records by Industry compares new sign-ups against total customer base across industries, and Total New Customers Vs Total Churned by Month provides a month-over-month view of growth versus attrition. Use this page to identify which regions and plans are driving the healthiest growth.
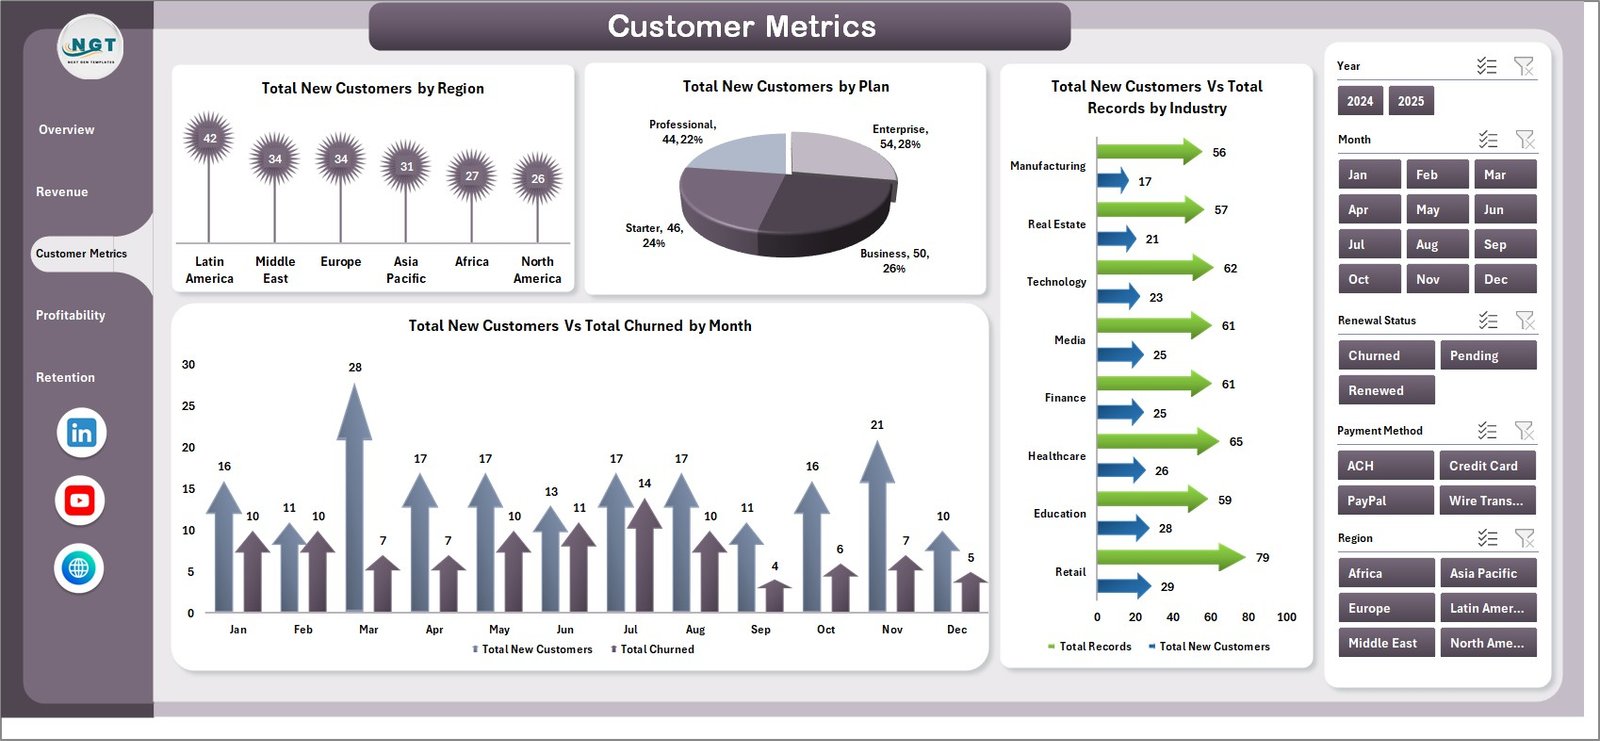
Customer Metrics
4. Profitability
The Profitability page evaluates your bottom line with 4 insightful charts: Total Cost of Revenue by Month tracks your monthly cost structure, Total Expansion Revenue by Plan shows upsell revenue across subscription tiers, Total MRR by Region identifies which geographic markets contribute the most recurring revenue, and Total Revenue Vs Total Cost of Revenue by Industry compares revenue against costs across different industries. This page helps you spot cost overruns and identify your most profitable segments.
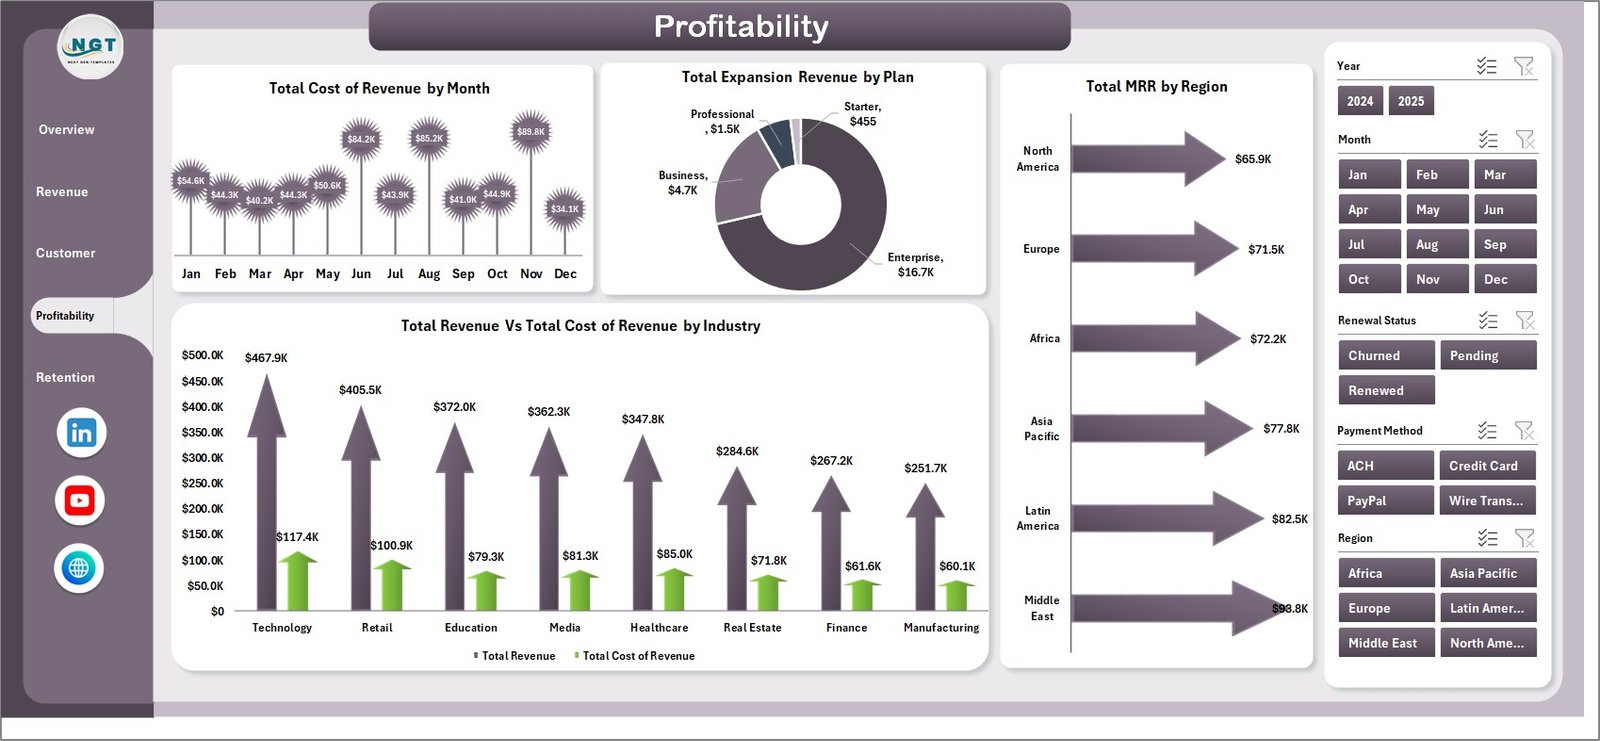
Profitability
5. Retention Analysis
The Retention Analysis page monitors customer retention health through 4 key charts: Avg. CAC by Plan compares customer acquisition cost across subscription tiers, Total Records by Renewal Status shows the split between renewed and non-renewed customers, Total Churned by Month tracks monthly churn trends over time, and Total Revenue by Payment Method analyzes revenue distribution across different payment methods. This page is critical for understanding your unit economics and predicting future retention rates.
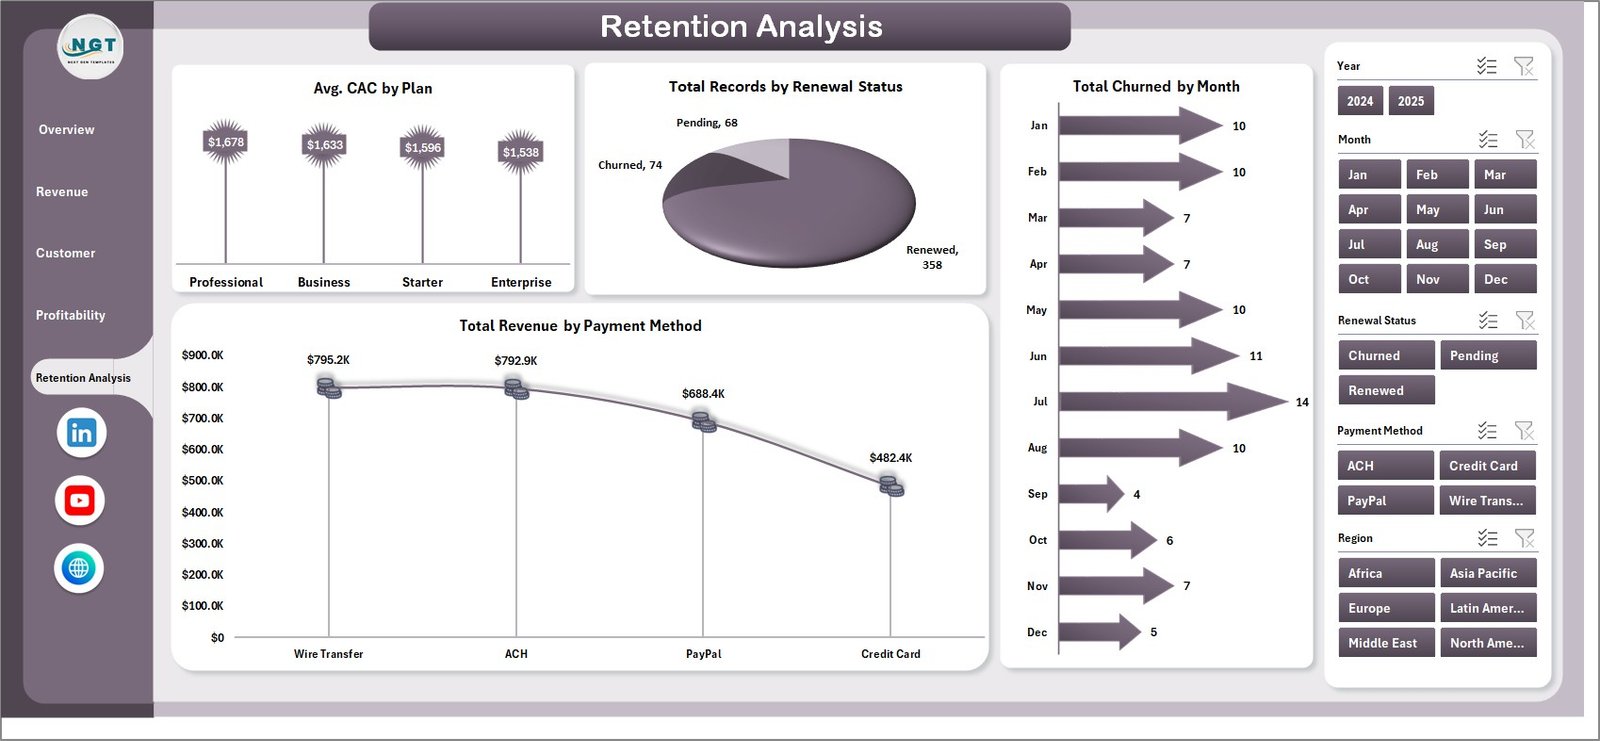
Retention Analysis
6. Data Sheet
The Data Sheet is where you enter all your raw SaaS financial data. Simply replace the sample records with your own data in the same column format. The dashboard is designed to accommodate hundreds of records. After updating the data, navigate to the Data tab in the Excel Ribbon and click Refresh All — every chart and KPI across all 5 dashboard pages will update automatically.

Data Sheet Tab
7. Support Sheet
The Support Sheet contains multiple pivot tables that power every chart and KPI card in the dashboard. These pivot tables are connected to the Data Sheet and update automatically when you click Refresh All. You can keep this sheet hidden during everyday use — it works silently behind the scenes to ensure your dashboard stays dynamic and accurate.

Support Sheet Tab
Advantages of SaaS Financial Model Dashboard in Excel
- All-in-One Financial Visibility — Track MRR, revenue, churn, profitability, and retention from a single workbook instead of juggling multiple reports
- No Technical Skills Required — Swap sample data with your own records and refresh — zero formulas to write, zero macros to configure
- Investor-Ready Presentation — Professional charts and KPI cards that can be directly used in board meetings and investor pitch decks
- Multi-Dimensional Analysis — Slicers let you filter by plan, region, industry, billing cycle, and payment method for granular insights
- Scalable Architecture — Pivot-driven design handles growing data volumes without performance degradation
Opportunities for Improvement
- Adding a cohort analysis page would enable tracking of retention rates by customer acquisition month, which is a standard SaaS metric that many investors look for
- A dedicated forecasting section with scenario modeling (best case, base case, worst case) would help CFOs plan for different growth trajectories
- Integrating an LTV (Lifetime Value) calculation alongside CAC would complete the unit economics picture and provide a clearer view of customer profitability
- Adding conditional formatting to KPI cards to show red/green indicators based on targets would make anomaly detection faster
Best Practices for Using This SaaS Financial Model Dashboard
- Update Data Monthly — For the most accurate trend analysis, refresh your data on a consistent monthly schedule
- Use Slicers for Presentations — When presenting to stakeholders, use slicers to focus on specific regions, plans, or time periods for targeted discussions
- Keep the Support Sheet Hidden — The pivot tables work behind the scenes. Hide the Support Sheet for a cleaner user experience
- Back Up Before Editing — Always save a backup copy before making structural changes to charts or pivot tables
- Compare Against Benchmarks — Use the Profitability page to compare your cost of revenue ratios against industry benchmarks from Microsoft Learn or SaaS survey data to contextualize your performance
Explore Relevant Templates
If you found the SaaS Financial Model Dashboard in Excel useful, check out these related templates on NextGenTemplates.com:
- SaaS Metrics Dashboard in Excel — Track ARR, LTV, customer growth, and core SaaS metrics with interactive Excel charts
- Subscription Business Dashboard in Excel — Analyze subscription revenue, renewal rates, and billing trends
- Small Business CFO Dashboard in Excel — A CFO-level financial dashboard for small business owners
- SaaS Metrics Dashboard in Power BI — For teams using Power BI for advanced SaaS analytics
- Digital Marketing Campaign Dashboard in Excel — Track marketing spend and campaign ROI alongside your financial model
Frequently Asked Questions
What is the best Excel template for building a SaaS financial model?
The SaaS Financial Model Dashboard in Excel is one of the best templates for building a complete SaaS financial model. It tracks 5 key KPIs including Total MRR, Total Revenue, Total New Customers, Total Churned, and Total Expansion Revenue across 5 interactive dashboard pages with 20+ dynamic charts.
How do I track MRR and churn in Excel?
You can track MRR and churn using the SaaS Financial Model Dashboard in Excel. Enter your subscription data in the Data Sheet, click Refresh All, and the dashboard automatically calculates and visualizes MRR trends, churn rates, and retention metrics across dedicated Customer Metrics and Retention Analysis pages.
Do I need advanced Excel skills to use this SaaS dashboard?
No. The template uses pivot tables and slicers that update automatically. Simply replace the sample data with your own SaaS records in the Data Sheet and click Refresh All in the Excel Data tab. No formulas, macros, or VBA skills required.
Can I customize the dashboard for my specific SaaS business?
Yes. The dashboard is fully customizable. You can modify chart types, add new KPI cards, change color schemes, adjust pivot table fields, and add new data columns to match your unique SaaS business model.
What SaaS metrics does this dashboard track?
The dashboard tracks Total MRR, Total Revenue, Total New Customers, Total Churned, Total Expansion Revenue, Revenue by Plan, Revenue by Billing Cycle, Revenue by Sales Channel, Revenue by Industry, New Customers by Region, CAC by Plan, Renewal Status, Cost of Revenue, and Profitability by Industry.
Is this template compatible with Google Sheets?
This template is optimized for Microsoft Excel 2016 and later. Pivot tables and slicers work best in Excel. For a Google Sheets alternative, visit Google Sheets Dashboard Templates on NextGenTemplates.com.
Conclusion
The SaaS Financial Model Dashboard in Excel is a comprehensive, plug-and-play financial analytics template that delivers instant visibility into MRR, revenue, churn, profitability, and customer retention — all from a single Excel workbook. With 5 interactive dashboard pages, 20+ dynamic charts, and slicer-powered filtering, this template empowers SaaS founders, CFOs, and finance teams to make data-driven decisions without writing a single formula. Purchase the SaaS Financial Model Dashboard in Excel today and transform your SaaS financial data into actionable insights.
For step-by-step video tutorials on how to use this dashboard and more Excel templates, visit our YouTube channel:
👉 Youtube.com/@PK-AnExcelExpert