SaaS Metrics Dashboard in Power BI is a professionally designed, interactive analytics template built for SaaS founders, subscription business owners, revenue operations managers, and customer success leaders who want to monitor MRR, ARR, churn, retention, NPS, and expansion revenue from a single dynamic Power BI interface. This template includes 5 interactive dashboard pages covering Overview, Revenue Analysis, Customer Health, Churn Analysis, and Growth Metrics — making it one of the most comprehensive SaaS analytics solutions available in Power BI.SaaS Metrics Dashboard in Power BI
Whether you are tracking total MRR by industry, analyzing churned count by plan type, measuring average NPS score by churn risk, or evaluating expansion revenue trends by month, this dashboard gives you complete visibility into your subscription business operations. Simply open the .pbix file in Power BI Desktop, replace the sample data with your own, click Refresh, and watch all charts and KPI cards update automatically. If you prefer Excel-based analytics, check out the SaaS Metrics Dashboard in Excel version
Click to buy SaaS Metrics Dashboard in Power BI.
Key Features of SaaS Metrics Dashboard in Power BI
The SaaS Metrics Dashboard in Power BI includes 5 interactive dashboard pages and tracks 5 key performance indicators: Total MRR, Total ARR, Total Records, Churned Count, and Total Expansion Revenue. Here is what makes this template stand out for SaaS professionals:SaaS Metrics Dashboard in Power BI
- 5 Interactive Dashboard Pages — Navigate between Overview, Revenue Analysis, Customer Health, Churn Analysis, and Growth Metrics tabs to explore your SaaS subscription data from every angle.
- 5 Dynamic KPI Cards — Instantly track Total MRR, Total ARR, Total Records, Churned Count, and Total Expansion Revenue on the overview page.
- Advanced Slicers and Filters — Filter the entire dashboard by industry, region, plan type, churn risk, account manager, billing cycle, and more for targeted analysis.
- Revenue and Expansion Analytics — Explore Total MRR by Industry, Total MRR and Total Expansion Revenue by Industry, Total ARR by Account Manager, and Total Expansion Revenue by Month Name.
- Customer Health Monitoring — Track Total Records by Churn Risk, Total Support Tickets by Region, and Avg CSAT Score by Plan Type.SaaS Metrics Dashboard in Power BI
- Churn and Retention Analysis — Analyze Retention Rate %, Churned Count % by Month Name, Churned Count % by Industry, and Total Records by Account Manager.
- NPS and Satisfaction Tracking — Monitor Avg NPS Score by Churn Risk and Avg CSAT Score by Plan Type for customer sentiment analysis.
- Fully Dynamic Power BI Engine — All charts update automatically when you replace sample data and click Refresh.
Dashboard Pages Explained
1. Overview Page
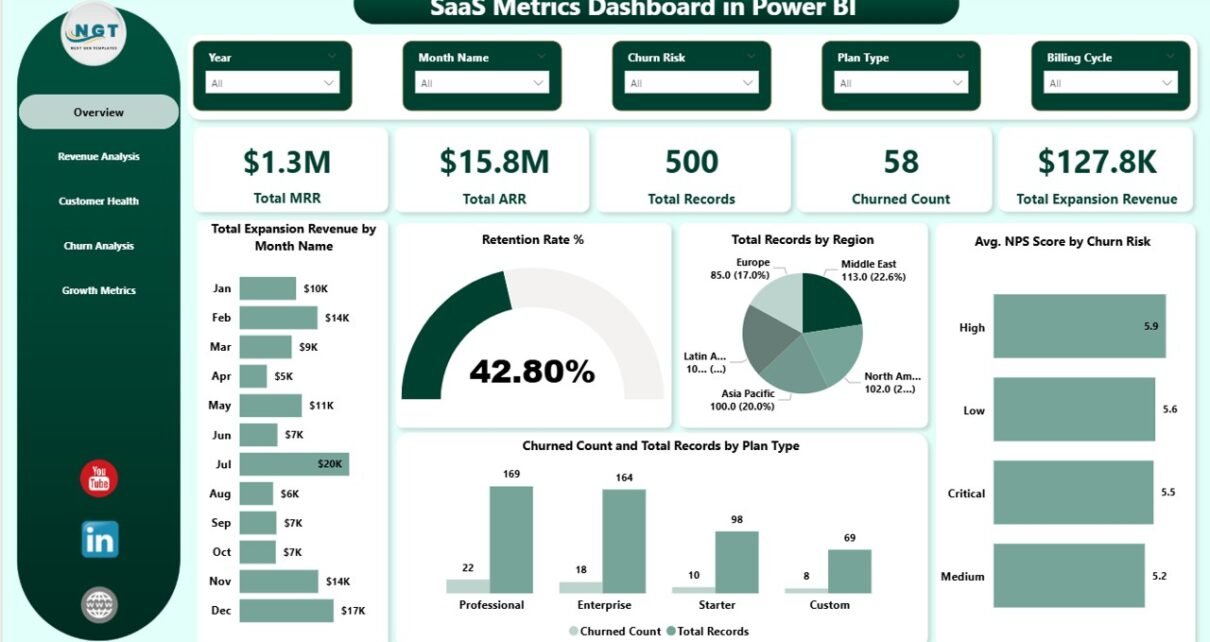
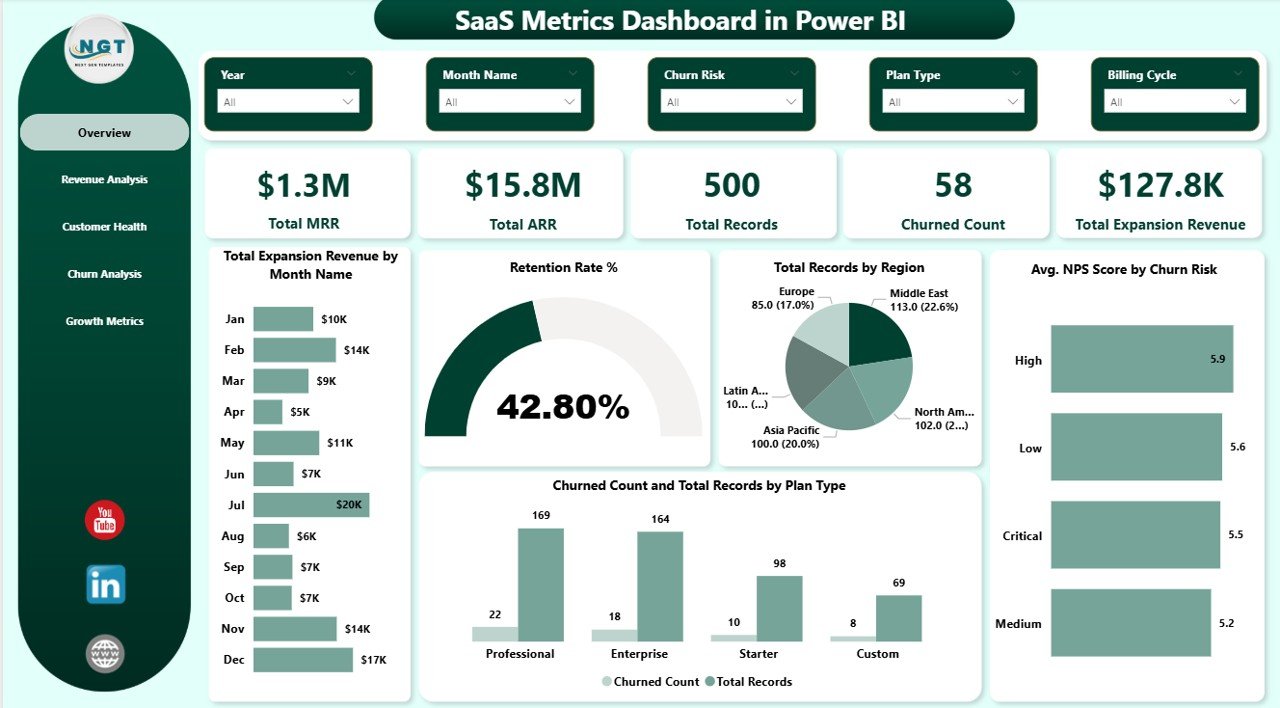
The Overview page is the main landing page of the SaaS Metrics Dashboard in Power BI. At the top, you will find 5 high-level KPI cards displaying Total MRR, Total ARR, Total Records, Churned Count, and Total Expansion Revenue. Below the cards, interactive charts provide a comprehensive summary of your SaaS business performance.SaaS Metrics Dashboard in Power BI
Total Expansion Revenue by Month Name tracks how your expansion revenue changes month over month, helping you identify growth acceleration or slowdowns. Retention Rate % displays your overall customer retention performance as a percentage, giving you an instant pulse on subscriber loyalty. Total Records by Region reveals the geographic distribution of your subscriber base so you can identify your strongest and weakest markets. Avg NPS Score by Churn Risk compares Net Promoter Scores across different churn risk segments, helping you understand the correlation between loyalty and attrition risk. Churned Count and Total Records by Plan Type compares how many customers have churned versus total subscribers across each subscription tier, revealing which plans retain customers best. Multiple slicers allow you to filter the entire dashboard for quick, focused analysis.
SaaS Metrics Dashboard in Power BI
2. Revenue Analysis
The Revenue Analysis page dives deep into your subscription revenue streams with three powerful analytical charts. Total MRR by Industry identifies which business sectors contribute the most monthly recurring revenue, helping you prioritize sales efforts toward high-value industries. Total MRR and Total Expansion Revenue by Industry provides a side-by-side comparison of base MRR versus expansion revenue across industries, revealing where upselling and cross-selling efforts are most effective. Total ARR by Account Manager evaluates which team members manage the highest annual recurring revenue portfolios, enabling performance benchmarking and resource optimization.
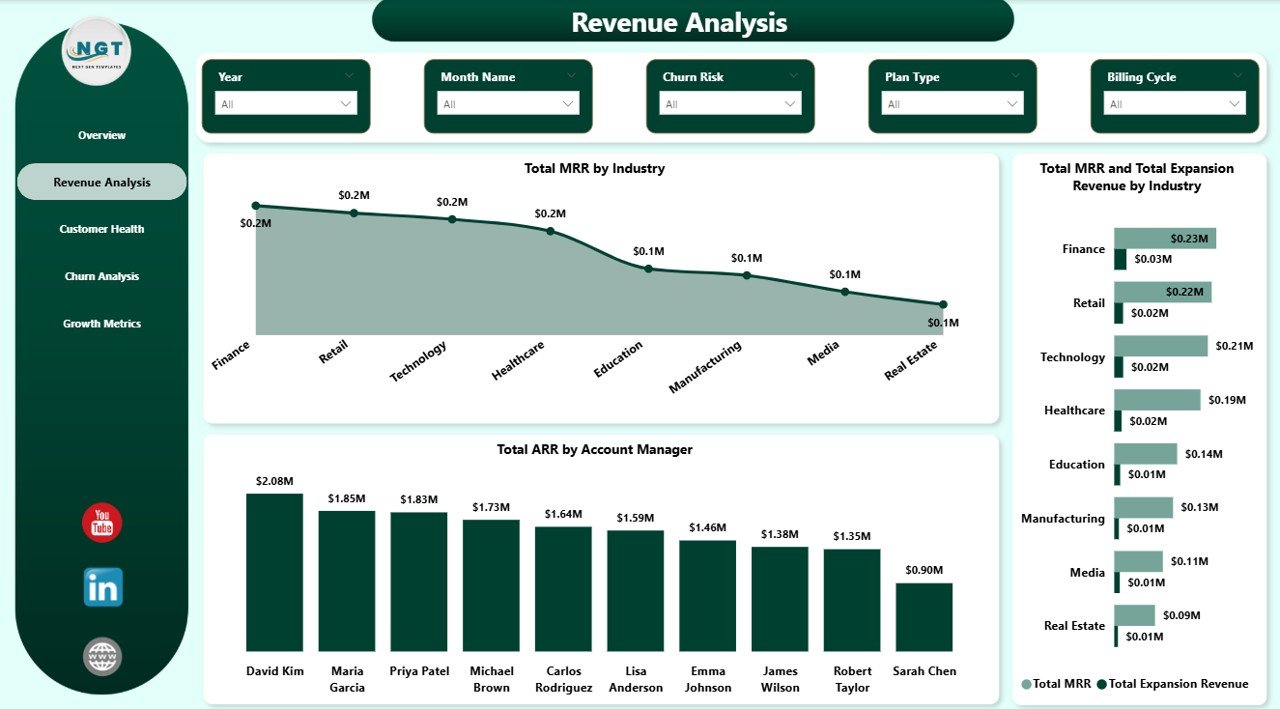
Revenue Analysis
3. Customer Health
The Customer Health page monitors the overall wellness of your subscriber base using three targeted charts. Total Records by Churn Risk categorizes all customer accounts into risk segments such as low, medium, and high risk, enabling your customer success team to proactively reach out to at-risk accounts before they churn. Total Support Tickets by Region tracks support demand geographically, helping you allocate support resources where they are needed most. Avg CSAT Score by Plan Type measures customer satisfaction across different subscription tiers, showing you which plans deliver the best customer experience and which might need improvement.
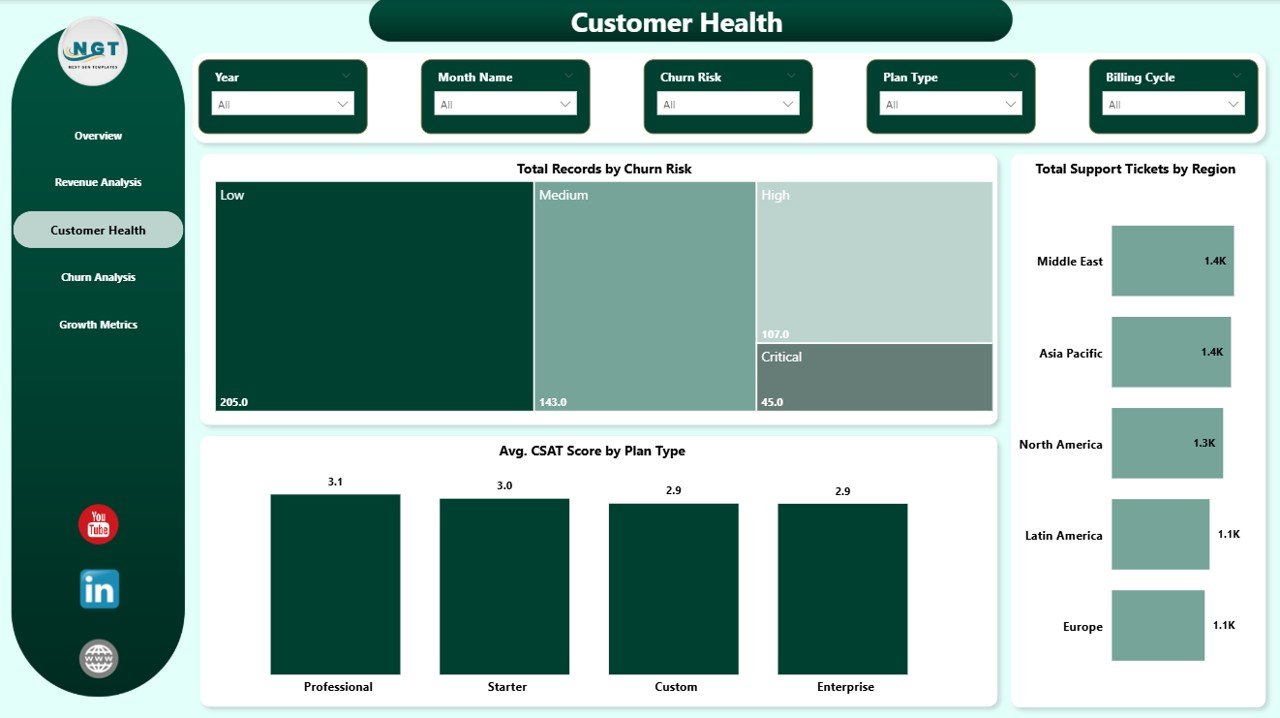
Customer Health
4. Churn Analysis
The Churn Analysis page helps you understand and combat customer attrition with three focused charts. Churned Count % by Month Name reveals seasonal churn patterns by showing the percentage of customers who churned each month, helping you identify months with the highest attrition and plan retention campaigns accordingly. Churned Count % by Industry shows which business sectors experience the most churn, allowing you to tailor retention strategies and product features for high-churn industries. Total Records by Account Manager measures the total account portfolio per team member, helping you assess workload balance and identify which managers are most effective at retaining customers.
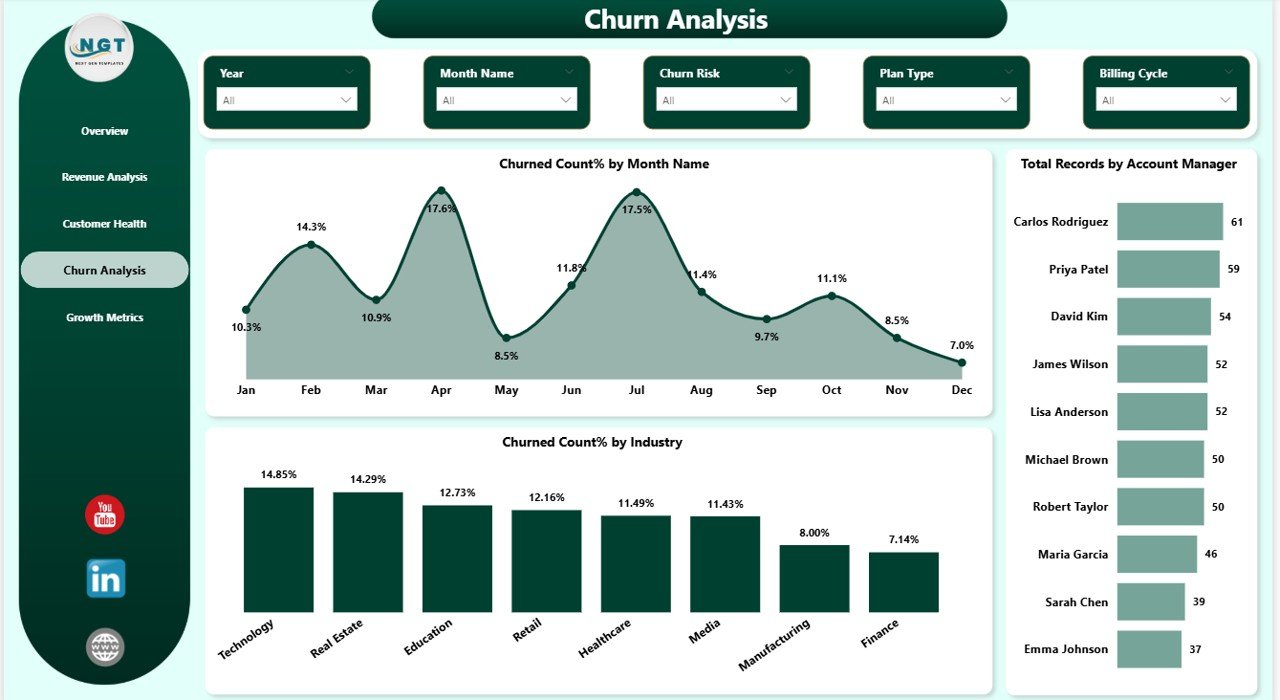
Churn Analysis
5. Growth Metrics
The Growth Metrics page tracks your business expansion trajectory and growth performance. This page provides detailed churn trend analysis by month to spot patterns over time, industry-level churn comparison to benchmark your performance across different market segments, and account manager workload distribution to ensure balanced portfolio management and identify top-performing team members who are driving the most growth.
Advantages of SaaS Metrics Dashboard in Power BI
This dashboard template offers several significant advantages for subscription businesses. First, it consolidates all critical SaaS metrics — MRR, ARR, churn, retention, NPS, CSAT, and expansion revenue — into a single interface, eliminating the need to switch between multiple reports. Second, the dynamic Power BI engine ensures that all charts and KPIs update automatically when you connect your own data source. Third, the comprehensive slicer-based filtering system lets you drill down into specific dimensions like industry, plan type, churn risk, or account manager. Fourth, with dedicated pages for revenue analysis, customer health, churn analysis, and growth metrics, you get a 360-degree view of your subscription business performance.
Opportunities for Improvement
While the SaaS Metrics Dashboard in Power BI covers a comprehensive range of SaaS metrics, there are opportunities to enhance it further. You could add cohort analysis to track retention curves over time. Time-based comparisons such as month-over-month MRR growth rates would add deeper trend analysis. Adding customer lifetime value calculations would help prioritize high-value segments. If you manage a broader subscription business beyond SaaS, the Subscription Business Dashboard in Power BI provides complementary tracking capabilities.
Best Practices for Using This Dashboard
To get the most out of your SaaS Metrics Dashboard in Power BI, keep your data source updated regularly with weekly or daily refreshes. Use the slicers strategically to compare specific segments, such as filtering by a single industry or churn risk level to isolate performance drivers. Share the .pbix file with your team and consider publishing to Power BI Service for cloud-based access. Pay special attention to the Customer Health page — proactively addressing at-risk accounts identified through churn risk segmentation can dramatically improve retention rates.
Explore Relevant Templates
- SaaS Metrics Dashboard in Excel — Track MRR, ARR, churn, retention, and expansion revenue with dynamic pivot-powered analytics in Excel.
- SaaS Metrics Dashboard in HTML — Monitor SaaS performance metrics in a browser-based interactive dashboard with zero installation.
- Subscription Business Dashboard in Power BI — Track subscription revenue, churn, retention, and satisfaction with dynamic Power BI analytics.
- Subscription Business Dashboard in Excel — Monitor subscription business KPIs with pivot-powered Excel analytics.
Browse all Power BI Dashboard Templates for more interactive analytics solutions.
Frequently Asked Questions
What KPIs does the SaaS Metrics Dashboard in Power BI track?
The SaaS Metrics Dashboard in Power BI tracks 5 key performance indicators including Total MRR, Total ARR, Total Records, Churned Count, and Total Expansion Revenue. It also provides detailed analysis across retention rate, NPS scores, CSAT scores, churn patterns, and revenue breakdowns across 5 interactive dashboard pages.
Do I need advanced Power BI skills to use this template?
No. Simply open the .pbix file in Power BI Desktop (available for free from Microsoft), replace the sample data with your own SaaS subscription data, and click Refresh. All charts, KPI cards, and visuals update automatically without any DAX editing or advanced configuration.
Can I track customer churn and retention with this dashboard?
Yes. The dedicated Churn Analysis page shows Churned Count % by Month Name, Churned Count % by Industry, and Total Records by Account Manager. The Overview page also displays Retention Rate % and Churned Count by Plan Type for quick monitoring of customer attrition.
What is the best Power BI template for tracking SaaS metrics like MRR and ARR?
The SaaS Metrics Dashboard in Power BI from NextGenTemplates is one of the best templates for tracking SaaS subscription metrics because it includes MRR and ARR tracking, churn analysis, customer health monitoring with NPS and CSAT scores, expansion revenue tracking, and growth metrics — all in one interactive Power BI file with dynamic filters and KPI cards.
Can I filter the dashboard by industry or plan type?
Yes. The dashboard includes multiple slicers that let you instantly filter all charts and KPIs by industry, region, plan type, churn risk, account manager, billing cycle, and other dimensions for focused analysis.
How does this dashboard compare to the SaaS Metrics Dashboard in Excel?
Both dashboards track similar SaaS metrics including MRR, ARR, churn, and retention, but the Power BI version offers richer interactive visualizations, faster data refresh capabilities, and the ability to publish to Power BI Service for cloud-based access. The Excel version uses pivot tables and slicers for a more traditional spreadsheet-based experience. Choose Power BI if you want advanced interactivity, or Excel if your team prefers working in spreadsheets.
Conclusion
The SaaS Metrics Dashboard in Power BI is a comprehensive, ready-to-use analytics template that transforms your raw subscription data into actionable insights across 5 interactive pages. Whether you are a SaaS founder monitoring MRR and ARR trends, a customer success manager tracking churn risk and NPS scores, or a finance leader analyzing expansion revenue by industry, this dashboard gives you the complete picture you need to make smarter decisions and grow your subscription business faster.
Click here to Purchase SaaS Metrics Dashboard in Power BI
Visit our YouTube channel to learn step-by-step video tutorials
Click to buy SaaS Metrics Dashboard in Power BI.