In today’s highly competitive market, data drives success. Sales leaders, business analysts, and executives rely heavily on data insights to make informed decisions. But raw data alone won’t get the job done—you need tools to transform it into meaningful stories.
This is where the Sales Business Intelligence Dashboard in Power BI shines.
With real-time metrics, intuitive visuals, and drill-through analytics, a Sales BI Dashboard in Power BI helps you unlock powerful insights into sales performance, regional trends, and product category success—all in one place.
In this article, you’ll discover everything you need to know about building and using a Power BI dashboard to supercharge your sales strategy.
Click to Purchases Sales Business Intelligence Dashboard in Power BI
What is a Sales Business Intelligence Dashboard in Power BI?
A Sales Business Intelligence (BI) Dashboard in Power BI is a dynamic and interactive reporting tool that allows businesses to monitor and analyze their sales performance using real-time visuals, slicers, and KPIs. It is built using Power BI Desktop and is often powered by data from sources such as Excel, SQL databases, or CRM platforms.
Unlike static Excel reports, this dashboard brings your data to life with interactive charts, filters, and insights across multiple pages.
It’s ideal for:
-
Sales Managers
-
Business Analysts
-
Regional Managers
-
Product Heads
-
Executives
With this dashboard, you can easily track performance by region, product category, sales representative, and monthly trends, making it an essential tool for any sales-driven organization.
Key Pages in the Sales BI Dashboard
This ready-to-use Power BI dashboard consists of five main pages, each offering a different perspective on your sales data. Let’s explore each one in detail.
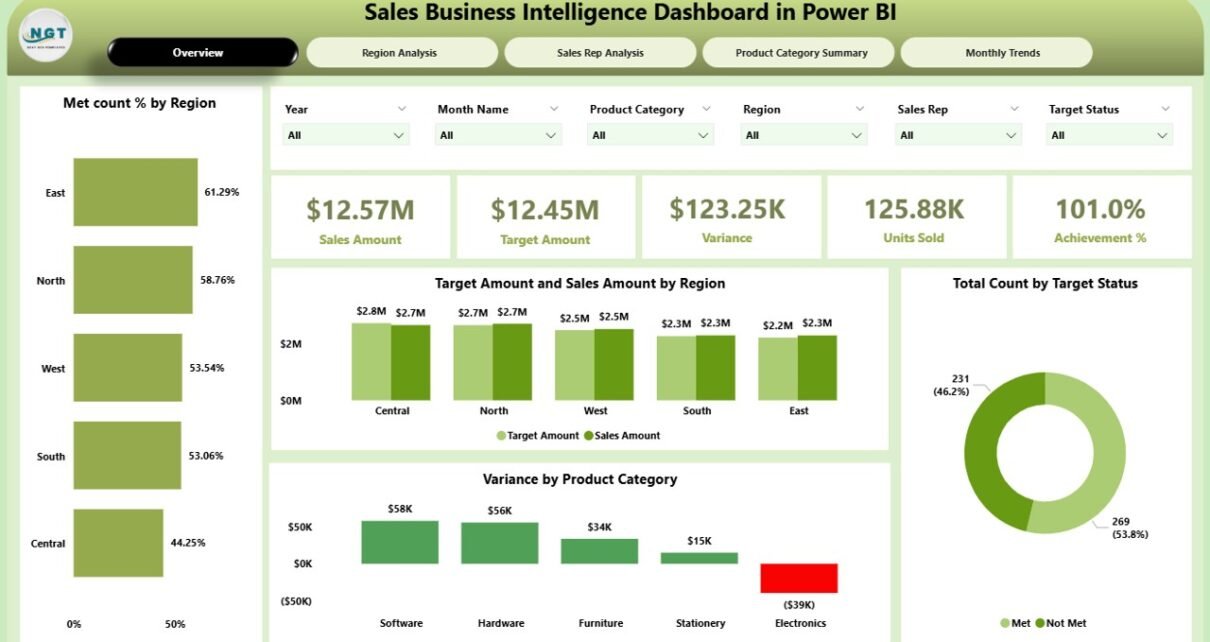
Overview Page: Snapshot of Total Performance
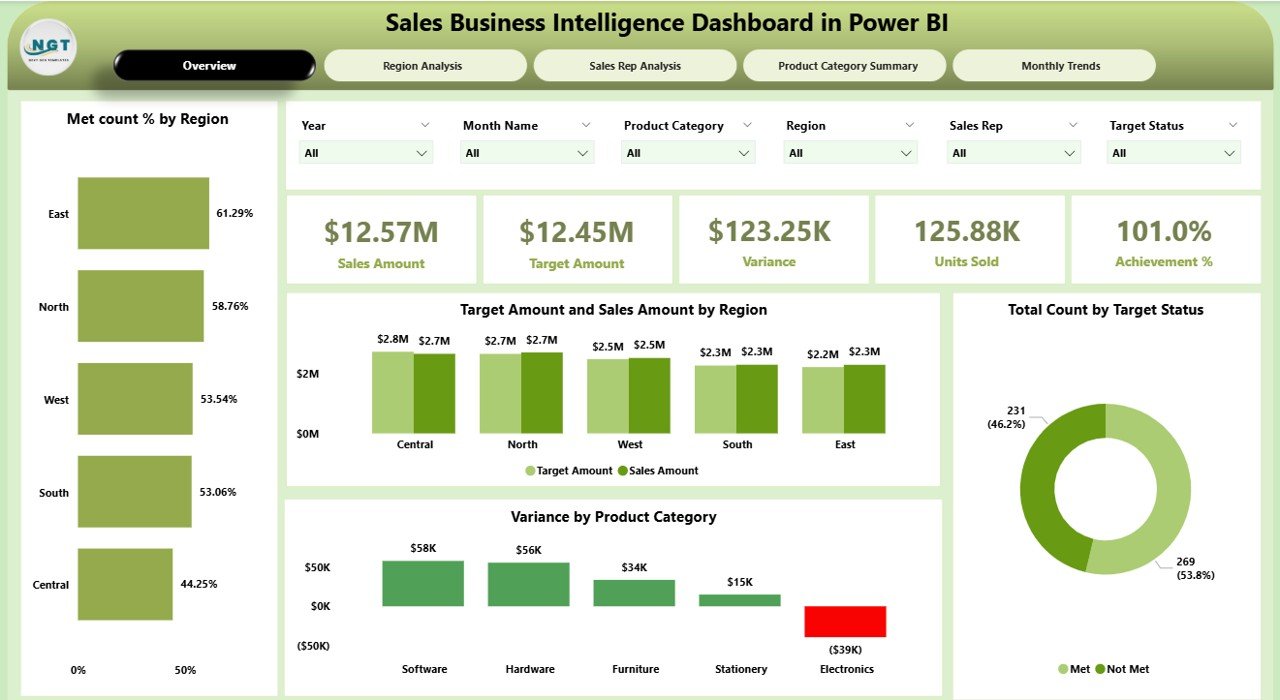
The Overview Page serves as the control center of your sales intelligence. It contains:
-
6 Slicers to filter data by region, product, time, sales rep, and more.
5 Summary Cards that show key KPIs such as:
- Total Sales
- Target Sales
- Variance
- Sales Achievement %
- Met Count %
4 Interactive Charts:
-
Met Count % by Region
-
Target vs. Sales Amount by Region
-
Total Count by Target Status
-
Variance by Product Category
This page helps executives get a bird’s-eye view of overall sales performance in seconds.
Region Analysis: Zoom in on Geographical Performance
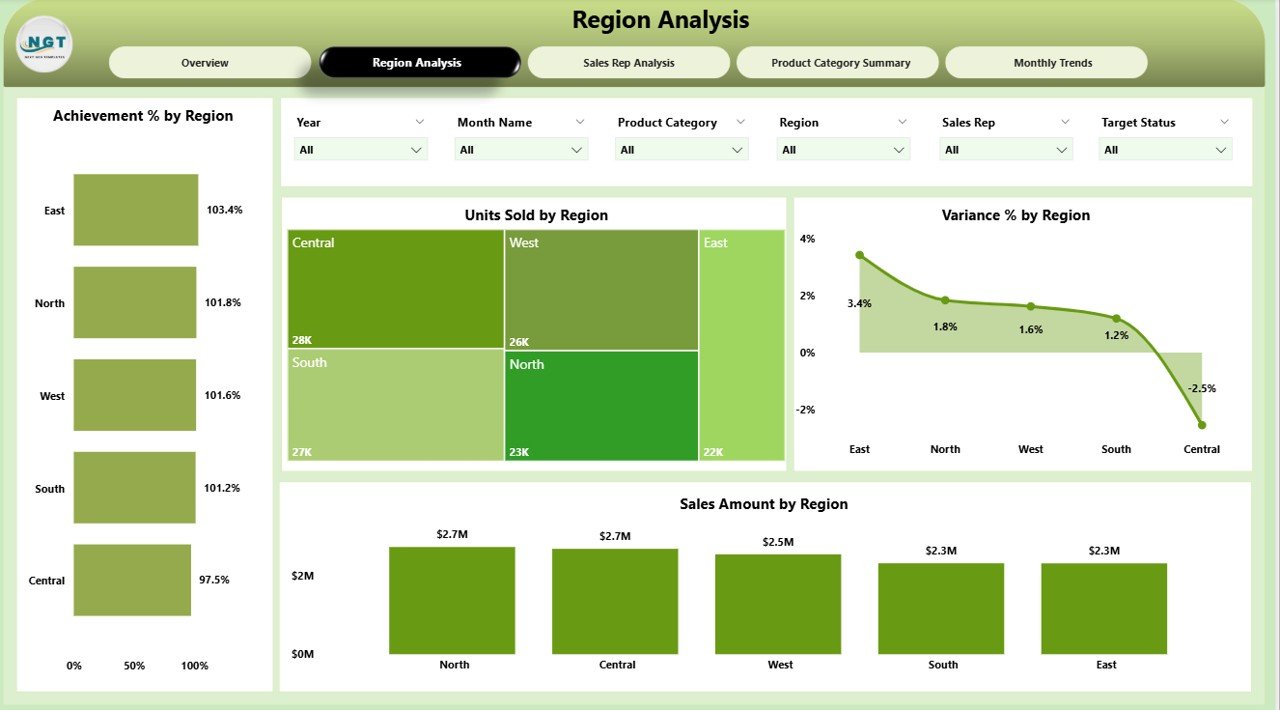
The Region Analysis Page helps you break down sales performance by region.
It features:
-
6 Filters/Slicers for region-specific insights.
4 Charts:
- Achievement % by Region
- Units Sold by Region
- Variance % by Region
- Sales Amount by Region
Use this page to identify high-performing or underperforming regions, plan resources better, and set region-wise targets with confidence.
Sales Rep Analysis: Performance by Salesperson
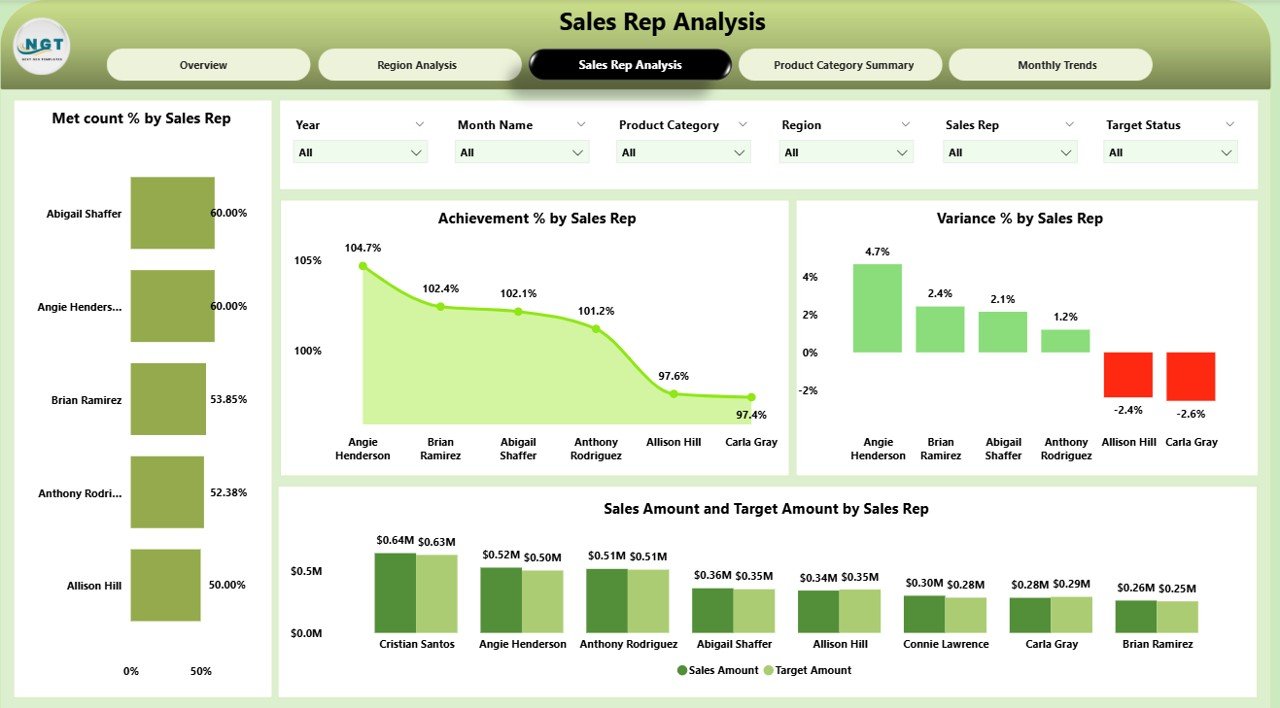
Your sales team drives your revenue. This page focuses on individual performance.
Included:
Click to Purchases Sales Business Intelligence Dashboard in Power BI
-
6 Slicers to customize views per rep, product, or month.
4 Powerful Charts:
- Met Count % by Sales Rep
- Achievement % by Sales Rep
- Variance % by Sales Rep
- Target vs. Sales Amount by Sales Rep
This page helps you evaluate rep-wise performance, motivate your team with transparent metrics, and find coaching opportunities.
Product Category Summary: Analyze Your Product Lines
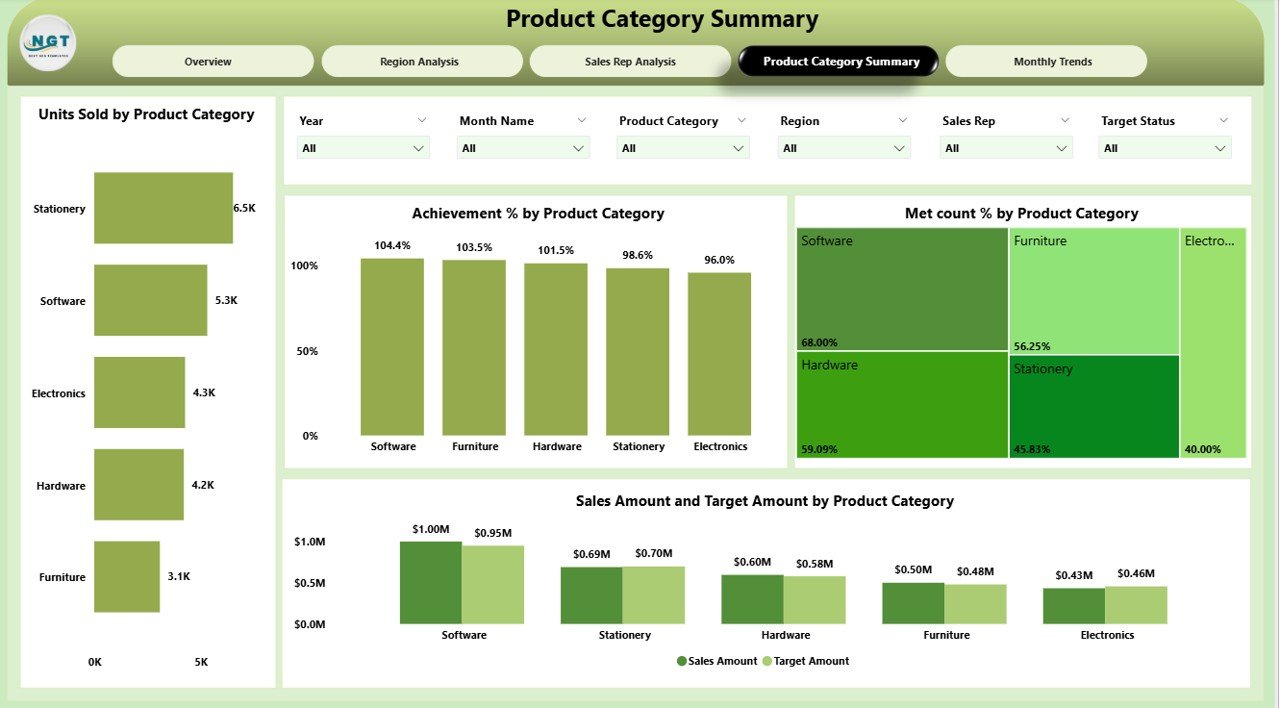
This page breaks down performance by product categories.
Key Features:
-
6 Slicers to drill down by category, sub-category, or month.
4 Charts:
- Units Sold by Product Category
- Achievement % by Product Category
- Met Count % by Product Category
- Target vs. Sales Amount by Product Category
It’s a great tool to optimize inventory, understand product success, and plan future launches.
Monthly Trends: Track Sales Over Time
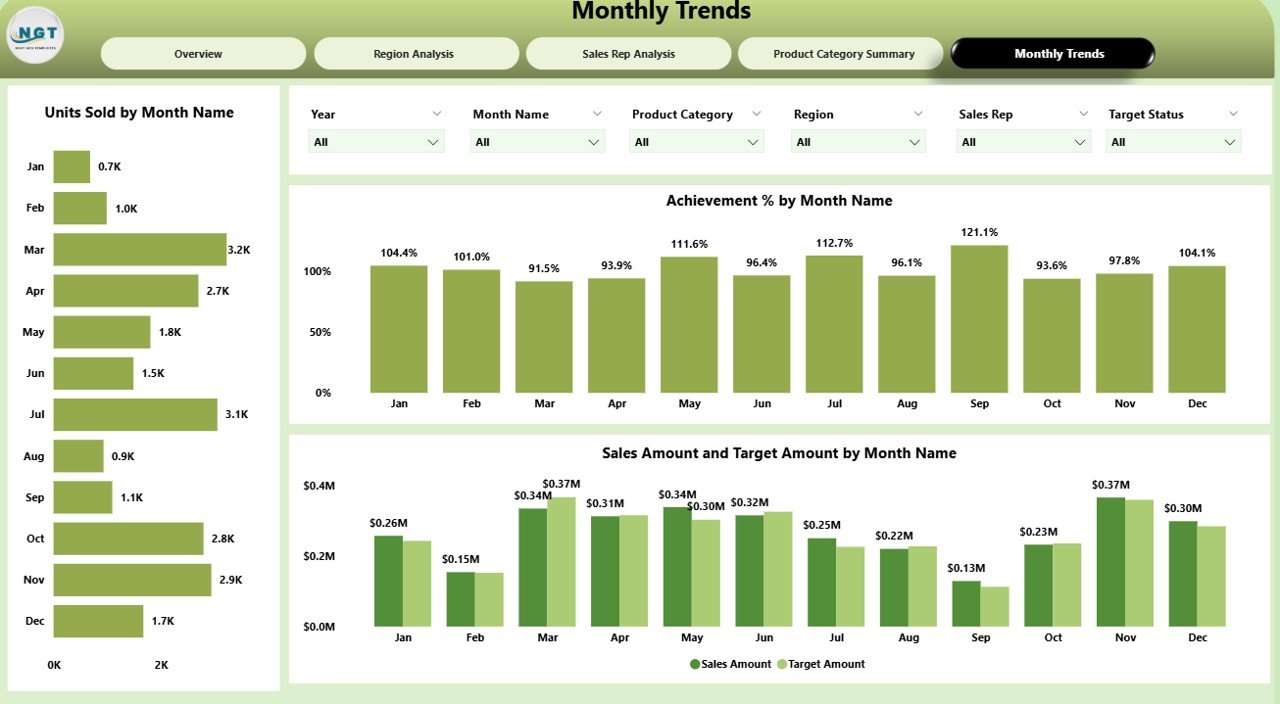
Time-based trends help you prepare for seasonality and plan ahead.
This page includes:
-
6 Time-related Filters
Charts:
- Units Sold by Month
- Achievement % by Month
- Sales Amount vs. Target Amount by Month
With this page, you can spot monthly fluctuations, plan promotions, and forecast sales with higher accuracy.
Advantages of Using a Sales Business Intelligence Dashboard in Power BI
Implementing a Power BI sales dashboard offers several benefits for teams and decision-makers:
✅ Real-Time Visibility
-
View up-to-date performance data at a glance.
-
Make faster and smarter decisions.
✅ Centralized Reporting
-
Replace scattered spreadsheets with a single source of truth.
-
Access all KPIs in one dashboard.
✅ Enhanced Collaboration
-
Share interactive reports with your sales and executive teams.
-
Align goals across departments.
✅ Drill-Down Capabilities
-
Analyze performance at different levels: region, sales rep, product, and time.
-
Use filters to customize insights.
✅ Better Forecasting
-
Identify trends and prepare for future demand.
-
Improve planning and budgeting accuracy.
Best Practices for the Sales BI Dashboard in Power BI
To make the most of your dashboard, follow these best practices:
1. Keep It Simple
-
Avoid clutter. Only show KPIs that matter.
-
Use intuitive layouts with easy-to-read visuals.
2. Use Consistent Metrics
-
Define your KPIs clearly (e.g., Achievement %, Variance).
-
Maintain consistency across pages.
3. Update Data Regularly
-
Ensure the data source (e.g., Excel) is updated periodically.
-
Schedule automatic refreshes if needed.
4. Incorporate Feedback
-
Gather input from sales teams.
-
Adapt the dashboard to changing needs.
5. Enable Drill-Through
-
Add detail pages for deep analysis.
-
Allow users to click and explore granular data.
Opportunities for Improvement
While the dashboard is powerful, here are some ways to enhance it further:
-
Add Forecasting Models using DAX or Power BI Forecasting visuals.
-
Integrate CRM Data (like Salesforce or HubSpot) for richer insights.
-
Set Alerts for KPI thresholds.
-
Embed it in Microsoft Teams or SharePoint for wider access.
-
Create Mobile Views for on-the-go analytics.
Use Cases: Who Can Benefit?
This dashboard is perfect for:
Sales Managers:
-
Monitor team performance
-
Spot achievement gaps
Business Analysts:
-
Explore trends
-
Generate insights for strategy
Executives:
-
Review overall sales health
-
Make strategic investment decisions
Product Managers:
-
Track category sales
-
Evaluate success of new launches
How Is the Dashboard Built?
This dashboard is created using:
-
Power BI Desktop: For design and visualization
-
Excel File: As the data source (easy to maintain)
-
DAX Functions: For calculated columns and KPIs
-
Slicers: For interactivity across pages
-
Card Visuals & Charts: For key metrics and trends
This setup ensures you get the power of BI without the complexity of custom-built systems.
Conclusion
A Sales Business Intelligence Dashboard in Power BI is more than a reporting tool—it’s your sales command center.
With this dashboard, you can:
-
Track performance instantly
-
Drive team accountability
-
Identify winning regions or products
-
Make confident, data-driven decisions
If you’re still relying on traditional reports, it’s time to level up. Power BI gives you the flexibility, speed, and visual clarity to turn your sales data into business growth.
Frequently Asked Questions (FAQs)
1. What is a Sales Business Intelligence Dashboard?
A Sales BI Dashboard is a tool that visualizes key sales metrics such as revenue, targets, variance, and performance by different dimensions like region or product. It helps you understand trends and make better decisions.
2. Why use Power BI for Sales Dashboards?
Power BI offers interactivity, real-time updates, and beautiful visuals. It’s easy to connect with Excel or other data sources and gives you the power to analyze data in-depth.
3. How often should I update my dashboard data?
Ideally, update the data daily or weekly depending on your sales cycle. Power BI can also automate refreshes if your data is in the cloud.
4. Can non-technical users use this dashboard?
Yes, once built, the dashboard is highly user-friendly. Users can apply filters, explore charts, and read cards without needing technical skills.
5. Can I customize the dashboard?
Absolutely. You can add or remove KPIs, create new visuals, or modify filters based on your unique business needs.
6. Is Excel the only data source for this dashboard?
Not at all. While this dashboard uses Excel, Power BI supports various sources like SQL, SharePoint, Salesforce, Google Analytics, and more.
7. How do I share the dashboard with others?
You can publish the dashboard to Power BI Service and share links, embed it in Microsoft Teams, or export it as a PDF or PowerPoint.
Visit our YouTube channel to learn step-by-step video tutorials