In today’s competitive business world, sales teams must make fast and smart decisions. However, many companies still rely on spreadsheets and manual reports. As a result, leaders struggle to track revenue, discounts, margins, and performance trends clearly.So, how can you gain complete visibility into your sales performance?You need a Sales Dashboard in Power BI.A well-designed sales dashboard transforms raw sales data into interactive insights. Moreover, it helps you monitor Gross Sales, Net Sales, Profit Margin, Discount Impact, Shipping Cost, and Regional Performance in one centralized report. Therefore, you can identify opportunities quickly and improve profitability.
In this detailed guide, you will learn:
- What a Sales Dashboard in Power BI is
- Why every business needs it
- Detailed explanation of all 5 dashboard pages
- Advantages of Sales Dashboard in Power BI
- Best practices for implementation
- Frequently Asked Questions with Answers
Click to buy Sales Dashboard in Power BI
What Is a Sales Dashboard in Power BI?
A Sales Dashboard in Power BI is an interactive reporting solution built using Microsoft Power BI Desktop. It connects with sales data and converts numbers into meaningful visuals.
Instead of reviewing long Excel files, you can:
- Track Gross Sales and Net Sales instantly
- Compare Discount Amount across industries
- Monitor Profit Margin % by region and product
- Analyze Shipping Cost % trends
- Identify top-performing customers and categories
Because Power BI supports slicers, drill-downs, and dynamic visuals, you can filter data by month, region, product, or customer type within seconds.
As a result, decision-making becomes faster and more accurate.
Why Do Businesses Need a Sales Dashboard in Power BI?
Sales data grows every day. Meanwhile, competition increases rapidly. Therefore, companies must analyze performance continuously.
Without a dashboard:
- Managers depend on static reports
- Teams miss early warning signs
- Profit leakage goes unnoticed
- Discount impact remains unclear
However, when you use a Sales Dashboard in Power BI:
- You gain real-time visibility
- You track KPIs clearly
- You reduce reporting time
- You improve sales strategy
In short, you move from reactive decisions to proactive growth.
Key Features of the Sales Dashboard in Power BI
This Sales Dashboard contains 5 powerful pages in the Power BI Desktop application. Each page focuses on a different area of sales performance.
Let us understand each page in detail.
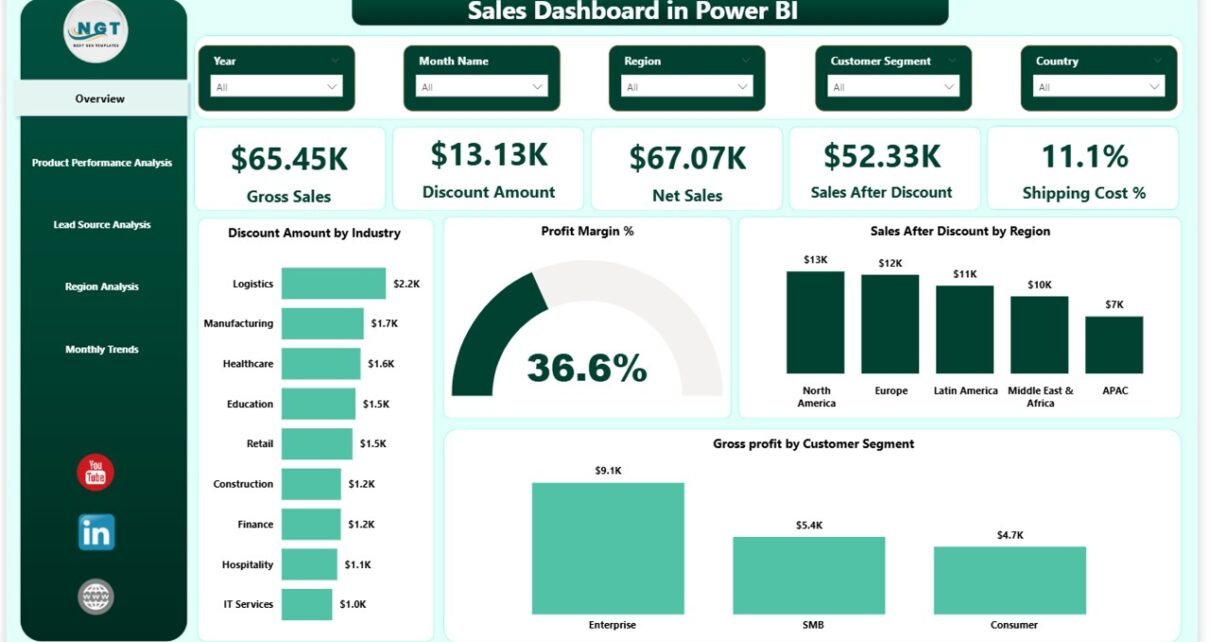
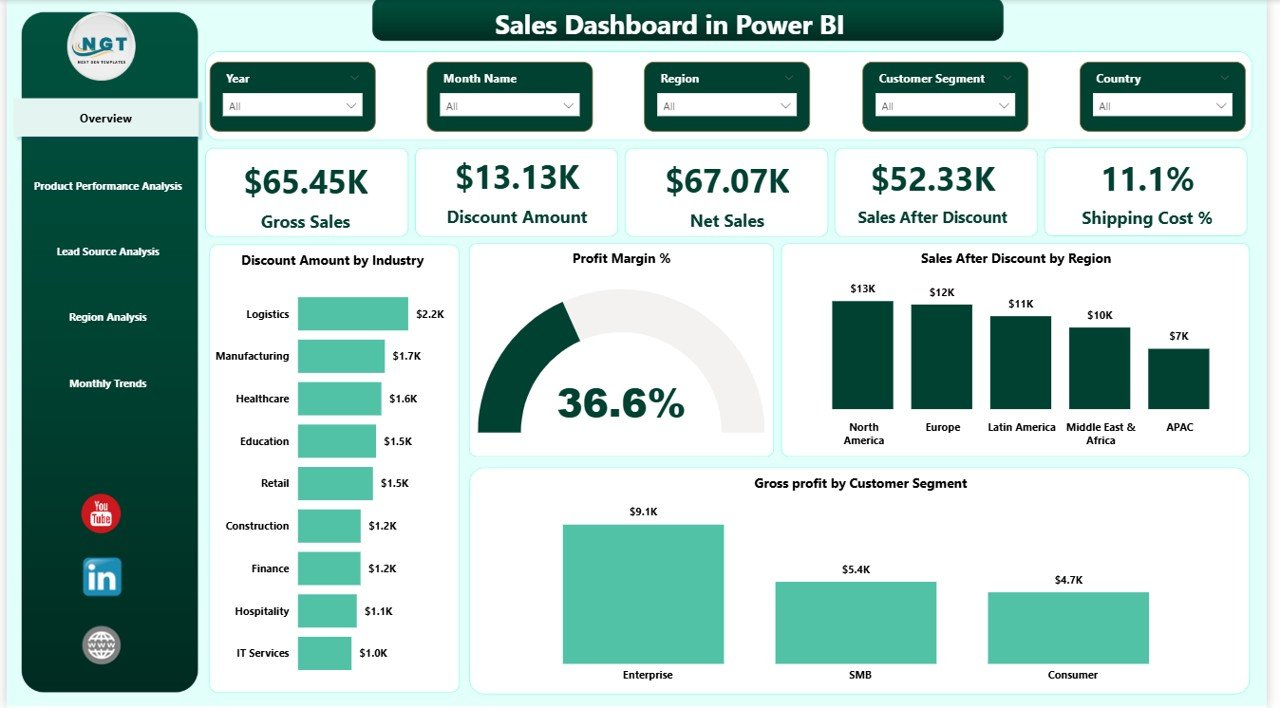
Overview Page – How Can You See Complete Sales Performance in One View?
The Overview Page acts as the main control panel of the dashboard. Here, you can see high-level KPIs and summaries instantly.
KPI Cards Available on Overview Page
- Gross Sales
- Discount Amount
- Net Sales
- Sales After Discount
- Shipping Cost %
These cards give you immediate performance insights. Therefore, you can understand revenue health at a glance.
Key Charts on Overview Page
- Discount Amount by Industry
- Profit Margin %
- Sales After Discount by Region
- Gross Profit by Customer
- Profit by Customer Type
Because this page includes slicers, you can filter data by Month, Region, Industry, or Product Category. As a result, you gain flexibility and control.
Moreover, when Gross Sales increase but Net Sales decrease, you can quickly identify discount impact. Therefore, you can adjust pricing strategy immediately.
Click to buy Sales Dashboard in Power BI
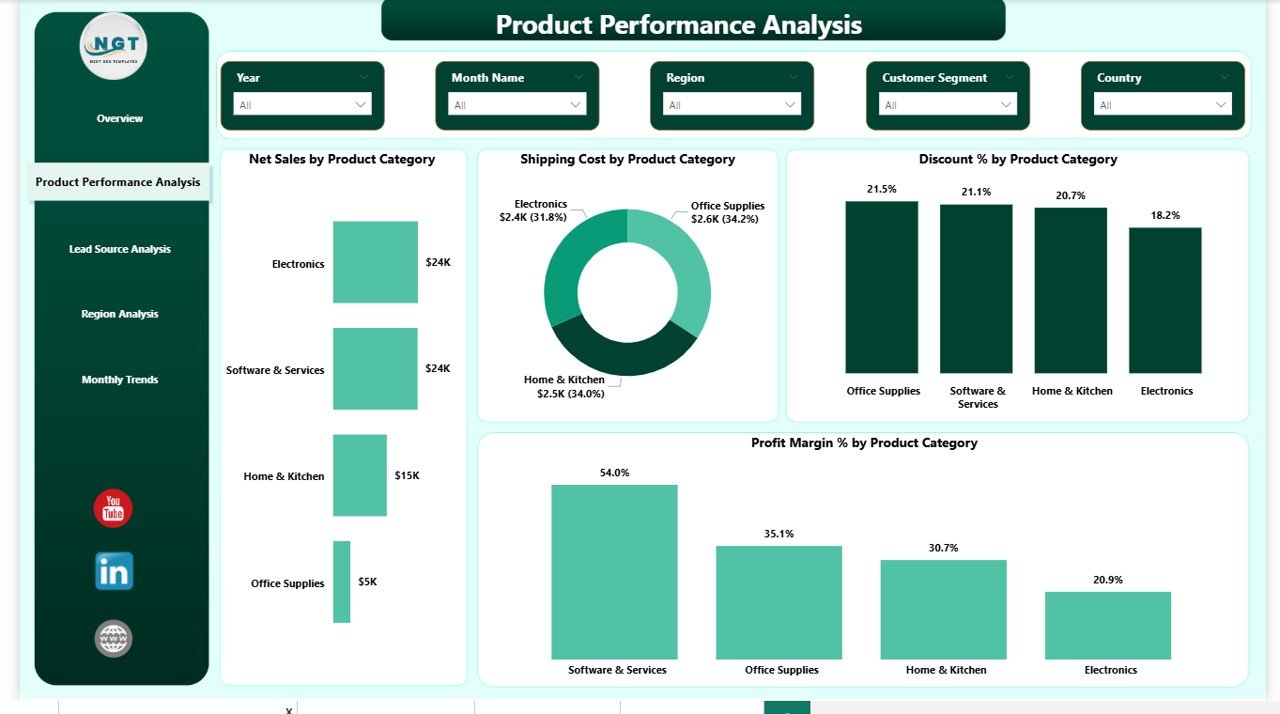
Product Performance Analysis – Which Products Drive Maximum Profit?
The second page focuses on Product Performance Analysis.
This page answers important questions like:
- Which product category generates the highest Net Sales?
- Which category has high Shipping Cost?
- Where do discounts reduce margins?
- Which products deliver strong Profit Margin %?
Charts Available
- Net Sales by Product Category
- Shipping Cost by Product Category
- Discount % by Product Category
- Profit Margin % by Product Category
Because product-level insights drive revenue growth, this page helps managers optimize product mix.
For example:
- If Shipping Cost is high for a category, you can negotiate logistics.
- If Discount % is excessive, you can revise promotional offers.
- If Profit Margin % is low, you can review cost structure.
Therefore, this page directly supports profitability improvement.
Click to buy Sales Dashboard in Power BI
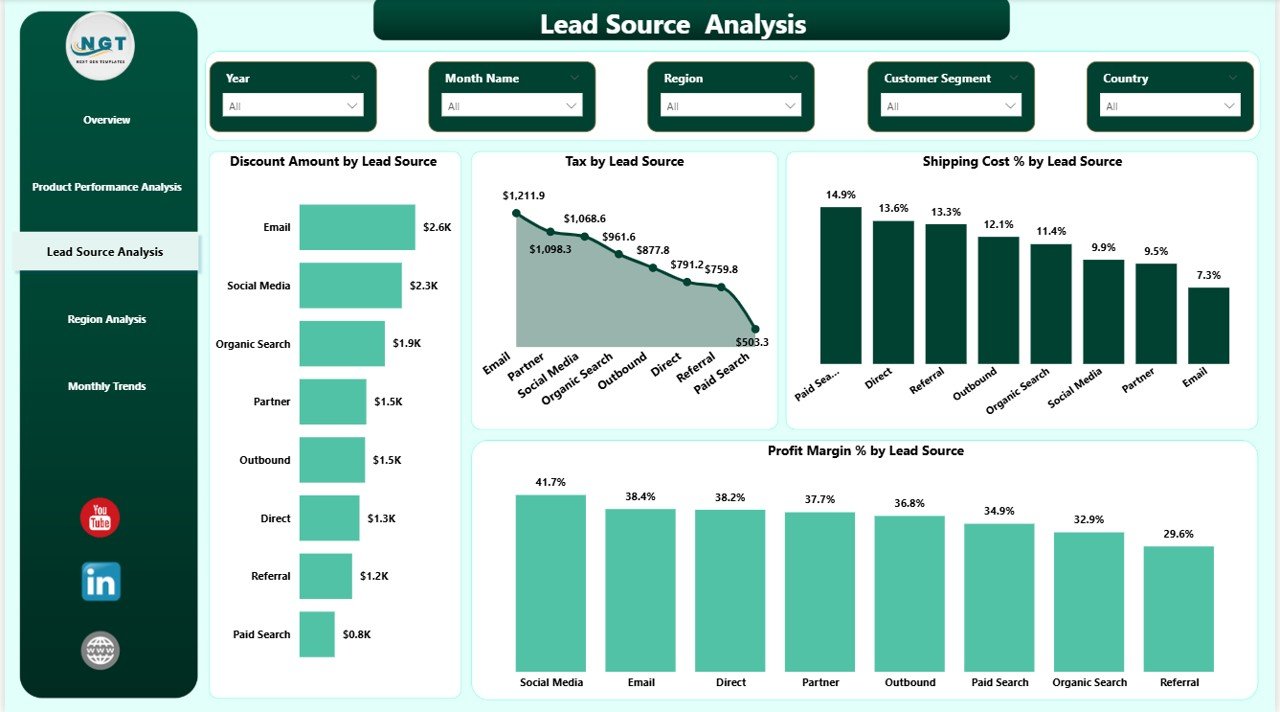
Lead Source Analysis – Which Marketing Channels Generate Profit?
Sales performance depends heavily on marketing channels. Therefore, you must evaluate lead sources carefully.
The Lead Source Analysis page provides complete visibility into lead-based performance.
Charts Available
- Discount Amount by Lead Source
- Tax by Lead Source
- Shipping Cost % by Lead Source
- Profit Margin % by Lead Source
This page helps you understand:
- Which channels generate profitable customers
- Which lead source requires heavy discounting
- Where marketing spend delivers strong returns
For example, if one channel generates high Gross Sales but low Profit Margin %, you must reassess marketing strategy.
Thus, you align sales and marketing effectively.
Click to buy Sales Dashboard in Power BI
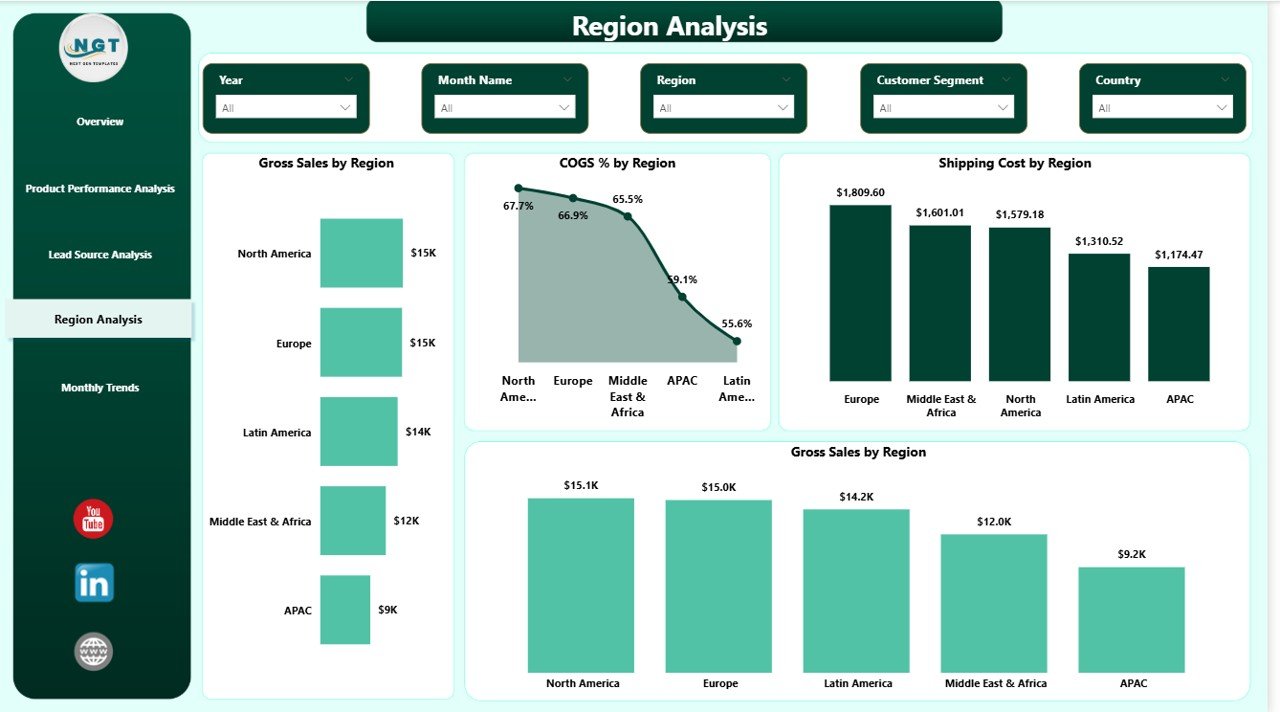
Region Analysis – Which Region Performs Best?
Geographical performance plays a major role in sales growth.
The Region Analysis Dashboard allows you to compare performance across regions.
Charts Available
- Gross Sales by Region
- COGS % by Region
- Shipping Cost by Region
- Gross Sales Comparison
Because regional comparison reveals hidden insights, you can identify:
- High-growth regions
- High-cost regions
- Regions with margin pressure
For instance, if COGS % is high in a specific region, you can review supply chain strategy.
Therefore, this page supports regional planning and expansion decisions.
Click to buy Sales Dashboard in Power BI
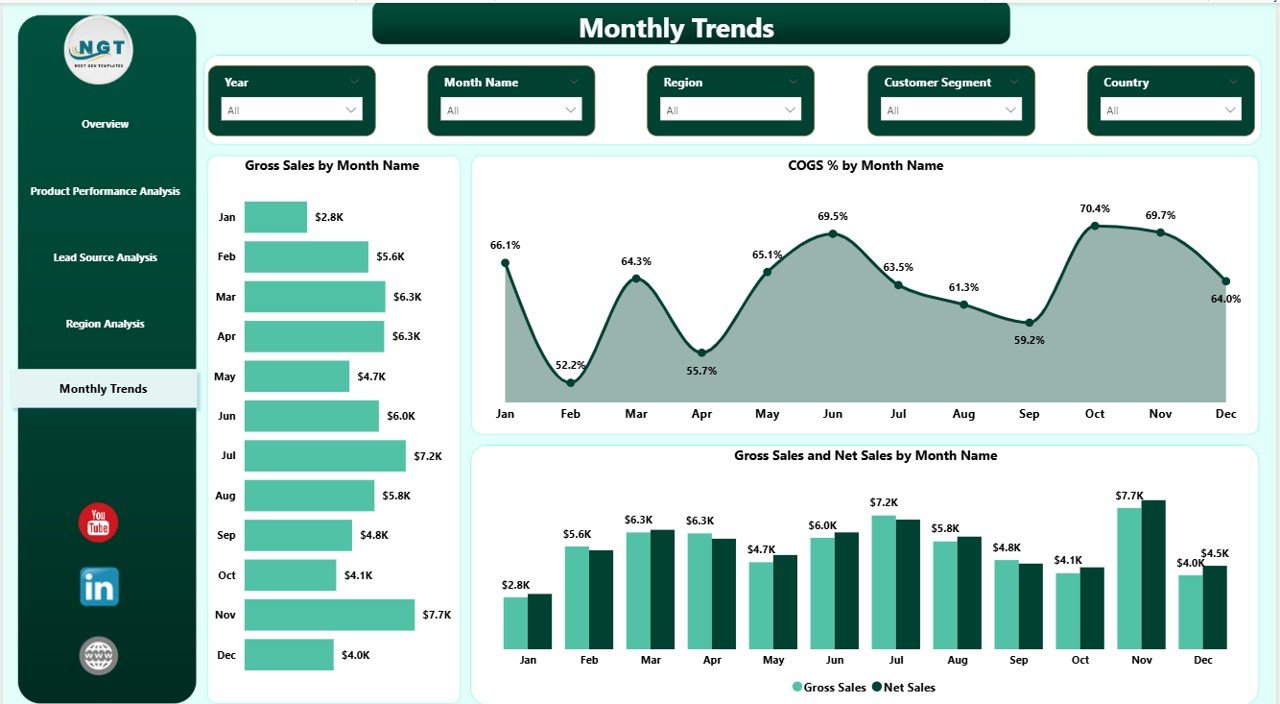
Monthly Trends – How Does Sales Performance Change Over Time?
The final page focuses on Monthly Trends.
Trend analysis helps businesses forecast performance and detect seasonal patterns.
Charts Available
- Gross Sales by Month Name
- COGS % by Month Name
- Gross Sales and Net Sales by Month Name
Because monthly analysis highlights growth patterns, you can:
- Identify peak sales months
- Detect slow seasons
- Compare Gross vs Net Sales trends
- Track cost impact month-over-month
Moreover, when you notice consistent margin decline, you can take corrective action early.
Therefore, this page strengthens financial planning.
Click to buy Sales Dashboard in Power BI
Advantages of Sales Dashboard in Power BI
A Sales Dashboard in Power BI offers multiple business benefits.
Real-Time Insights
You view performance instantly without waiting for reports.
Interactive Filtering
You filter data using slicers by month, region, product, or lead source.
Better Decision-Making
You identify problems early and act quickly.
Profitability Improvement
You analyze discount impact and control margin leakage.
Time-Saving Reporting
You reduce manual reporting work significantly.
Regional Comparison
You compare sales performance across territories.
Deep Product Insights
You understand product-level profitability clearly.
Therefore, businesses improve efficiency and growth simultaneously.
How to Build a Sales Dashboard in Power BI?
Although this dashboard already provides a ready-to-use solution, you can also build one step by step.
Step 1: Prepare Sales Data
Ensure your dataset includes:
- Date
- Product Category
- Region
- Industry
- Lead Source
- Gross Sales
- Discount
- Net Sales
- Shipping Cost
- COGS
- Profit
Step 2: Create Measures in Power BI
Use DAX formulas to calculate:
- Gross Sales
- Discount Amount
- Net Sales
- Profit Margin %
- Shipping Cost %
- COGS %
Step 3: Design Overview Page
Add KPI cards and high-level charts.
Step 4: Create Category & Region Pages
Add product, lead source, and region visuals.
Step 5: Add Monthly Trend Analysis
Use month hierarchy for time-based visuals.
Finally, publish the dashboard to Power BI Service for sharing.
Best Practices for the Sales Dashboard in Power BI
To maximize dashboard effectiveness, follow these best practices:
Keep Visuals Clean
Avoid overcrowding the page. Focus on important KPIs.
Use Consistent Color Themes
Maintain professional color consistency across pages.
Optimize DAX Measures
Write efficient measures to improve performance.
Use Dynamic Slicers
Allow users to filter by month, region, and category.
Highlight Key KPIs
Place KPI cards at the top of each page.
Focus on Profit Metrics
Track Profit Margin % consistently.
Update Data Regularly
Ensure data refresh happens automatically.
When you follow these practices, your dashboard delivers better insights.
Conclusion
A Sales Dashboard in Power BI transforms how businesses analyze sales performance. Instead of working with static reports, you gain interactive visibility into revenue, discount impact, margin performance, and trends.
Moreover, the five-page structure ensures complete coverage of sales insights — from overview metrics to product performance, lead source analysis, regional comparison, and monthly trends.
Therefore, if you want to improve decision-making, increase profitability, and reduce reporting effort, you should implement a Sales Dashboard in Power BI today.
Frequently Asked Questions with Answers
- What is a Sales Dashboard in Power BI?
A Sales Dashboard in Power BI is an interactive reporting solution that tracks sales KPIs like Gross Sales, Net Sales, Profit Margin %, and Discount Impact.
- Why should businesses use a sales dashboard?
Businesses use sales dashboards to monitor performance, improve decision-making, and identify profit opportunities quickly.
- How many pages does this Sales Dashboard include?
This dashboard includes five pages: Overview, Product Performance Analysis, Lead Source Analysis, Region Analysis, and Monthly Trends.
- Can I filter the dashboard by month or region?
Yes, you can use slicers to filter data by month, region, product category, and lead source.
- Does this dashboard track profit margin?
Yes, it calculates and displays Profit Margin % across products, regions, and lead sources.
- Is Power BI better than Excel for dashboards?
Power BI offers stronger visualization, interactivity, and data modeling capabilities compared to Excel. Therefore, many businesses prefer it for advanced dashboards.
- Can small businesses use this dashboard?
Yes, small businesses can use it effectively because Power BI supports scalable reporting.
Watch the step-by-step video tutorial:
Visit our YouTube channel to learn step-by-step video tutorials
Click to buy Sales Dashboard in Power BI