Home>Blogs>Charts and Visualization>Sales funnel infographic chart in Excel>Sales Funnel infographic Chart -5
Sales Funnel infographic Chart -5
17
Feb 2024
0Comments Off on Sales Funnel infographic Chart -5
PK
Meet PK, the founder of PK-AnExcelExpert.com! With over 15 years of experience in Data Visualization, Excel Automation, and dashboard creation. PK is a Microsoft Certified Professional who has a passion for all things in Excel. PK loves to explore new and innovative ways to use Excel and is always eager to share his knowledge with others. With an eye for detail and a commitment to excellence, PK has become a go-to expert in the world of Excel. Whether you're looking to create stunning visualizations or streamline your workflow with automation, PK has the skills and expertise to help you succeed. Join the many satisfied clients who have benefited from PK's services and see how he can take your Excel skills to the next level!
https://www.pk-anexcelexpert.com
Related Articles
Transportation Services Dashboard in Power BI
Managing transportation operations without clear visibility often leads to rising costs, delayed deliveries, and shrinking profits. As fuel prices fluctuate
Insurance Claim Dashboard in Power BI
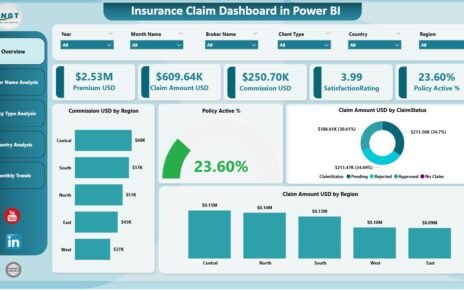
Insurance companies handle thousands of claims every month. Every claim includes policy details, customer information, documents, payout amounts, broker data,
NPS Dashboard in Excel
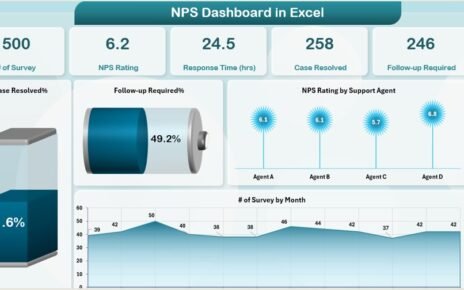
In today's highly competitive market, tracking customer satisfaction is essential for improving products, services, and overall business performance. One of


