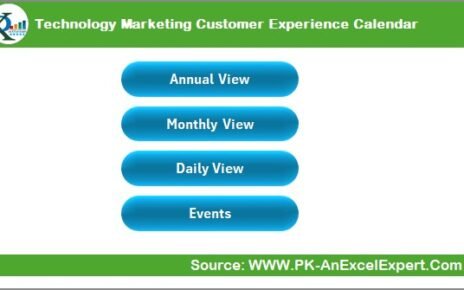
In today's fast-paced digital world, managing customer experiences effectively is more than a goal—it's a necessity. For technology marketing teams,
Keeping track of advertising performance metrics is essential for any business focused on maximizing its marketing efficiency and ROI. An
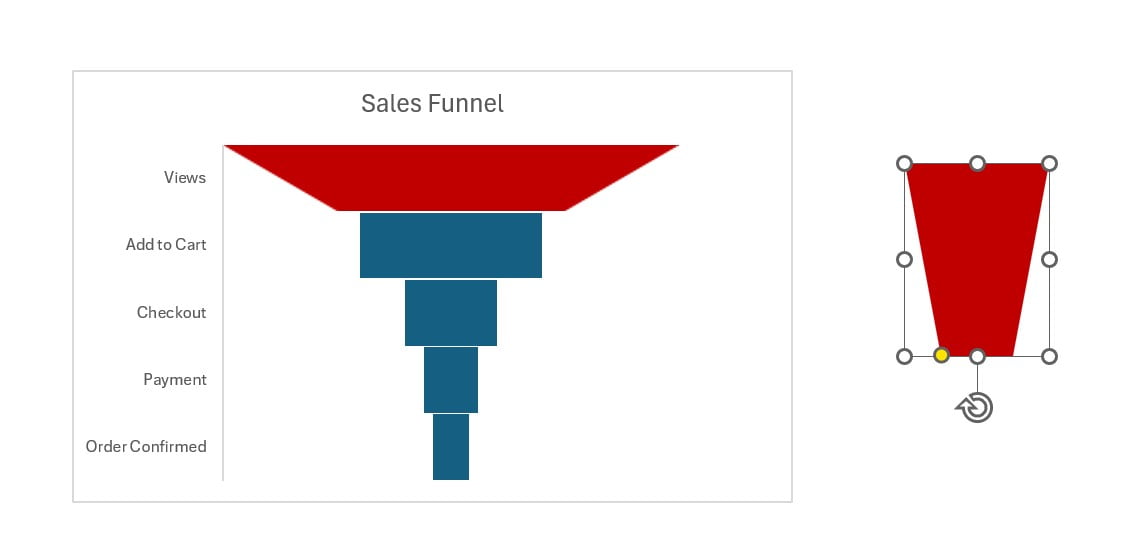
In today's data-driven world, a well-organized Data Warehouse KPI (Key Performance Indicator) Dashboard can significantly enhance how businesses track, analyze,