Data science and analytics teams play a critical role in modern organizations. They turn raw data into insights, guide strategic
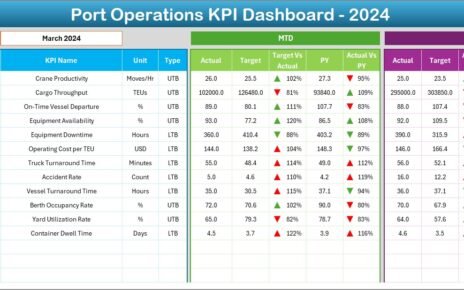
Port operations play a critical role in global trade and logistics. Every day, ports handle vessel arrivals, cargo movements, yard
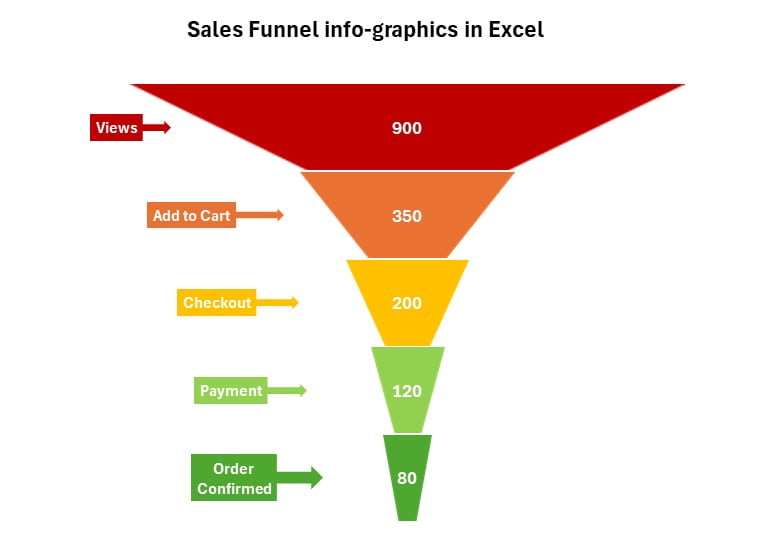
Sustainable tourism keeps growing because travelers now care about nature, culture, and local communities. At the same time, tourism businesses