The global maritime industry plays a crucial role in international trade. Every day, thousands of vessels transport commodities such as crude oil, coal, iron ore, grains, fertilizers, and manufactured goods across continents. Ship chartering companies, shipping brokers, and logistics operators must manage complex operations that include vessel contracts, cargo scheduling, port operations, fuel expenses, and revenue performance.
However, many ship chartering businesses still rely on spreadsheets, fragmented reports, and manual tracking systems to monitor charter contracts and operational costs. As a result, managers often struggle to evaluate performance, track fuel costs, analyze revenue trends, and identify operational delays quickly.
Therefore, companies increasingly adopt data analytics and visualization tools like Power BI to gain real-time insights into ship chartering operations. A well-designed dashboard allows organizations to monitor charter contracts, analyze fuel expenses, evaluate revenue performance, and track operational efficiency in a structured and interactive format.
One such powerful analytics solution is the Ship Chartering Dashboard in Power BI. This dashboard enables shipping companies and logistics operators to monitor key operational metrics, track charter performance, analyze costs, and make informed decisions using visual insights.
In this comprehensive guide, we will explore everything you need to know about the Ship Chartering Dashboard in Power BI, including its features, benefits, and best practices.
What is a Ship Chartering Dashboard in Power BI?
A Ship Chartering Dashboard in Power BI is an interactive business intelligence tool that helps maritime companies track and analyze ship chartering operations using visual reports and analytics.
This dashboard consolidates data related to:
-
Charter contracts
-
Cargo operations
-
Fuel costs
-
Revenue performance
-
Port operations
-
Delay metrics
Instead of reviewing multiple reports, managers can analyze all chartering metrics through a single centralized dashboard.
Moreover, Power BI provides interactive filters, slicers, and dynamic charts that allow users to explore data quickly and identify operational trends.
As a result, decision-makers can monitor vessel performance, evaluate broker revenue, track fuel consumption, and optimize chartering strategies.
Why Do Shipping Companies Need a Ship Chartering Dashboard?
The maritime industry generates large volumes of operational data. Shipping companies must track several variables such as charter contracts, cargo types, fuel expenses, loading ports, and discharge ports.
Without proper analytics tools, companies face several challenges.
Common Challenges in Ship Chartering Operations
-
Difficulty tracking charter performance across multiple vessels
-
Limited visibility into fuel expenses by region or cargo type
-
Delays in analyzing charter contract duration and operational efficiency
-
Challenges in monitoring broker performance and revenue generation
-
Inefficient reporting processes that consume time and resources
However, a Power BI Ship Chartering Dashboard solves these challenges by transforming raw data into actionable insights.
Therefore, managers can quickly identify operational issues, monitor financial performance, and improve decision-making.
Key Features of the Ship Chartering Dashboard in Power BI
This dashboard contains five interactive analytical pages designed to analyze chartering performance from different perspectives.
Each page focuses on a specific operational dimension, which allows users to explore insights in detail.
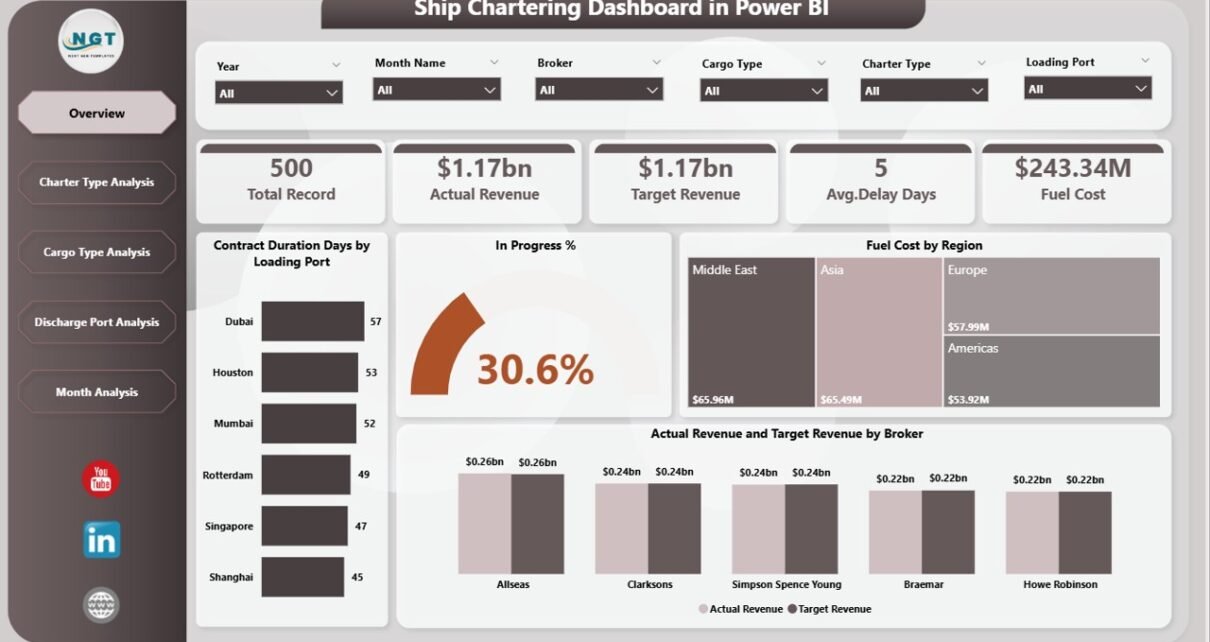
1. Overview Page – The Central Performance Monitoring Hub
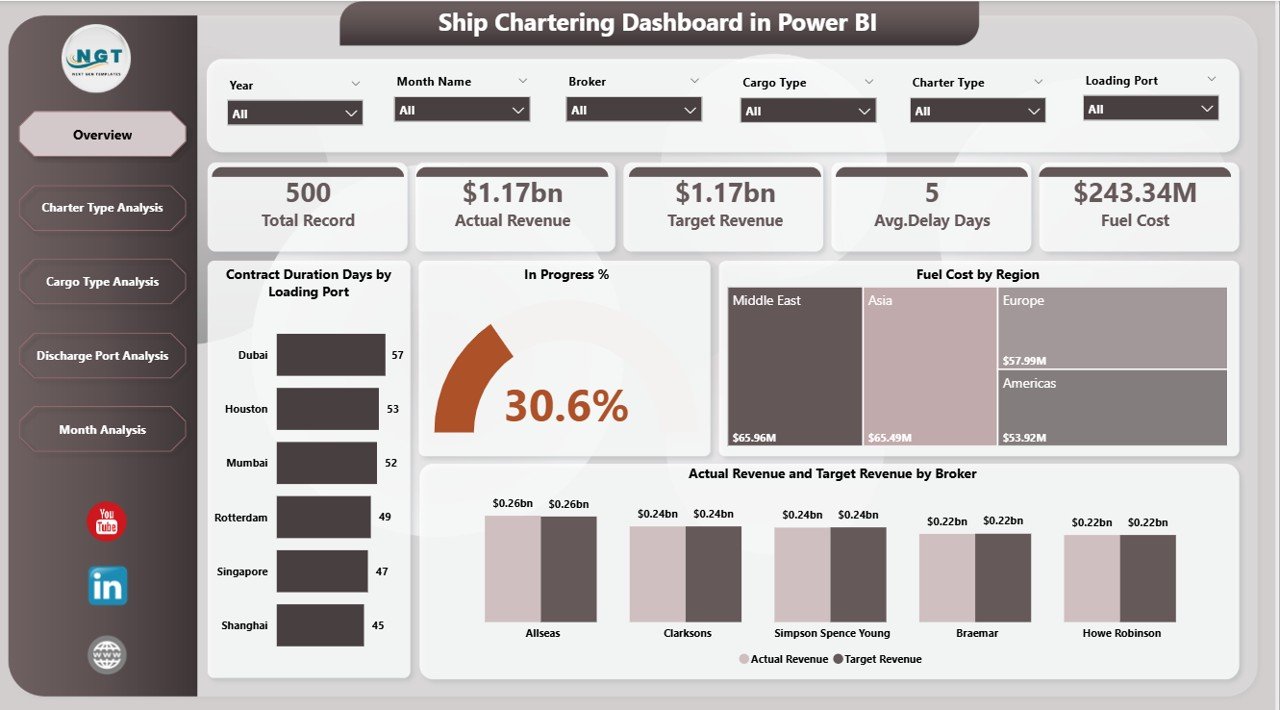
The Overview Page provides a comprehensive snapshot of ship chartering operations. It helps managers understand overall performance metrics at a glance.
This page contains interactive slicers that allow users to filter data by different operational dimensions.
KPI Cards on the Overview Page
The dashboard includes five important KPI indicators:
-
Contract Duration Days by Loading Port
-
In Progress %
-
Fuel Cost by Region
-
Actual Revenue
-
Target Revenue by Broker
These KPIs help managers monitor operational progress, track financial performance, and evaluate fuel cost distribution across regions.
Visual Charts on the Overview Page
The overview page includes multiple visual charts that display performance insights such as:
-
Contract duration analysis by loading port
-
Operational progress tracking
-
Fuel cost distribution by region
-
Revenue performance by broker
As a result, users can quickly evaluate the overall health of chartering operations.
2. Charter Type Analysis – Understanding Performance by Charter Agreements
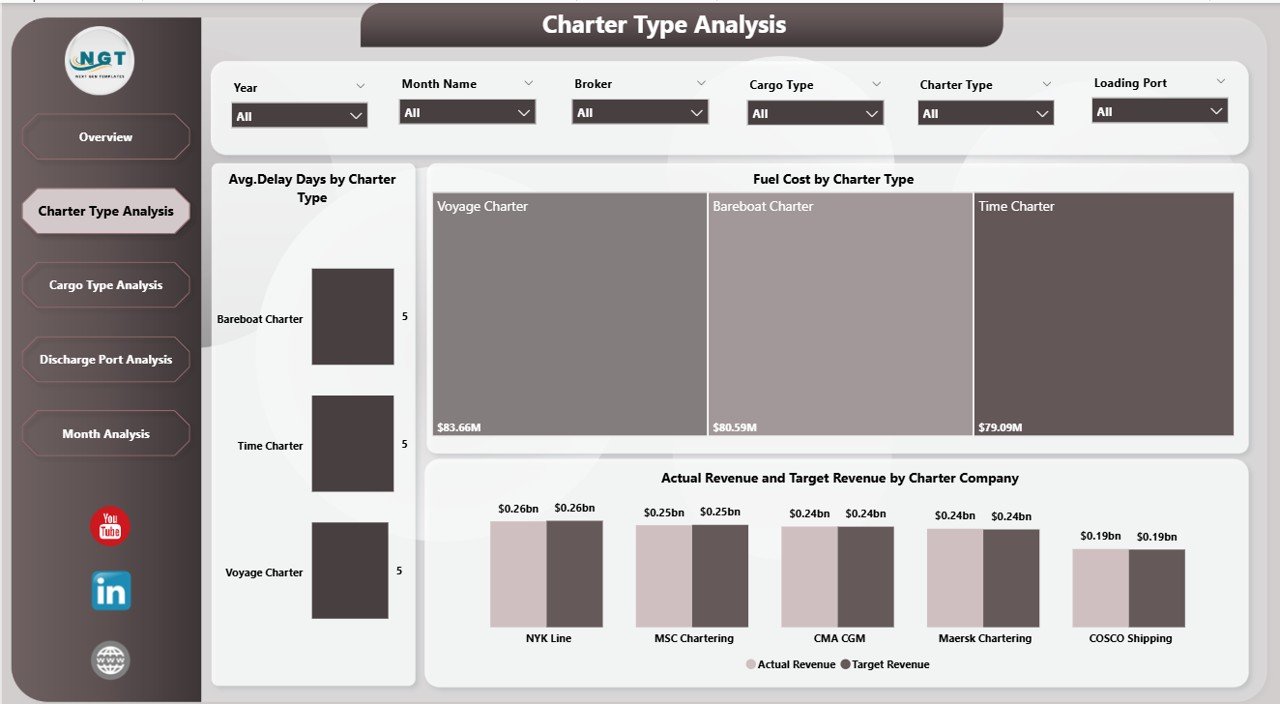
Charter agreements vary depending on the shipping arrangement. For example, companies may use time charters, voyage charters, or bareboat charters.
Therefore, organizations must analyze performance across different charter types.
The Charter Type Analysis Page helps managers evaluate operational efficiency and revenue performance for each charter category.
Charts Included in This Page
This page contains three important charts:
-
Average Delay Days by Charter Type
-
Fuel Cost by Charter Type
-
Actual Revenue vs Target Revenue by Charter Type
Insights Gained from This Analysis
Using this analysis, companies can:
-
Identify charter types that experience frequent delays
-
Compare fuel costs across different charter contracts
-
Evaluate which charter types generate higher revenue
Consequently, companies can optimize their chartering strategies and improve profitability.
3. Cargo Type Analysis – Evaluating Performance by Cargo Categories
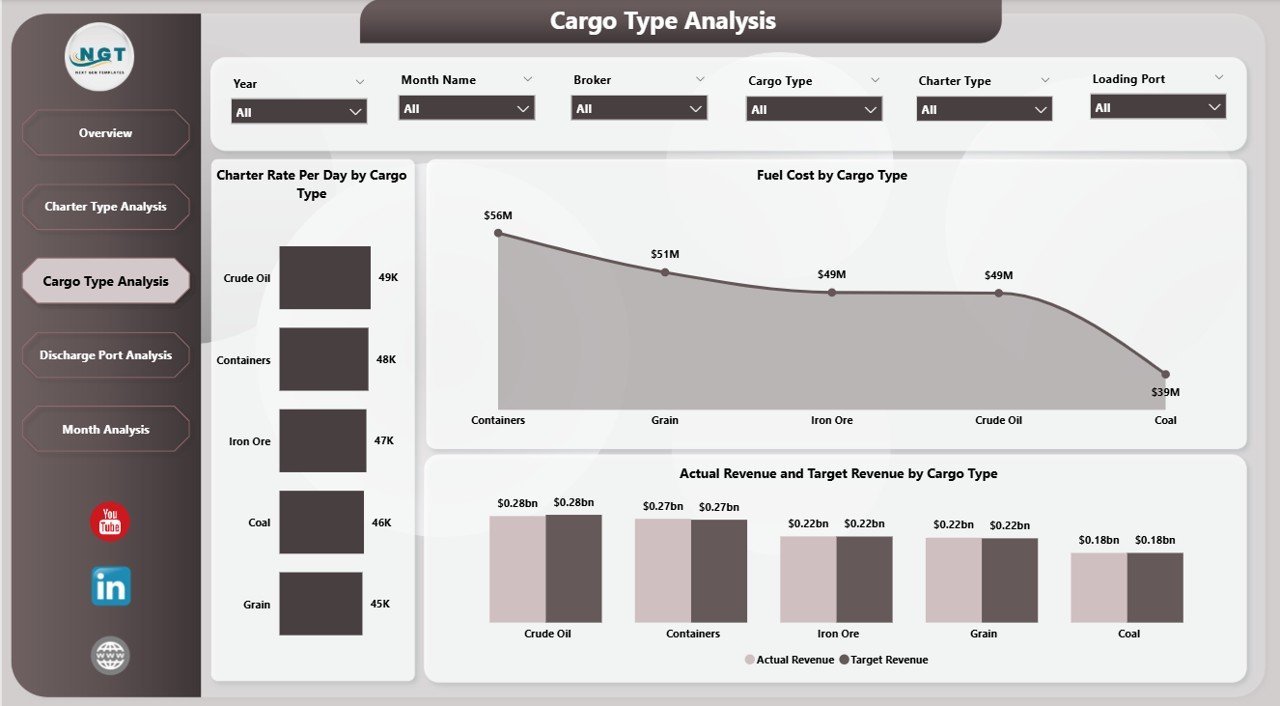
Ships transport different types of cargo such as dry bulk, liquid bulk, containerized cargo, and general cargo.
Each cargo type involves different operational costs and charter rates.
Therefore, companies must analyze cargo-specific performance.
The Cargo Type Analysis Page helps organizations evaluate charter performance based on cargo categories.
Charts Available on This Page
This section includes the following visual insights:
-
Charter Rate Per Day by Cargo Type
-
Fuel Cost by Cargo Type
-
Actual Revenue vs Target Revenue by Cargo Type
Key Benefits of Cargo Analysis
Cargo-based analysis allows companies to:
-
Identify the most profitable cargo segments
-
Monitor fuel expenses related to specific cargo operations
-
Compare revenue performance across cargo categories
As a result, decision-makers can improve cargo planning and optimize chartering contracts.
4. Discharge Port Analysis – Monitoring Performance by Destination Ports
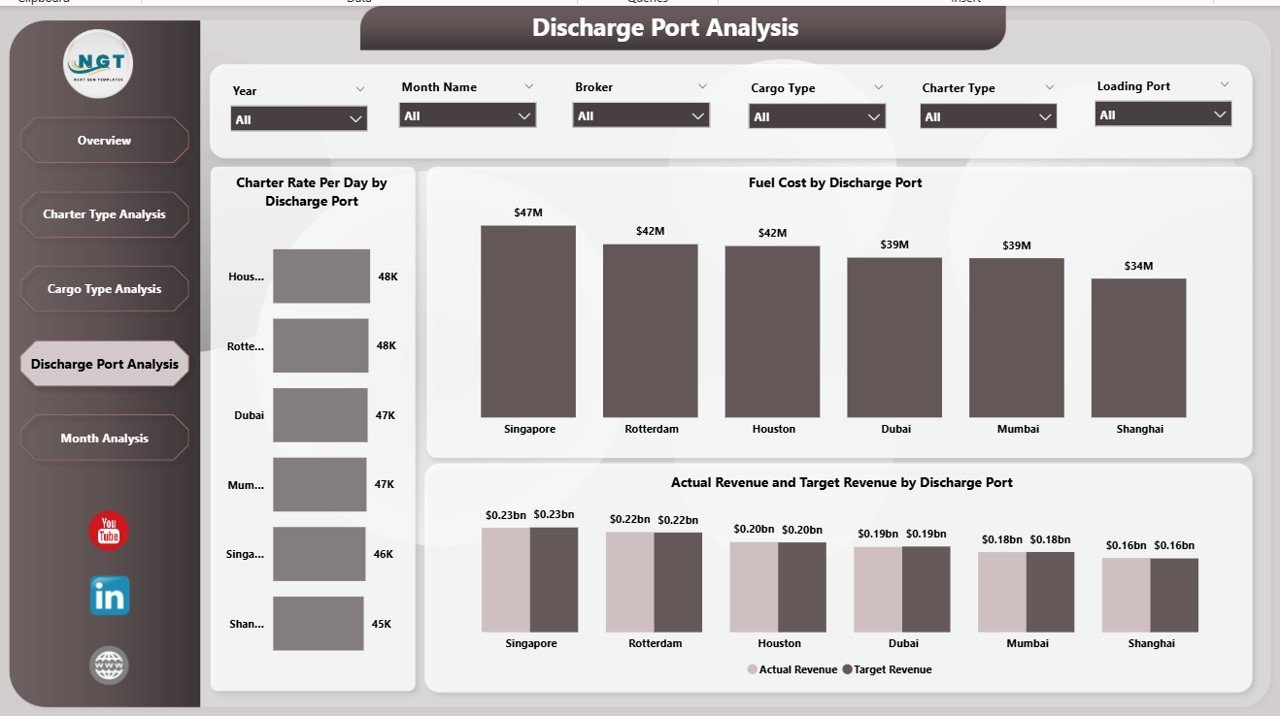
Port operations significantly influence chartering performance. Factors such as congestion, infrastructure capacity, and weather conditions can impact operational efficiency.
Therefore, companies must monitor performance across discharge ports.
The Discharge Port Analysis Page provides insights into how different ports affect chartering performance.
Charts Included in This Page
The page contains the following charts:
-
Charter Rate Per Day by Discharge Port
-
Fuel Cost by Discharge Port
-
Actual Revenue vs Target Revenue by Discharge Port
Business Insights from Port Analysis
Using this analysis, organizations can:
-
Identify ports that generate higher revenue
-
Monitor fuel costs associated with specific ports
-
Evaluate port efficiency and operational performance
Therefore, companies can select optimal discharge ports for future operations.
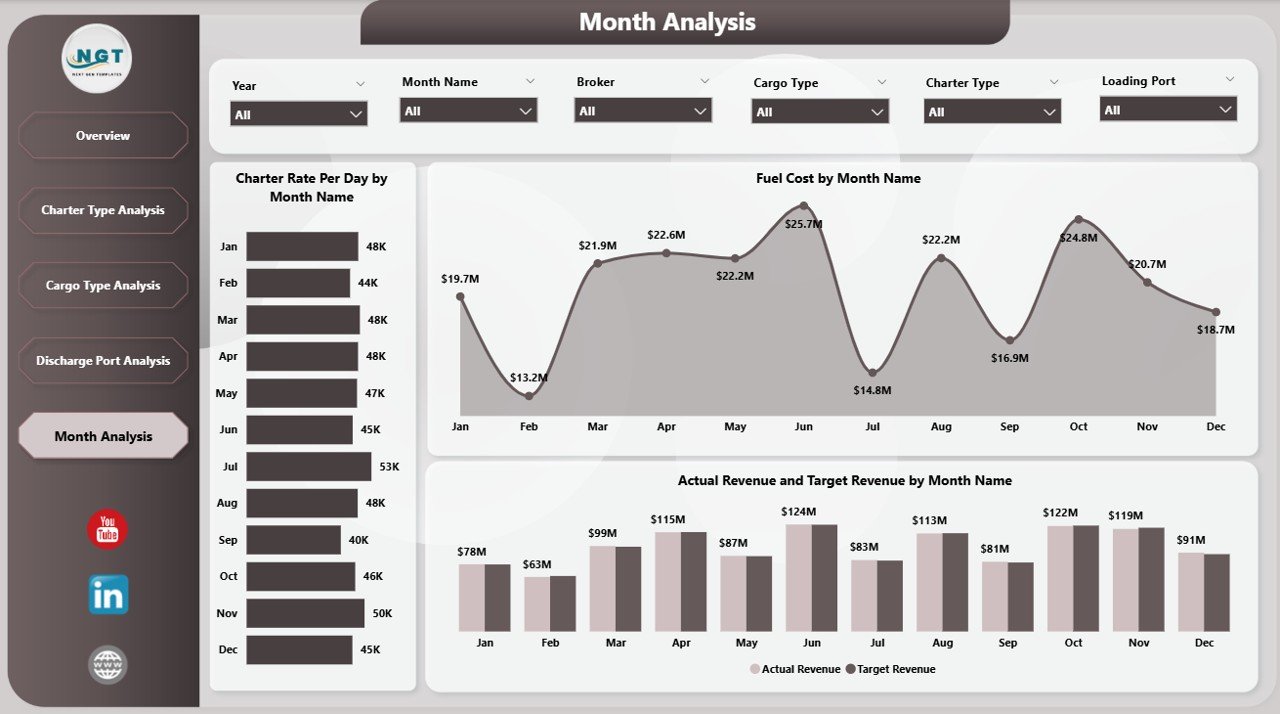
5. Monthly Analysis – Tracking Operational Trends Over Time
Shipping operations fluctuate throughout the year due to seasonal demand, market conditions, and cargo availability.
Therefore, companies must track performance trends over time.
The Monthly Analysis Page helps managers analyze chartering metrics month by month.
Charts Included in Monthly Analysis
This page contains three important charts:
-
Charter Rate Per Day by Month
-
Fuel Cost by Month
-
Actual Revenue vs Target Revenue by Month
Benefits of Monthly Performance Analysis
Monthly insights help companies:
-
Identify seasonal trends in charter rates
-
Monitor fluctuations in fuel costs
-
Compare monthly revenue performance
Consequently, companies can plan future operations more effectively.
Advantages of Ship Chartering Dashboard in Power BI
Implementing a Ship Chartering Dashboard in Power BI offers several strategic advantages.
1. Real-Time Operational Insights
Power BI enables companies to monitor chartering data in real time. Therefore, managers can quickly identify operational issues and respond proactively.
2. Centralized Data Monitoring
The dashboard consolidates multiple data sources into a single platform. As a result, users can access all critical metrics from one location.
3. Improved Decision-Making
Visual analytics simplify complex data. Consequently, decision-makers can evaluate operational performance quickly.
4. Cost Control and Fuel Monitoring
Fuel costs represent a major expense in shipping operations. This dashboard allows companies to track fuel costs across regions, cargo types, and ports.
5. Revenue Performance Tracking
Companies can compare actual revenue vs target revenue, which helps evaluate charter contract profitability.
6. Enhanced Operational Transparency
The dashboard improves visibility across different operational dimensions, including charter type, cargo type, and ports.
Best Practices for Implementing a Ship Chartering Dashboard
To maximize the benefits of the Ship Chartering Dashboard, organizations should follow several best practices.
Ensure Data Accuracy
Companies must maintain accurate and updated operational data. Clean data ensures reliable insights.
Integrate Multiple Data Sources
Organizations should integrate data from vessel management systems, fuel tracking systems, and financial systems.
Define Clear KPIs
Companies should clearly define key performance indicators such as:
-
Charter rate per day
-
Fuel cost per voyage
-
Contract duration
-
Delay days
-
Revenue performance
Train Users Properly
Organizations should train operational teams to use dashboard features effectively.
Monitor Dashboard Performance
Companies should regularly review dashboard performance and update metrics if necessary.
How Does Power BI Improve Ship Chartering Analytics?
Power BI offers several powerful features that improve maritime analytics.
Interactive Data Visualization
Users can explore insights using dynamic charts and graphs.
Real-Time Data Updates
Power BI allows automatic data refresh, which ensures updated operational insights.
Advanced Data Modeling
Power BI enables complex data analysis using relationships, calculated measures, and KPIs.
Drill-Down Analytics
Users can drill down into detailed data for deeper analysis.
Who Can Benefit from a Ship Chartering Dashboard?
Several stakeholders in the maritime industry can benefit from this dashboard.
Shipping Companies
Shipping companies can monitor charter performance and optimize operational efficiency.
Ship Brokers
Brokers can evaluate revenue performance and track charter contracts.
Maritime Logistics Companies
Logistics operators can analyze cargo movements and fuel costs.
Port Authorities
Ports can monitor shipping performance and operational efficiency.
Maritime Analysts
Analysts can evaluate shipping trends and operational metrics.
Conclusion
The maritime shipping industry depends heavily on operational efficiency, cost control, and effective charter management. However, manual reporting and scattered spreadsheets often limit the ability of organizations to analyze complex shipping data.
The Ship Chartering Dashboard in Power BI provides a powerful solution to these challenges. It transforms operational data into interactive visual insights that help managers monitor charter contracts, analyze fuel costs, evaluate revenue performance, and track operational trends.
Moreover, the dashboard offers multiple analytical perspectives, including charter type analysis, cargo type analysis, port analysis, and monthly performance tracking.
As a result, shipping companies can improve operational visibility, optimize chartering strategies, and enhance profitability.
Organizations that adopt data-driven dashboards will gain a competitive advantage in the rapidly evolving maritime industry.
Frequently Asked Questions (FAQs)
What is ship chartering?
Ship chartering refers to the process of renting or leasing a vessel for transporting cargo from one port to another.
Why is a ship chartering dashboard important?
A ship chartering dashboard helps companies monitor charter contracts, fuel costs, cargo performance, and revenue metrics using visual analytics.
Why should companies use Power BI for shipping analytics?
Power BI provides interactive dashboards, real-time analytics, and advanced data visualization, which improve operational decision-making.
What KPIs should a ship chartering dashboard include?
Common KPIs include:
-
Charter rate per day
-
Fuel cost
-
Contract duration
-
Delay days
-
Actual vs target revenue
Who uses ship chartering dashboards?
Shipping companies, brokers, logistics operators, maritime analysts, and port authorities use chartering dashboards.
Visit our YouTube channel to learn step-by-step video tutorials