The shipbuilding industry manages some of the world’s most complex, expensive, and time-sensitive projects. Every vessel requires thousands of tasks, multiple shipyards, several engineering teams, strict safety rules, and continuous cost analysis. Because of this, companies struggle to track data in real time. The information often spreads across several spreadsheets, emails, meetings, and manual reports. As a result, delays increase, costs rise, and decision-making becomes slow.
A Shipbuilding Dashboard in Excel solves these problems with clarity. It brings all shipyard, vessel, segment, and monthly project data into one simple, clean, and ready-to-use dashboard. Anyone in the organization—whether a project manager, operations team, or senior management—can monitor performance, cost, delays, effort hours, and risk ratings without opening multiple reports.
This article explains everything about the Shipbuilding Dashboard in Excel, how each page works, why shipbuilding companies need it, and how to use it effectively. The insights will help you understand how Excel transforms complex shipbuilding operations into clear, decision-focused analytics.
Click to Purchases Shipbuilding Dashboard in Excel
What Is a Shipbuilding Dashboard in Excel?
A Shipbuilding Dashboard in Excel is a ready-to-use project management and performance monitoring tool. It tracks risk rating, project delays, planned cost, actual cost, vessel efficiency, segment analysis, and shipyard performance in a structured way. It uses Excel formulas, charts, slicers, and navigation buttons to provide a complete view of shipbuilding operations.
The dashboard helps shipbuilding companies monitor:
-
Planned vs actual cost
-
Actual hours vs planned efforts
-
Delayed project percentage
-
Risk rating by shipyard, vessel type, and segment
-
Monthly trends
-
Region-wise performance
-
Total number of projects
Since all charts and cards update instantly based on the slicer selection, teams get accurate insights without manual calculations.
Why Do Shipbuilding Companies Need a Dashboard?
Shipbuilding involves a combination of engineering, procurement, planning, and financial activities. Without a clear monitoring tool, data becomes scattered, and leaders fail to take timely decisions. A dashboard centralizes information so that every team works with complete visibility.
Teams use this dashboard to:
-
Monitor shipyard performance
-
Control rising project costs
-
Identify delays and their causes
-
Compare planned and actual metrics
-
Track monthly and annual shipbuilding trends
-
Improve accountability and productivity
Because the dashboard uses Excel, anyone can start using it without training or additional software.
Key Features of the Shipbuilding Dashboard in Excel
This dashboard includes five main analytical pages and a support sheet to manage the backend data. The left-side Page Navigator helps users jump to any page with a single click.
Below is a detailed explanation of each page.
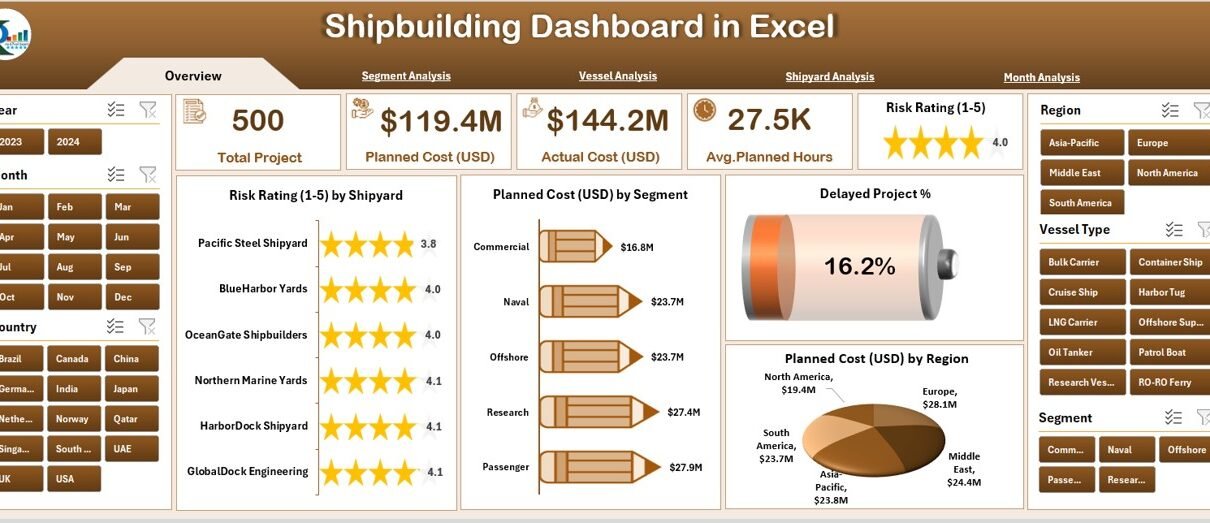
1. Overview Page – What Does It Show?
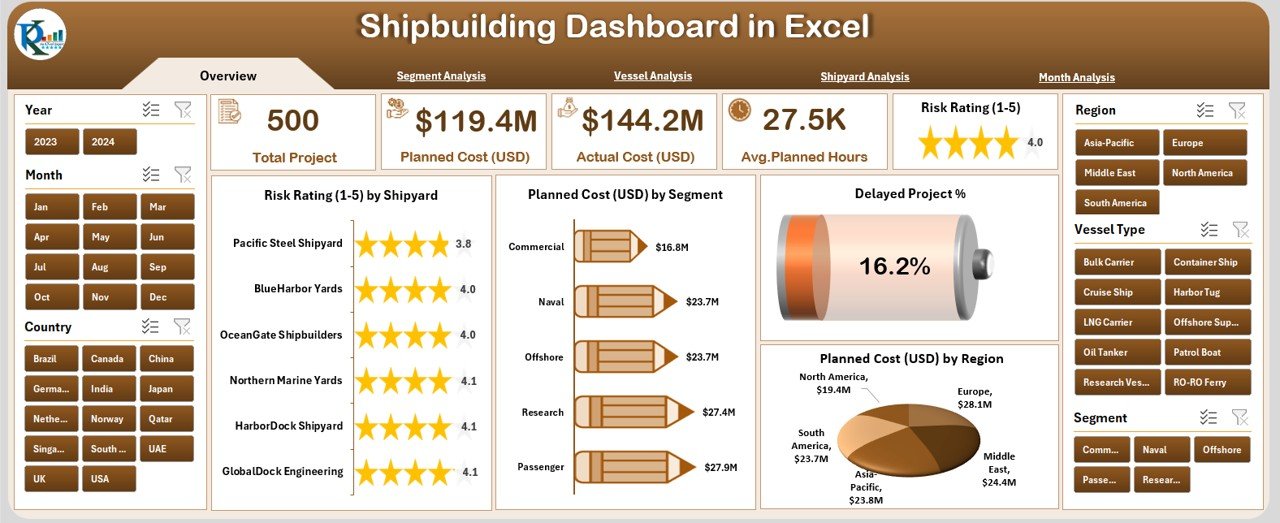
The Overview Page acts as the main summary page of the dashboard. It gives decision-makers a quick snapshot of shipbuilding performance.
Key Elements of the Overview Page
✔ Right-Side Slicer Panel
The slicer panel helps users filter data by:
-
Year
-
Segment
-
Shipyard
-
Vessel type
-
Region
With this, anyone can instantly view KPIs for a particular category.
✔ Five Card KPIs
The overview page displays five important cards to show high-level insights:
-
Total Projects
-
Total Planned Cost
-
Total Actual Cost
-
Delayed Project %
-
Total Actual Hours
These cards update automatically based on slicer selection.
✔ Four Powerful Charts
The page includes four visually clear charts:
-
Risk Rating by Shipyard
-
Planned Cost (USD) by Segment
-
Delayed Project %
-
Planned Cost (USD) by Region
These charts provide complete clarity on where risks are rising, which segment needs attention, and which regions require planning control.
Click to Purchases Shipbuilding Dashboard in Excel
2. Segment Analysis – How Does It Help?
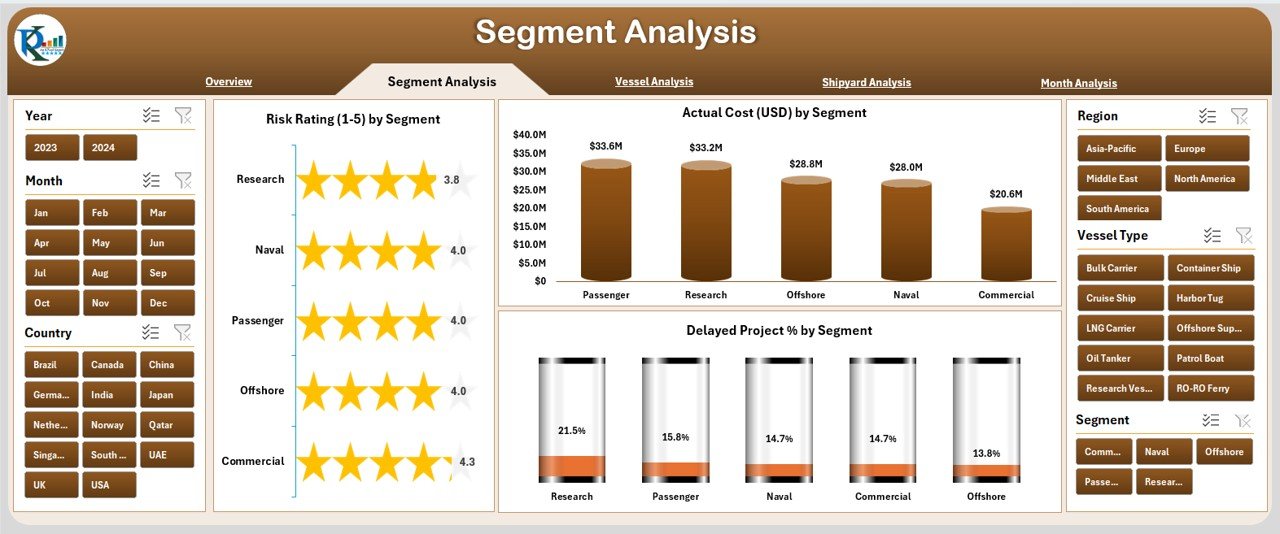
The Segment Analysis Page focuses on how different shipbuilding segments perform. Every shipbuilding company works on multiple segments such as commercial vessels, defense vessels, offshore structures, and more. This page makes analysis simple.
Key Features of Segment Analysis
✔ Right-Side Slicer Panel
Users can filter data by segment, region, and year to get accurate insights.
✔ Three Detailed Charts
-
Risk Rating by Segment
-
Delayed Project % by Segment
-
Actual Cost (USD) by Segment
These charts help management identify which segment over-consumes cost, which segment delays projects, and which segments have higher risk ratings.
This analysis improves strategic decision-making.
3. Vessel Analysis – Why Is It Important?
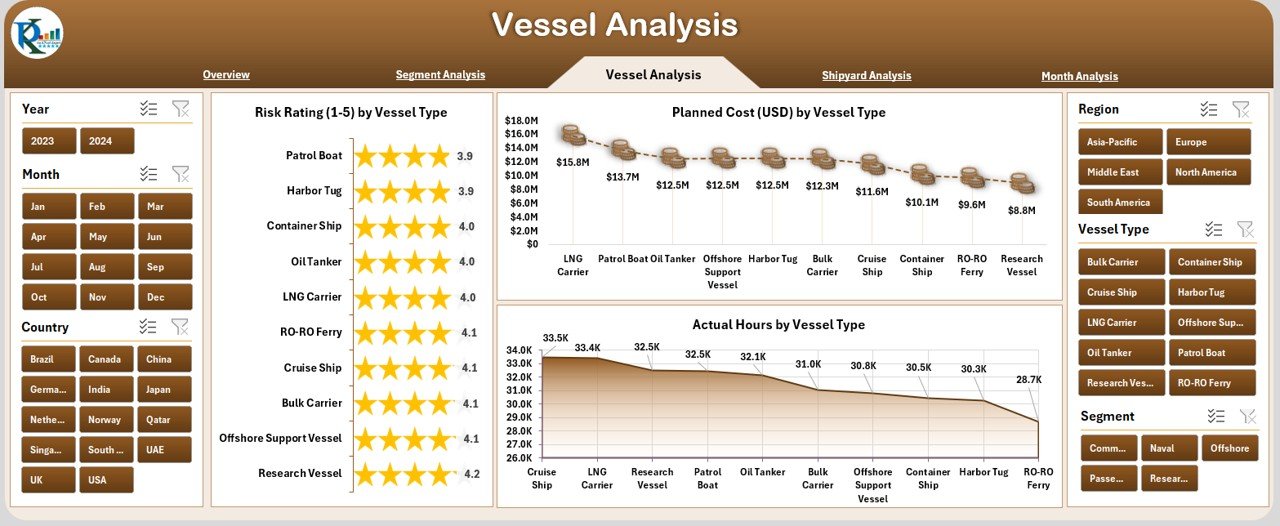
Vessel-wise analysis is important because each vessel type behaves differently. For example, cargo ships, naval vessels, tankers, cruise ships, and offshore vessels have different cost structures and workforce needs.
The Vessel Analysis Page tracks:
✔ Right-Side Slicer Panel
Filters allow comparison between vessel types.
✔ Three Core Charts
-
Risk Rating by Vessel Type
-
Planned Cost (USD) by Vessel Type
-
Actual Hours by Vessel Type
These insights help companies:
-
Identify vessel types requiring high labor effort
-
Control vessel-wise cost
-
Predict project delays based on vessel complexity
-
Improve workforce and resource allocation
4. Shipyard Analysis – What Can You Learn?
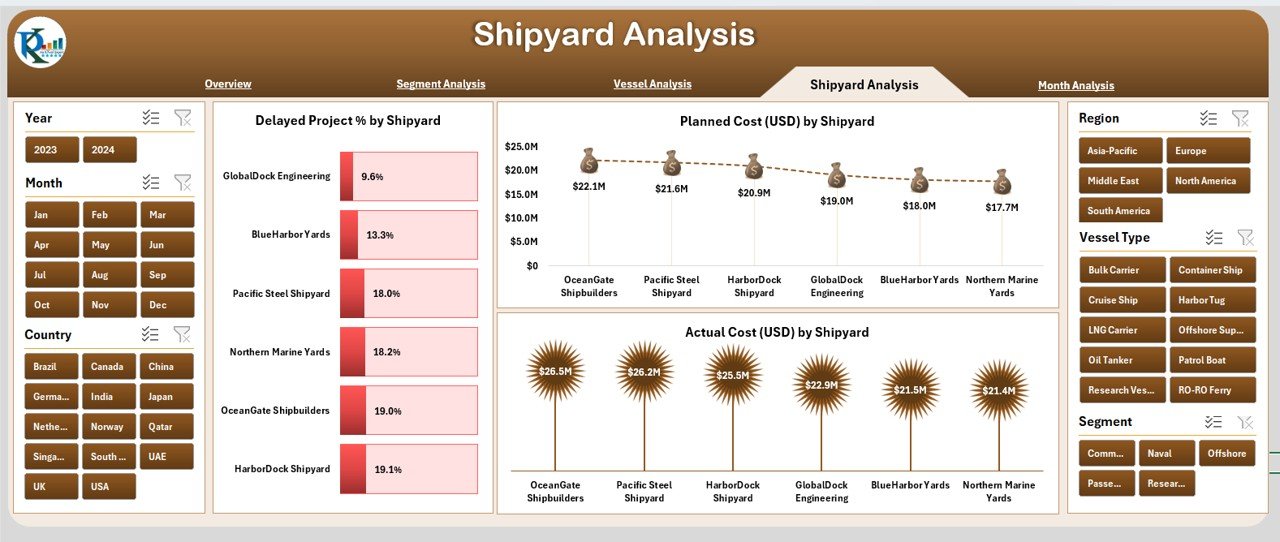
Every shipyard has a different performance level because of location, workforce expertise, supplier availability, and project capacity. The Shipyard Analysis Page provides complete clarity on each shipyard’s effectiveness.
Key Components
✔ Right-Side Slicer Panel
Compare shipyards using filters like year, region, or segment.
✔ Three Charts
-
Delayed Project % by Shipyard
-
Planned Cost (USD) by Shipyard
-
Actual Hours by Shipyard
With these insights, leaders identify underperforming shipyards and take corrective actions.
Click to Purchases Shipbuilding Dashboard in Excel
5. Monthly Analysis – What Do Monthly Trends Show?
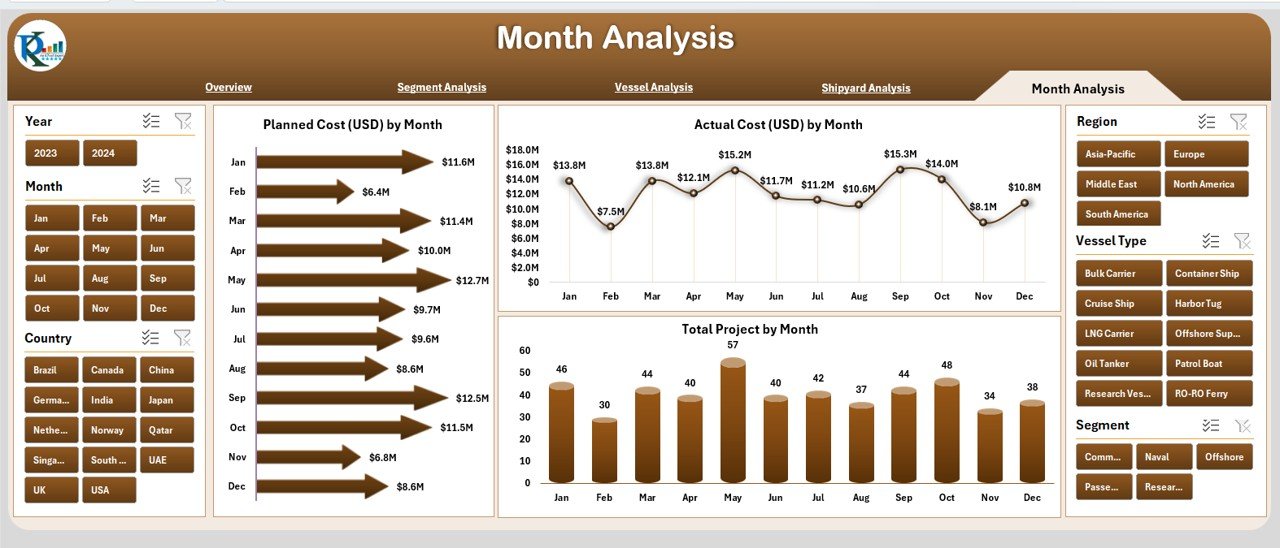
Monthly trends allow companies to understand seasonal patterns, cost variations, and workload distribution.
The Month Analysis Page includes:
✔ Right-Side Slicer Panel
✔ Three Charts
-
Planned Cost (USD) by Month
-
Actual Cost (USD) by Month
-
Total Projects by Month
This page helps identify:
-
Peak workload months
-
High-spending periods
-
Months where projects slow down
-
Gaps between planned and actual cost
Monthly tracking helps teams forecast and prepare better.
Support Sheets
1. Data Sheet
This sheet stores all raw data required for dashboard visuals. Teams update the data here, and the dashboard reflects the changes instantly.
2. Support Sheet
The sheet contains mapping tables, dropdown lists, and other backend references used for slicers and charts.
Advantages of Shipbuilding Dashboard in Excel
Click to Purchases Shipbuilding Dashboard in Excel
Below are the major advantages:
1. Improves Real-Time Monitoring
The dashboard updates instantly when teams change data, so everyone works with the latest information.
2. Reduces Project Delays
Leaders identify problems early because the dashboard highlights delay percentages and high-risk segments.
3. Controls Cost Overruns
Comparison between planned and actual cost helps teams control budget and avoid unnecessary expenses.
4. Enhances Workforce Efficiency
Actual hours by vessel and shipyard reveal where teams overuse resources.
5. Increases Productivity
Since the dashboard is simple, every team member uses it without training.
6. Supports Faster Decisions
Charts and card KPIs highlight important information clearly, helping leaders take immediate action.
Best Practices for the Shipbuilding Dashboard in Excel
To get the best results, teams should follow these practices:
1. Update Data Weekly
Frequent updates ensure accuracy and improve decision-making.
2. Maintain Clean Data
Use consistent names, date formats, and segment classifications for error-free results.
3. Use Slicers for Comparative Analysis
Compare shipyards, vessel types, or segments to get deeper insights.
4. Track Monthly and Yearly Trends
This helps predict future workload and cost movement.
5. Review Risk Ratings Regularly
High-risk segments and shipyards need immediate attention.
6. Compare Planned vs Actual Consistently
This helps avoid cost overruns and resource wastage.
7. Protect and Backup Your Dashboard File
Keep backup copies to avoid data loss and protect formulas.
Conclusion
The Shipbuilding Dashboard in Excel is one of the most effective tools for shipbuilding companies. It simplifies complex data, improves cost control, increases transparency, and supports smarter decision-making. This dashboard gives shipbuilding leaders a complete view of risk rating, cost movement, delay percentage, segment performance, and monthly project trends. Because it runs fully inside Excel, teams can start using it immediately without extra training or software.
When shipbuilding companies adopt such smart dashboards, they manage operations with more confidence and accuracy.
Frequently Asked Questions (FAQs)
1. What is a Shipbuilding Dashboard in Excel?
It is a ready-to-use Excel dashboard that tracks cost, risk rating, project delays, shipyard performance, vessel analysis, and monthly trends.
2. Who should use this dashboard?
Project managers, shipyard supervisors, planners, finance teams, and senior management use it every day.
3. Is this dashboard easy to use?
Yes, it uses simple slicers, charts, and cards so anyone can use it without training.
4. Can I customize the dashboard?
Yes, you can add or remove KPIs, modify charts, or update data fields as per project needs.
5. How often should I update the data?
Weekly updates are ideal, but companies can update data daily when projects move fast.
6. Does this dashboard work for all shipbuilding segments?
Yes, it works for commercial, defense, offshore, cargo, and all other vessel types.
7. Will this dashboard help in reducing delays?
Yes, it highlights high-risk shipyards, segments, and vessel types so teams can take corrective actions.
Visit our YouTube channel to learn step-by-step video tutorials