Skill development programs play a crucial role in improving employment opportunities, strengthening industries, and supporting economic growth. Governments, NGOs, training institutions, and educational organizations continuously launch skill development missions to train individuals and prepare them for real-world jobs. However, managing multiple training programs, tracking candidates, monitoring placements, and analyzing performance often becomes difficult when teams rely on scattered spreadsheets.
Therefore, organizations increasingly adopt structured analytical tools that transform raw training data into meaningful insights. One of the most practical and powerful solutions is the Skill Development Missions Dashboard in Excel.
In this comprehensive article, you will learn what a Skill Development Missions Dashboard in Excel is, why organizations need it, how it works, its features, advantages, best practices, and frequently asked questions. Moreover, you will understand how Excel dashboards help decision-makers monitor mission performance efficiently and make data-driven improvements.
Click to Purchases Skill Development Missions Dashboard in Excel
What Is a Skill Development Missions Dashboard in Excel?
A Skill Development Missions Dashboard in Excel is a ready-to-use analytical system designed to monitor, analyze, and manage skill training programs using structured data and interactive visual reports.
Instead of reviewing multiple reports manually, administrators can analyze all mission-related information from one centralized dashboard. Additionally, Excel automatically updates charts and KPIs whenever users change filters or update data.
This dashboard helps organizations track:
-
Candidate enrollment and completion
-
Training center performance
-
Placement targets and achievements
-
Trainer effectiveness
-
Course performance
-
Monthly mission progress
-
Program satisfaction levels
As a result, teams gain complete visibility into training outcomes without complex software.
Why Do Organizations Need a Skill Development Missions Dashboard?
Skill development initiatives generate large volumes of data every month. For example, organizations must track trainees, trainers, centers, courses, funding sources, and placements simultaneously. Without a structured system, analyzing this information becomes time-consuming and error-prone.
However, a dashboard solves these challenges by organizing data visually.
Key Challenges Without a Dashboard
-
Data stored in multiple files
-
Manual report preparation
-
Difficulty tracking placements
-
Lack of real-time insights
-
Delayed decision-making
-
Limited performance visibility
How the Dashboard Helps
-
Centralizes all mission data
-
Automates reporting processes
-
Improves monitoring accuracy
-
Enhances accountability
-
Enables faster decision-making
Consequently, administrators can focus more on improving training outcomes rather than preparing reports.
Key Features of the Skill Development Missions Dashboard in Excel
This ready-to-use Excel dashboard includes structured analytical pages and interactive visuals designed for easy navigation and performance monitoring.
Page Navigator for Easy Access
The dashboard includes a Page Navigator located on the left side, allowing users to move quickly between analytical pages. Therefore, users can analyze different perspectives of mission performance without searching across sheets.
The Excel desktop application contains five analytical pages, each focusing on a specific aspect of skill development missions.
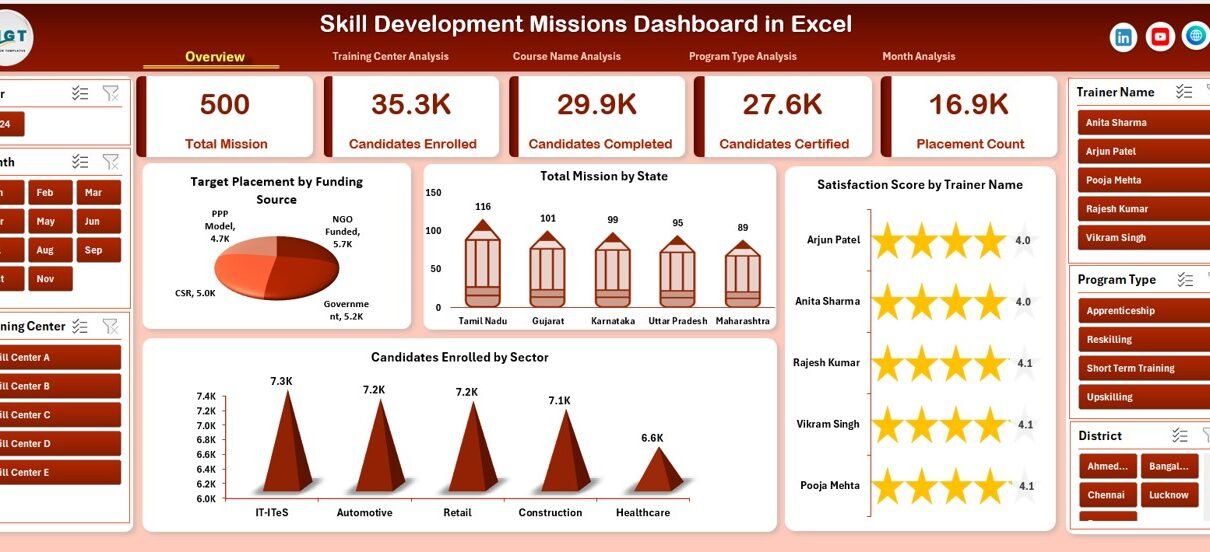
Overview Page: What Does the Main Dashboard Show?
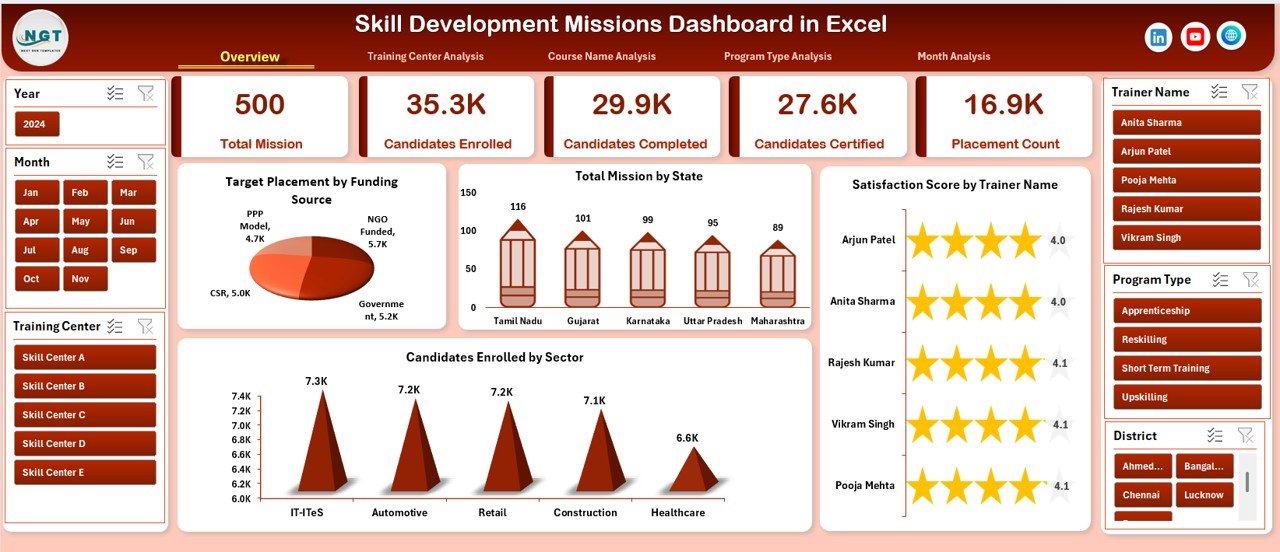
The Overview Page acts as the central control panel of the dashboard. It provides a high-level summary of mission performance using KPI cards and charts.
KPI Cards and Visual Insights
The page includes four major charts:
-
Target Placement by Funding Source
-
Total Mission by State
-
Satisfaction Score by Trainer Name
-
Candidates Enrolled by Sector
Because these visuals appear on a single screen, decision-makers quickly understand overall program performance.
Insights You Can Derive
-
Which funding source delivers better placement outcomes
-
Which states run the most missions
-
Trainer satisfaction comparison
-
Sector-wise training demand trends
Therefore, leaders can immediately identify strengths and improvement areas.
Training Center Analysis: How Do Training Centers Perform?
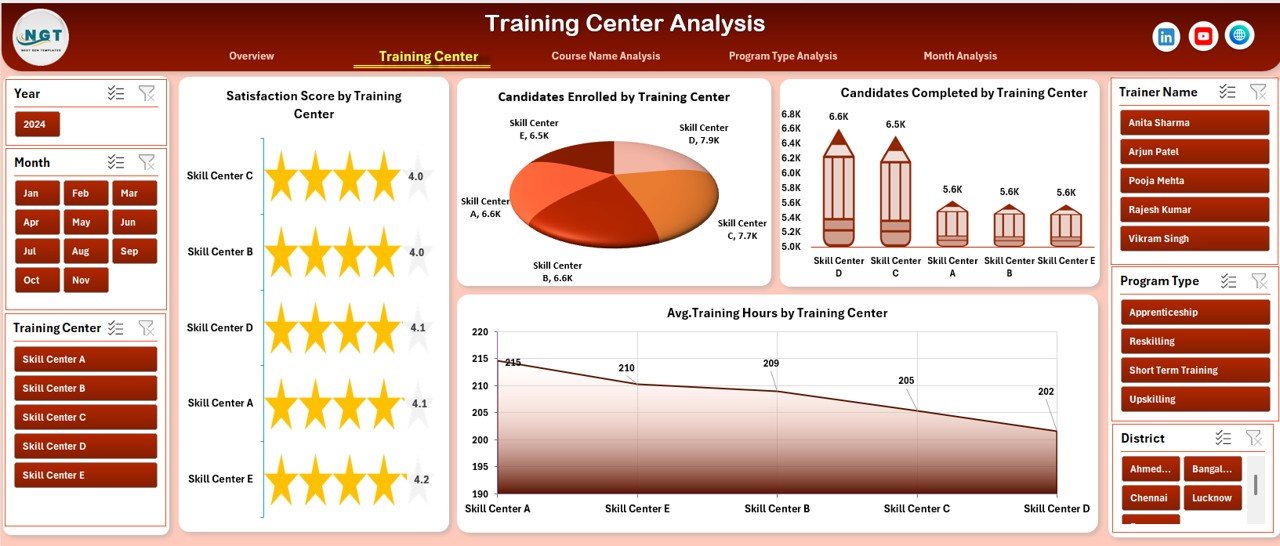
Training centers play a major role in mission success. Consequently, organizations must monitor their efficiency carefully.
The Training Center Analysis Page focuses on performance comparison across training locations.
Charts Included
-
Satisfaction Score by Trainer Center
-
Candidates Enrolled by Trainer Center
-
Candidates Completed by Trainer Center
-
Average Training Hours by Trainer Center
Why This Analysis Matters
This page helps organizations:
-
Identify top-performing centers
-
Detect underperforming locations
-
Optimize training hours
-
Improve candidate completion rates
As a result, administrators can allocate resources more effectively.
Click to Purchases Skill Development Missions Dashboard in Excel
Course Name Analysis: Which Courses Deliver the Best Results?
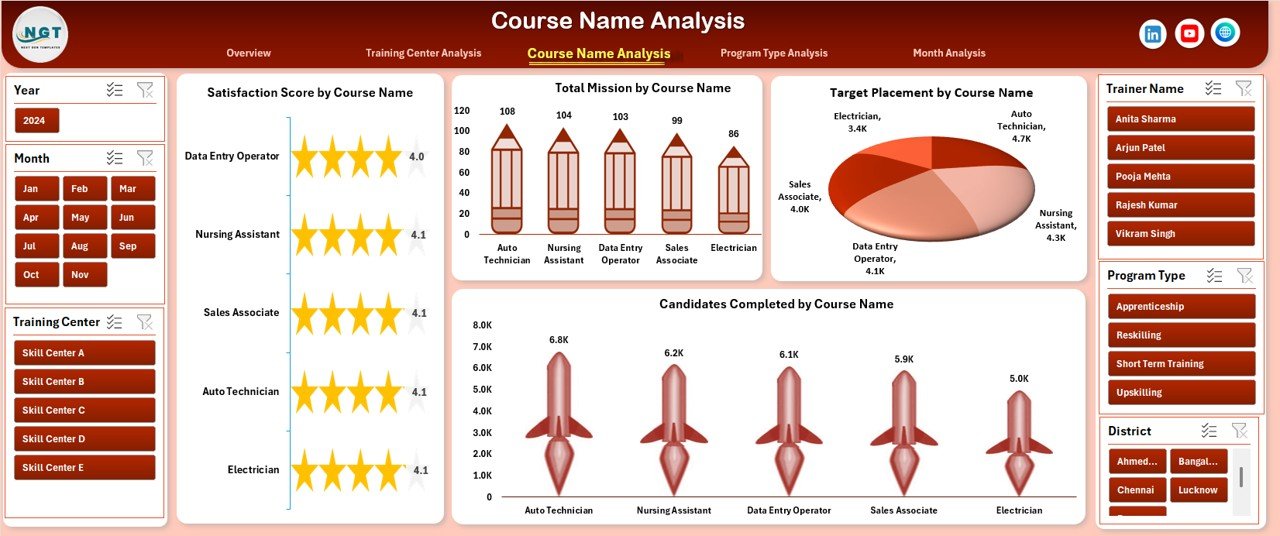
Different courses produce different outcomes. Some programs attract more candidates, while others generate higher placement success.
The Course Name Analysis Page provides course-level insights.
Charts Available
-
Satisfaction Score by Course Name
-
Total Mission by Course Name
-
Target Placement by Course Name
-
Candidates Completed by Course Name
Key Benefits of Course Analysis
-
Evaluate course popularity
-
Measure completion success
-
Align training programs with industry demand
-
Improve curriculum planning
Therefore, organizations can invest more in high-impact courses.
Program Type Analysis: Which Training Programs Work Best?
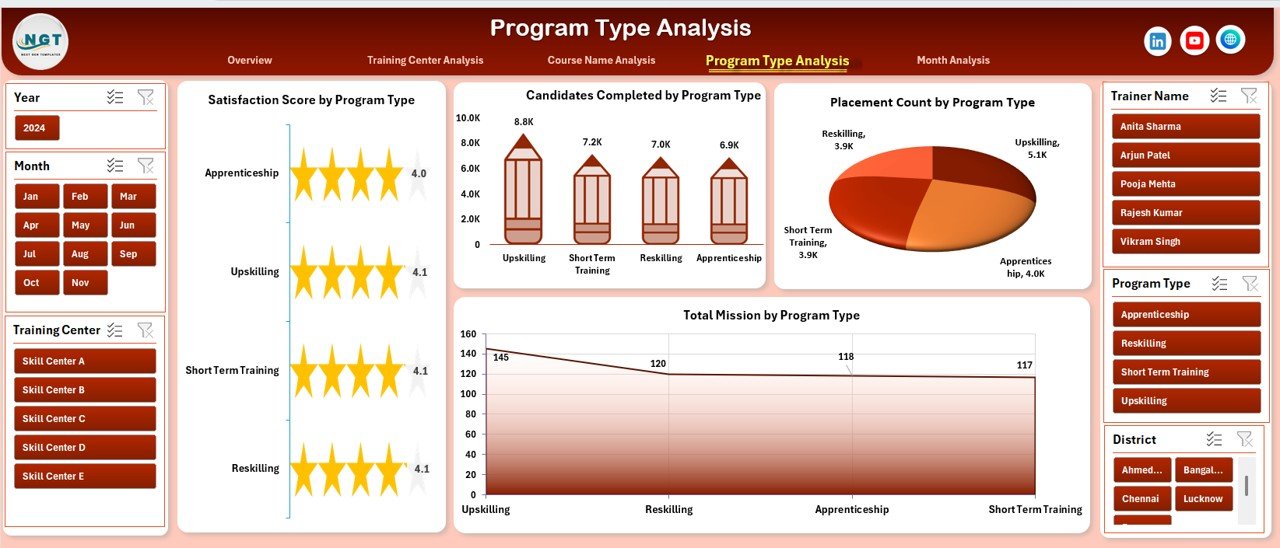
Skill missions often include multiple program types such as short-term training, certification programs, or specialized industry programs.
The Program Type Analysis Page compares program performance.
Charts Included
-
Satisfaction Score by Program Type
-
Total Mission by Program Type
-
Candidates Completed by Program Type
-
Placement Count by Program Type
Insights Generated
Click to Purchases Skill Development Missions Dashboard in Excel
-
Which program type produces higher placements
-
Program engagement comparison
-
Completion efficiency analysis
-
Satisfaction performance evaluation
Hence, policymakers can refine training strategies based on measurable outcomes.
Month Analysis: How Does Performance Change Over Time?
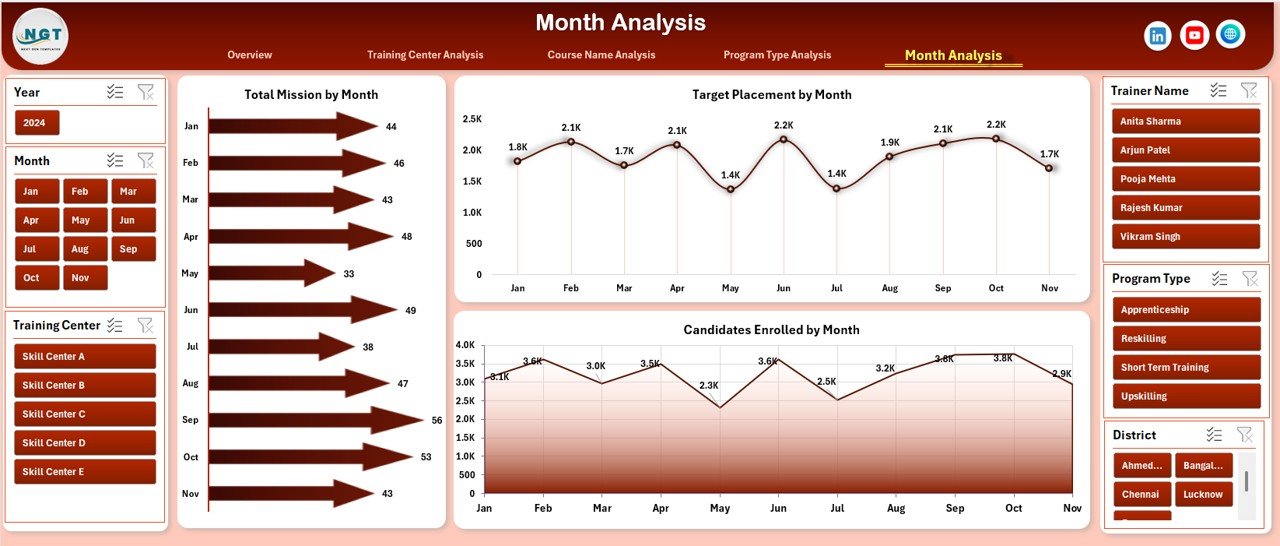
Tracking monthly progress helps organizations understand growth patterns and seasonal trends.
The Month Analysis Page includes:
-
Total Mission by Month
-
Candidates Enrolled by Month
-
Target Placed by Month
Why Monthly Analysis Is Important
-
Monitor mission expansion
-
Identify enrollment trends
-
Track placement progress
-
Evaluate program consistency
Consequently, teams can adjust strategies proactively.
How Does the Skill Development Missions Dashboard Work?
The dashboard operates using structured Excel data tables and Pivot Charts.
Step-by-Step Workflow
-
Enter mission data into the data sheet.
-
Update candidate and training information.
-
Refresh Pivot Tables.
-
Dashboard visuals update automatically.
-
Apply slicers to filter results instantly.
Because Excel automates calculations, users save significant reporting time.
Advantages of Skill Development Missions Dashboard in Excel
Organizations gain multiple operational and strategic benefits when they implement this dashboard.
✅ Centralized Data Management
All mission information stays in one file, which reduces confusion and improves accessibility.
✅ Real-Time Performance Monitoring
Users instantly view updated results after data refresh.
✅ Improved Decision Making
Visual insights help leaders make faster and smarter decisions.
✅ Easy to Use
Excel requires minimal technical knowledge, so teams adopt it quickly.
✅ Cost-Effective Solution
Organizations avoid expensive analytics software.
✅ Better Accountability
Performance tracking encourages responsibility across training centers and trainers.
✅ Data-Driven Planning
Historical analysis supports better future mission planning.
Best Practices for the Skill Development Missions Dashboard
Click to Purchases Skill Development Missions Dashboard in Excel
To achieve maximum value, organizations should follow proven implementation practices.
1. Maintain Clean Data
Always use consistent formats for dates, names, and categories.
2. Update Data Regularly
Frequent updates ensure accurate insights.
3. Use Standardized Naming
Keep course names and program types uniform to avoid reporting errors.
4. Monitor KPIs Monthly
Regular reviews help detect issues early.
5. Train Users Properly
Provide basic Excel training to dashboard users.
6. Validate Data Before Reporting
Check entries to prevent incorrect analysis.
7. Use Filters Strategically
Apply slicers to compare regions, trainers, or courses effectively.
Who Can Benefit from This Dashboard?
Many organizations involved in skill development programs can use this solution.
Ideal Users Include:
-
Government skill development departments
-
Training institutes
-
NGOs and development agencies
-
Educational institutions
-
Workforce development programs
-
CSR training initiatives
-
Employment mission coordinators
Therefore, any organization managing training programs can improve efficiency using this dashboard.
How Does Excel Improve Skill Development Analytics?
Excel remains one of the most powerful analytical tools because it combines flexibility with simplicity.
Key Excel Capabilities Used
-
Pivot Tables for aggregation
-
Pivot Charts for visualization
-
Slicers for interactive filtering
-
Automated calculations
-
Dynamic dashboards
As a result, users gain enterprise-level analytics without complex systems.
Common Mistakes to Avoid While Using Training Dashboards
Click to Purchases Skill Development Missions Dashboard in Excel
Even powerful dashboards require proper usage. Therefore, organizations should avoid common errors.
-
Entering incomplete data
-
Ignoring data validation
-
Overloading dashboards with unnecessary metrics
-
Failing to refresh Pivot Tables
-
Not reviewing insights regularly
Avoiding these mistakes ensures reliable reporting.
Future Scope of Skill Development Analytics
Skill development programs continue evolving with digital transformation. Consequently, dashboards will become even more important.
Future enhancements may include:
-
AI-driven performance predictions
-
Automated placement tracking
-
Cloud-based collaboration
-
Integration with LMS systems
-
Real-time mobile dashboards
Thus, Excel dashboards serve as the foundation for advanced analytics adoption.
Conclusion: Why Every Skill Mission Needs an Excel Dashboard
Skill development initiatives directly impact employment, economic growth, and social development. However, managing large training ecosystems without structured analytics leads to inefficiencies.
The Skill Development Missions Dashboard in Excel provides a practical, affordable, and powerful solution. It centralizes data, automates reporting, and delivers actionable insights through interactive visualizations.
Because the dashboard analyzes training centers, courses, programs, and monthly performance together, organizations gain complete operational visibility. Moreover, decision-makers can improve placements, optimize resources, and enhance training quality using data-backed strategies.
Ultimately, this dashboard transforms mission management from manual reporting into intelligent performance monitoring.
Frequently Asked Questions (FAQs)
What is a Skill Development Missions Dashboard in Excel?
It is an analytical Excel tool that tracks training programs, candidates, placements, and mission performance using interactive charts and KPIs.
Who should use this dashboard?
Government agencies, training institutions, NGOs, and organizations managing skill training programs can use it effectively.
Do users need advanced Excel skills?
No. Basic Excel knowledge is enough because the dashboard works using automated Pivot Tables and slicers.
Can the dashboard handle large datasets?
Yes. Excel supports large structured datasets and updates analysis automatically after refresh.
How often should data be updated?
Organizations should update data weekly or monthly depending on mission activity.
Can the dashboard be customized?
Yes. Users can add new KPIs, charts, or filters according to organizational requirements.
Does the dashboard support decision-making?
Absolutely. Visual analytics help leaders identify trends, measure performance, and make informed decisions quickly.
Visit our YouTube channel to learn step-by-step video tutorials