A Smart Cities Development Dashboard in Power BI is a centralized, interactive reporting tool that helps governments, urban planners, and city administrators monitor, analyze, and manage smart city initiatives using real-time data. Instead of working with disconnected reports, emails, and spreadsheets, this dashboard brings all critical urban development metrics into one structured and visual platform.
Smart cities rely on technology, data, and innovation to improve infrastructure, sustainability, mobility, safety, and quality of life. Therefore, decision-makers need clear visibility into capital expenditure (Capex), operational budgets (OpEx), funding sources, project priorities, city-wise performance, and zone-wise allocation. A Power BI dashboard makes this process simple, fast, and reliable.
Because Power BI supports interactive visuals, slicers, and drill-downs, users can easily analyze data by city, zone, funding source, and time period. As a result, leaders can make informed decisions, control costs, and prioritize projects more effectively.
Click to Purchases Smart Cities Development Dashboard in Power BI
Why Do Smart Cities Need a Development Dashboard?
Smart city projects involve multiple stakeholders, large budgets, and long timelines. However, without proper tracking, even well-planned initiatives face delays, cost overruns, and misaligned priorities. Therefore, a Smart Cities Development Dashboard plays a crucial role.
Key Reasons Smart Cities Need This Dashboard
-
First, it provides real-time visibility into Capex and OpEx spending
-
Second, it improves budget control and transparency
-
Third, it helps monitor high-priority projects across cities and zones
-
Moreover, it supports data-driven planning and policy decisions
-
Finally, it reduces dependency on manual reporting and static presentations
Because smart city programs often span years, consistent performance tracking becomes essential. This dashboard ensures that planners and leaders always stay aligned with strategic goals.
How Does a Smart Cities Development Dashboard in Power BI Work?
A Smart Cities Development Dashboard in Power BI works by connecting structured data sources—such as Excel files, databases, or cloud systems—and transforming them into interactive visuals. After data modeling, Power BI applies calculations, aggregations, and filters to present meaningful insights.
Typical Data Captured in the Dashboard
-
City name
-
Zone or planning area
-
Funding source
-
Project type
-
Capex budget
-
Capex spend
-
Annual OpEx budget
-
Project priority (High / Medium / Low)
-
Monthly and yearly timelines
Once the data loads, Power BI automatically updates visuals when users apply slicers. Therefore, users can instantly analyze performance across multiple dimensions without rebuilding reports.
What Are the Key Features of the Smart Cities Development Dashboard in Power BI?
This Smart Cities Development Dashboard includes 5 well-structured pages, each designed to answer specific planning and financial questions. Let us explore each page in detail.
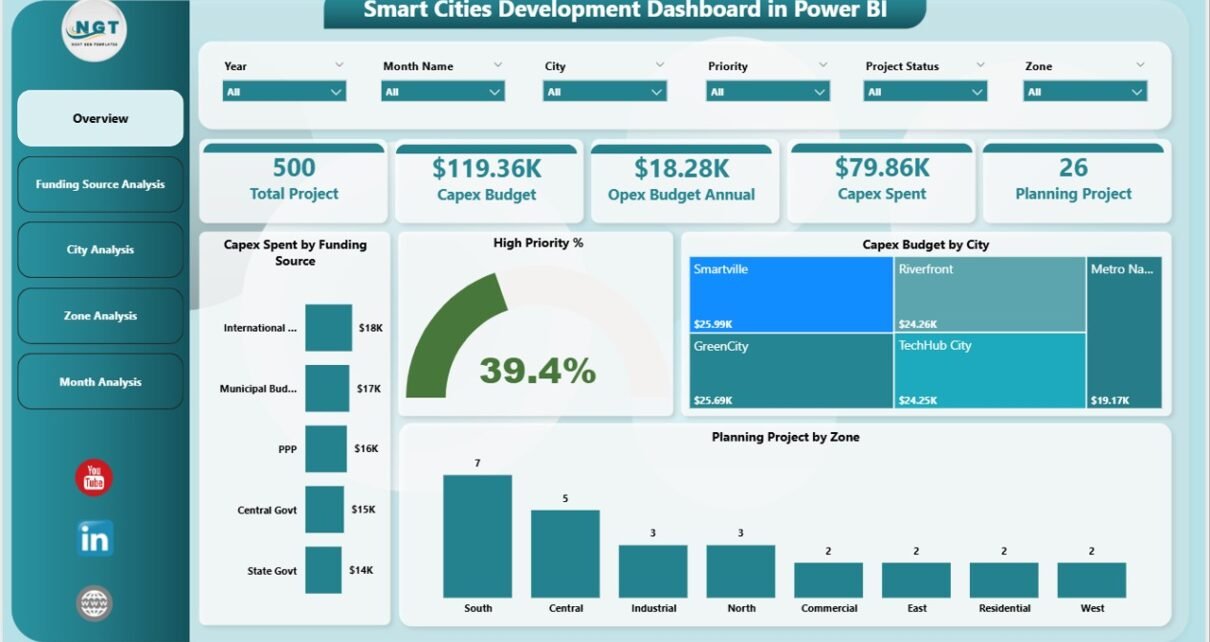
1. Overview Page: What Does the Overall Smart City Performance Look Like?
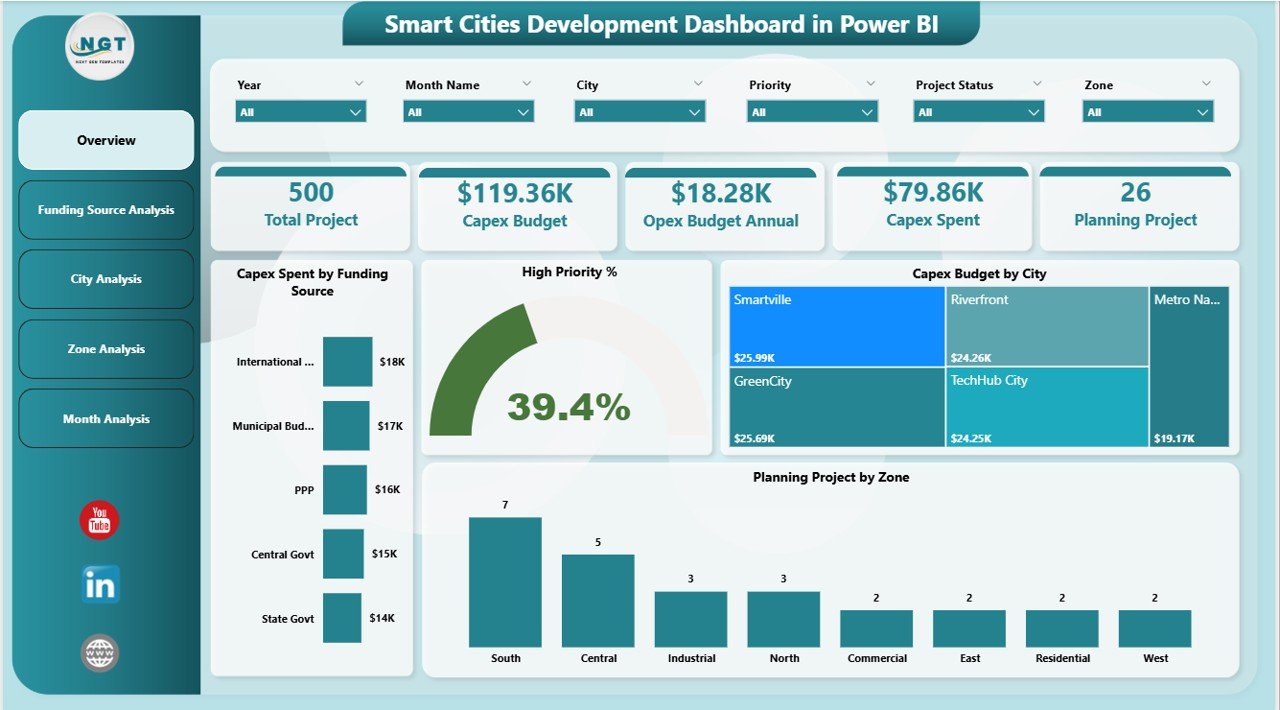
The Overview Page serves as the main landing page of the dashboard. It provides a high-level snapshot of smart city development performance across all cities and zones.
Key Elements of the Overview Page
Slicers
-
City
-
Zone
-
Funding Source
-
Time period (Month / Year)
KPI Cards
-
Total Capex Spend
-
Total Capex Budget
-
High Priority Project %
-
Total Projects Count
Charts on the Overview Page
-
Capex Spend by Funding Source
-
High Priority %
-
Capex Budget by City
-
Planning Project by Zone
Why Is the Overview Page Important?
Because decision-makers often need quick answers, this page delivers instant clarity. Moreover, it helps leadership identify funding gaps, high-priority focus areas, and regional imbalances within seconds.
2. Funding Source Analysis: How Are Different Funding Sources Performing?
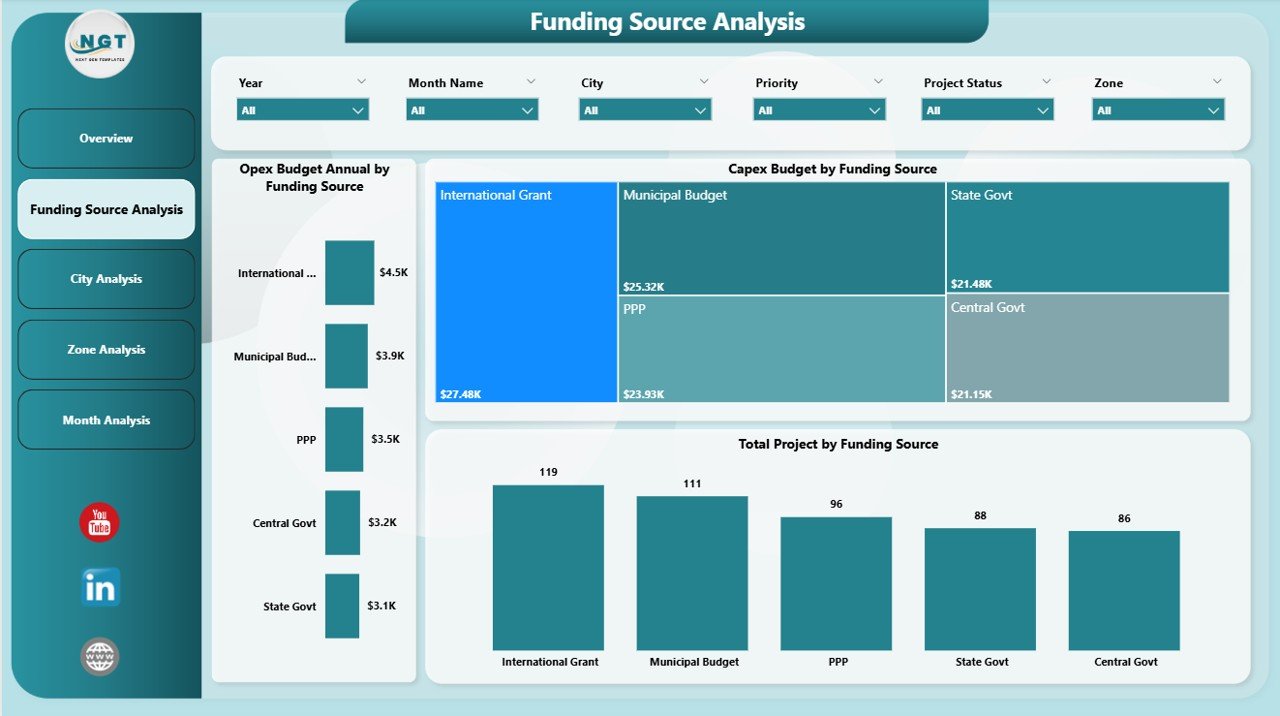
The Funding Source Analysis Page focuses on understanding how various funding sources contribute to smart city development.
Key Charts on the Funding Source Analysis Page
-
Annual OpEx Budget by Funding Source
-
Capex Budget by Funding Source
-
Total Projects by Funding Source
Insights This Page Delivers
-
Which funding source contributes the most to smart city projects
-
How Capex budgets differ across funding sources
-
Whether OpEx allocation aligns with long-term sustainability
-
How many projects each funding source supports
As a result, finance teams and policymakers can optimize funding strategies and reduce dependency on limited sources.
3. City Analysis: How Is Each City Performing in Smart City Development?
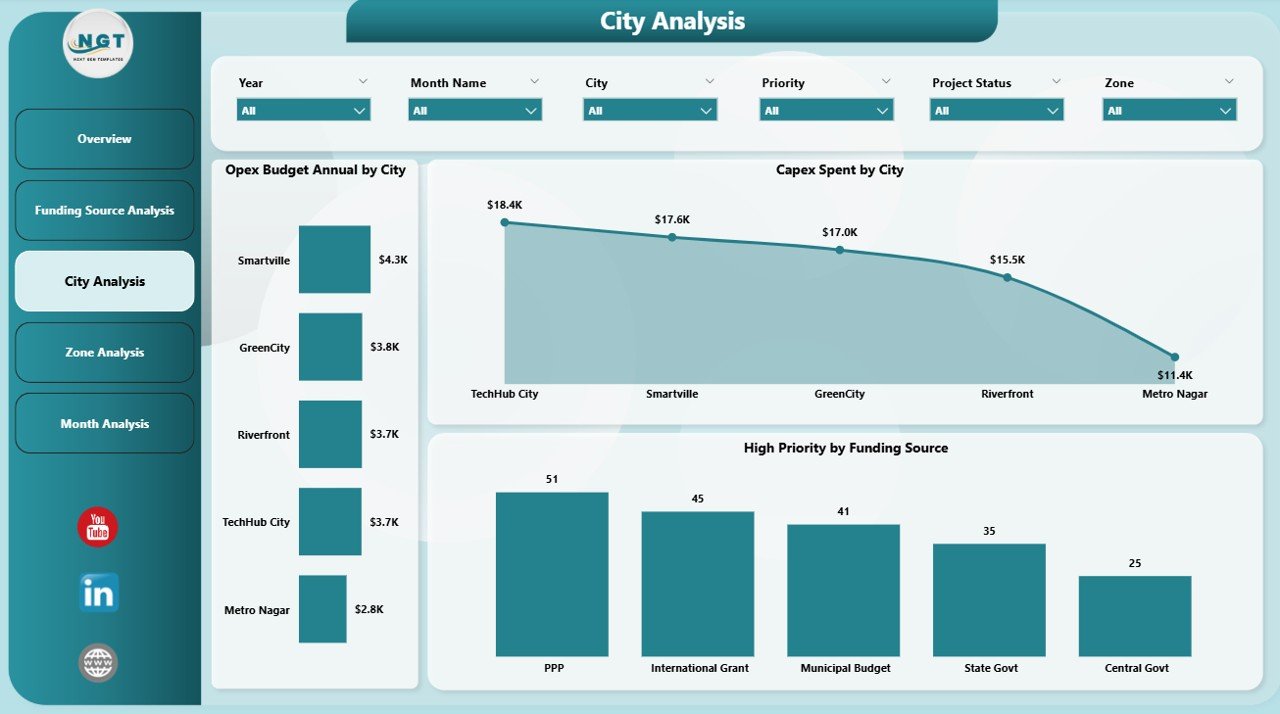
The City Analysis Page allows users to compare smart city investments and priorities across different cities.
Click to Purchases Smart Cities Development Dashboard in Power BI
Key Charts on the City Analysis Page
-
Annual OpEx Budget by City
-
Capex Budget by City
-
High Priority Projects by City
Why City-Wise Analysis Matters
Every city has unique infrastructure needs and population demands. Therefore, this page helps planners:
-
Identify cities with under-funded projects
-
Compare Capex and OpEx balance across cities
-
Track high-priority project distribution
Consequently, governments can ensure fair resource allocation and balanced urban growth.
4. Zone Analysis: How Are Urban Zones Utilizing Budgets?
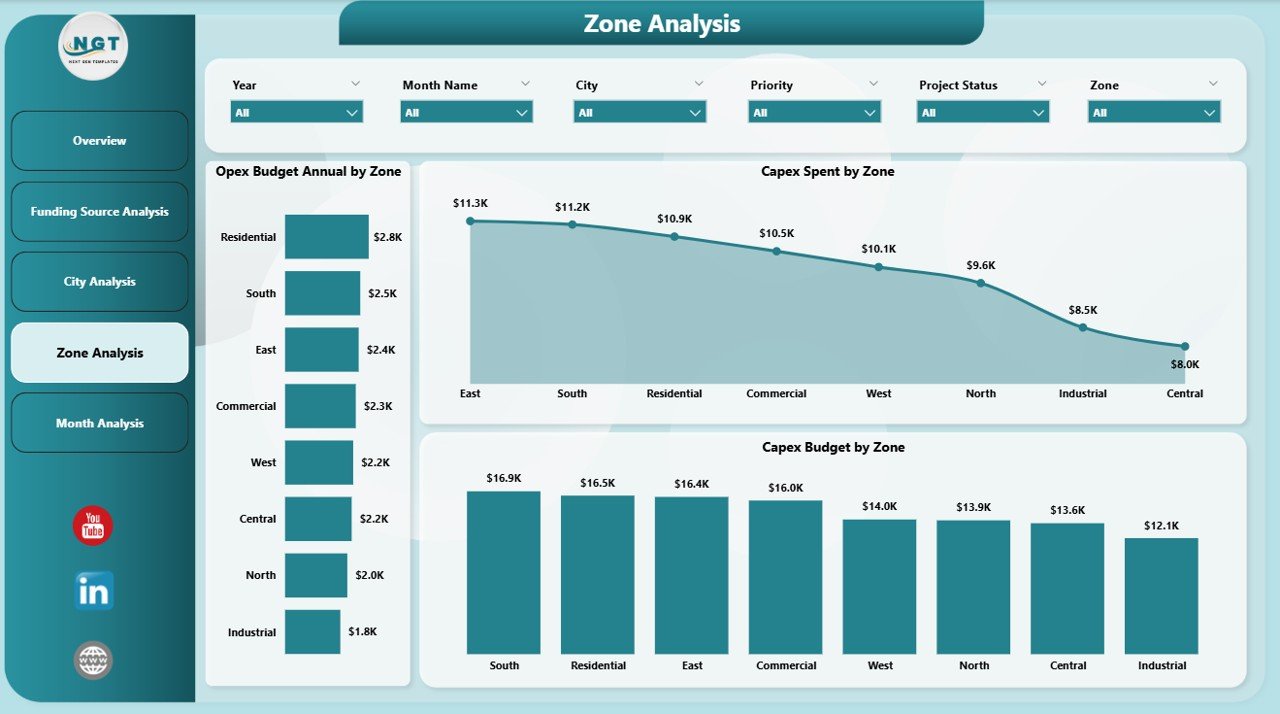
The Zone Analysis Page breaks down smart city development data by zones or planning areas within cities.
Key Charts on the Zone Analysis Page
-
Annual OpEx Budget by Zone
-
Capex Spend by Zone
-
Capex Budget by Zone
Value of Zone-Level Insights
Urban zones often differ in population density, infrastructure maturity, and development urgency. Therefore, zone-level analysis helps:
-
Detect overspending or underutilization
-
Identify zones requiring urgent investment
-
Improve micro-level planning decisions
Because smart cities demand precision, this page ensures granular control over urban development.
5. Monthly Trends: How Are Budgets and Spending Changing Over Time?
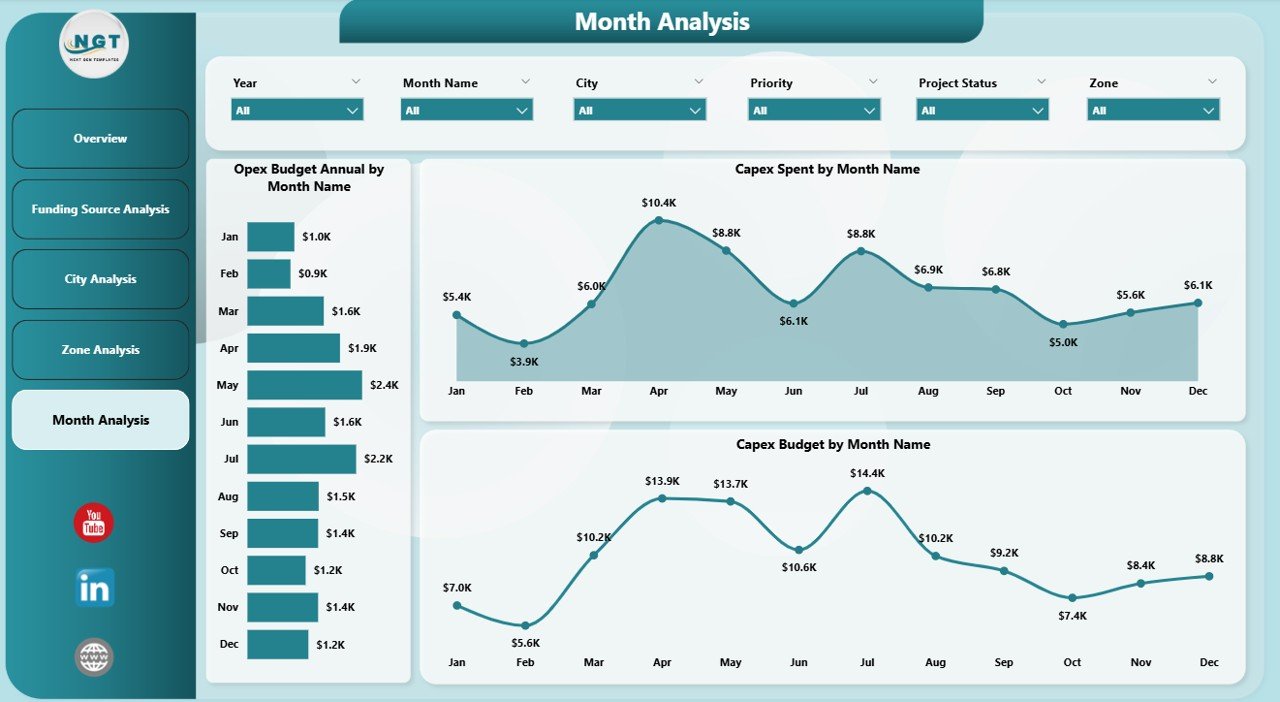
The Monthly Trends Page focuses on time-based analysis to identify spending patterns and budget utilization trends.
Key Charts on the Monthly Trends Page
-
Annual OpEx Budget by Month
-
Capex Spend by Month
-
Capex Budget by Month
Why Trend Analysis Is Essential
Trend analysis helps planners:
-
Identify seasonal spending patterns
-
Detect budget delays or acceleration
-
Forecast future funding requirements
As a result, teams can proactively adjust plans instead of reacting to issues later.
Advantages of Smart Cities Development Dashboard in Power BI
Click to Purchases Smart Cities Development Dashboard in Power BI
Using a Smart Cities Development Dashboard in Power BI offers several practical advantages for governments and urban planners.
Key Advantages
-
✔ Centralized view of all smart city projects
-
✔ Improved transparency and accountability
-
✔ Faster and better decision-making
-
✔ Real-time monitoring of Capex and OpEx
-
✔ Easy comparison across cities, zones, and funding sources
-
✔ Reduced manual reporting effort
-
✔ Scalable solution for future expansion
Because Power BI supports automation, teams can focus more on planning and less on reporting.
Who Can Benefit from a Smart Cities Development Dashboard?
This dashboard serves a wide range of stakeholders involved in urban development.
Primary Users
-
Government authorities
-
Urban planners
-
Smart city mission teams
-
Finance and budget departments
-
Infrastructure development agencies
-
Policy makers
-
Data analysts and consultants
Each user group gains tailored insights without needing technical expertise.
Best Practices for the Smart Cities Development Dashboard in Power BI
To get maximum value from the dashboard, organizations should follow these best practices.
1. Use Clean and Standardized Data
Always maintain consistent city names, zones, and funding categories. Clean data improves accuracy and trust.
2. Define Clear KPIs
Focus on meaningful KPIs such as Capex utilization %, High Priority %, and Budget variance.
3. Update Data Regularly
Frequent data updates ensure that leaders work with the latest information.
4. Use Slicers Strategically
Limit slicers to essential fields so users do not feel overwhelmed.
5. Train End Users
Provide basic training so stakeholders can explore insights confidently.
6. Monitor Performance Periodically
Review dashboard usage and refine visuals based on feedback.
Challenges in Smart City Development and How This Dashboard Helps
Smart city initiatives face several challenges. However, this dashboard helps overcome many of them.
Common Challenges
-
Budget overruns
-
Lack of visibility
-
Poor coordination between departments
-
Delayed decision-making
How the Dashboard Solves Them
-
Provides real-time financial tracking
-
Improves coordination through shared insights
-
Highlights risks early
-
Supports data-driven governance
How Does Power BI Support Smart City Transformation?
Power BI supports smart city transformation by offering:
-
Interactive dashboards
-
Secure data sharing
-
Scalable architecture
-
Cloud and on-premise integration
-
Advanced analytics capabilities
Therefore, cities can grow smarter without investing in complex systems.
Conclusion: Why Smart Cities Development Dashboard in Power BI Is Essential
A Smart Cities Development Dashboard in Power BI transforms how cities plan, monitor, and execute urban development initiatives. By bringing Capex, OpEx, funding sources, city performance, zone analysis, and monthly trends into one interactive platform, it empowers decision-makers with clarity and confidence.
Moreover, the dashboard improves transparency, reduces inefficiencies, and supports sustainable growth. As smart city initiatives continue to expand, having a structured and scalable reporting solution becomes not just helpful—but essential.
Frequently Asked Questions (FAQs)
What is the main purpose of a Smart Cities Development Dashboard in Power BI?
The main purpose is to track budgets, spending, project priorities, and performance across smart city initiatives using interactive visuals.
Can this dashboard handle multiple cities and zones?
Yes, the dashboard supports city-wise and zone-wise analysis using slicers and filters.
Is Power BI suitable for government and public sector projects?
Yes, Power BI offers strong security, scalability, and transparency, making it ideal for public sector use.
How often should data be updated in the dashboard?
Ideally, data should be updated monthly or weekly, depending on project activity.
Can this dashboard be customized for specific smart city missions?
Yes, users can easily customize KPIs, visuals, and data sources based on mission requirements.
Does this dashboard require advanced technical skills?
No, end users can interact with the dashboard easily, while developers handle initial setup.
Visit our YouTube channel to learn step-by-step video tutorials