The renewable energy industry continues to grow rapidly, and solar parks now play a major role in global electricity production. However, managing solar park operations requires continuous monitoring, accurate reporting, and data-driven decision-making. Without structured performance tracking, operators struggle to identify inefficiencies, control costs, or improve energy output.
Therefore, organizations need a clear and centralized system to monitor operational performance. That is exactly why we created the Solar Parks KPI Dashboard in Excel — a powerful, ready-to-use template designed to track solar park KPIs efficiently in one place.
In this comprehensive guide, you will learn what a Solar Parks KPI Dashboard is, why it matters, which KPIs you should monitor, how the Excel dashboard works, and how organizations can improve solar plant performance using structured analytics.
Click to buy Solar Parks KPI Dashboard in Excel
What Is a Solar Parks KPI Dashboard in Excel?
A Solar Parks KPI Dashboard in Excel is an interactive performance monitoring tool that helps solar park operators track operational, technical, and financial KPIs using a single Excel-based interface.
Instead of reviewing multiple reports or scattered spreadsheets, users monitor all performance indicators from one dashboard. As a result, managers quickly identify issues, compare targets with actual performance, and make faster operational decisions.
The dashboard combines:
- Monthly performance tracking
- MTD (Month-to-Date) analysis
- YTD (Year-to-Date) comparisons
- Target vs Actual monitoring
- Previous Year benchmarking
- Trend analysis visualization
Because Excel remains widely accessible, organizations implement this system instantly without investing in expensive software.
Why Do Solar Parks Need KPI Tracking?
Solar parks operate in a highly performance-sensitive environment. Even small efficiency losses can reduce energy output and revenue significantly. Therefore, continuous KPI tracking becomes essential.
Key Challenges Without KPI Monitoring
- Energy production fluctuations remain unnoticed
- Equipment inefficiencies increase downtime
- Maintenance decisions become reactive instead of proactive
- Performance comparison across months becomes difficult
- Management lacks clear performance visibility
However, a KPI dashboard solves these problems by transforming raw operational data into meaningful insights.
What KPIs Should Solar Parks Track?
Solar parks measure performance through operational, maintenance, financial, and efficiency indicators. Although organizations may customize KPIs, most solar facilities track the following categories:
- Energy Production KPIs
- Total Energy Generated (MWh)
- Daily Energy Output
- Capacity Utilization Factor (CUF)
- Performance Ratio (PR)
- Operational Efficiency KPIs
- Plant Availability
- Inverter Efficiency
- Grid Availability
- System Loss Percentage
- Maintenance KPIs
- Downtime Hours
- Preventive Maintenance Compliance
- Fault Resolution Time
- Equipment Failure Rate
- Financial KPIs
- Revenue per MW
- Cost per Unit Generated
- O&M Cost Ratio
- ROI Performance
Because these KPIs connect operational performance with financial outcomes, managers gain complete visibility into plant health.
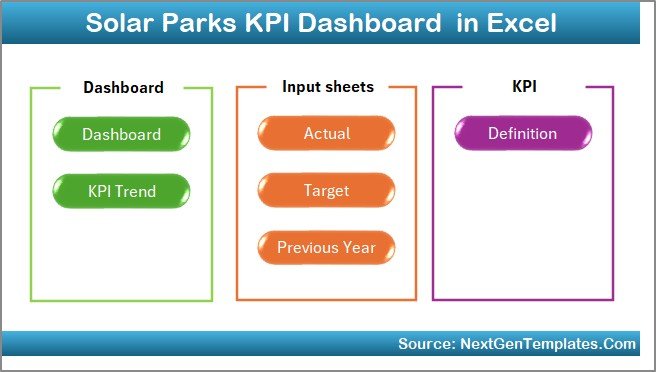
Overview of the Solar Parks KPI Dashboard Structure
The Solar Parks KPI Dashboard in Excel includes 7 well-structured worksheets. Each sheet performs a specific role, which ensures organized data flow and easy navigation.
Let us explore each worksheet in detail.
Summary Page — Central Navigation Hub
The Summary Page works as the dashboard index.
Key Features
- Provides quick navigation buttons
- Allows users to jump directly to required sheets
- Improves usability and workflow efficiency
Instead of searching manually across sheets, users move between sections instantly.
Therefore, even non-technical users operate the dashboard easily.
Click to buy Solar Parks KPI Dashboard in Excel
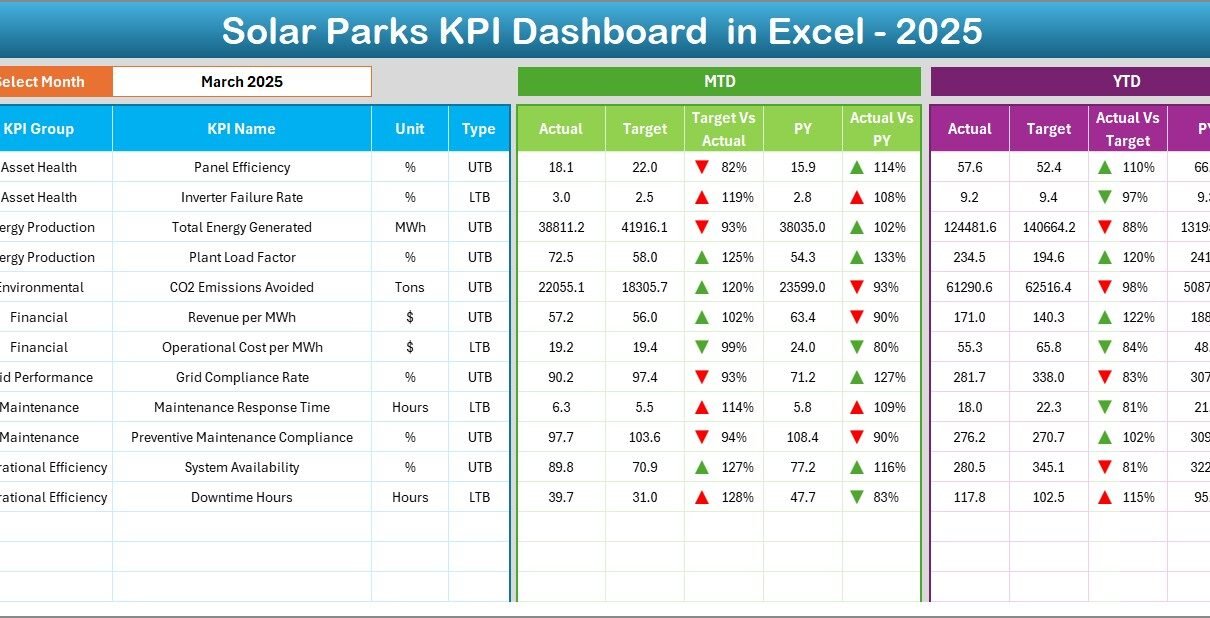
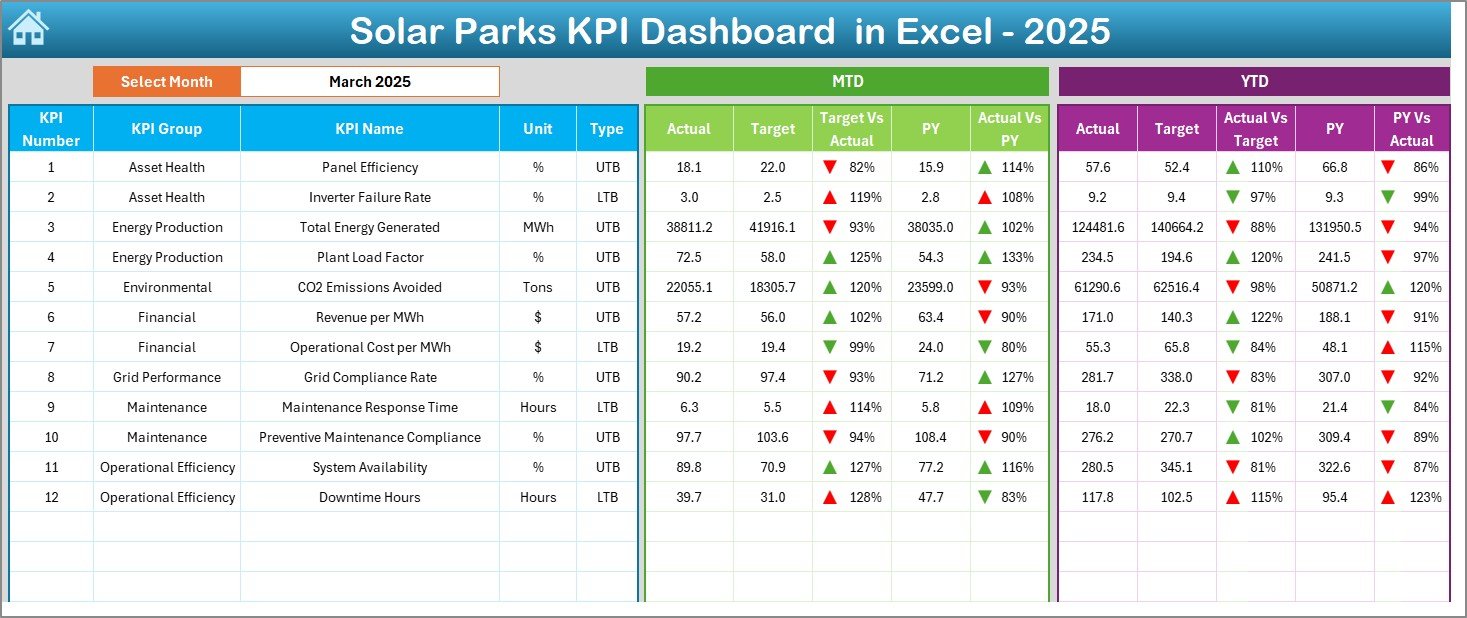
Dashboard Sheet — Main Performance View
The Dashboard Sheet acts as the heart of the entire system.
Here, users view complete KPI performance in one screen.
Interactive Month Selection
- Month selector available in cell D3
- Changing the month automatically updates all metrics
Because of this automation, users analyze performance dynamically without editing formulas.
Metrics Displayed
MTD Analysis
- MTD Actual
- MTD Target
- Previous Year Comparison
- Target vs Actual indicators
- PY vs Actual indicators
YTD Analysis
- YTD Actual
- YTD Target
- Previous Year numbers
- Performance comparison visuals
Visual Indicators
Conditional formatting displays:
Up arrows for positive performance
Down arrows for negative performance
As a result, managers instantly understand performance status without deep analysis.
Click to buy Solar Parks KPI Dashboard in Excel
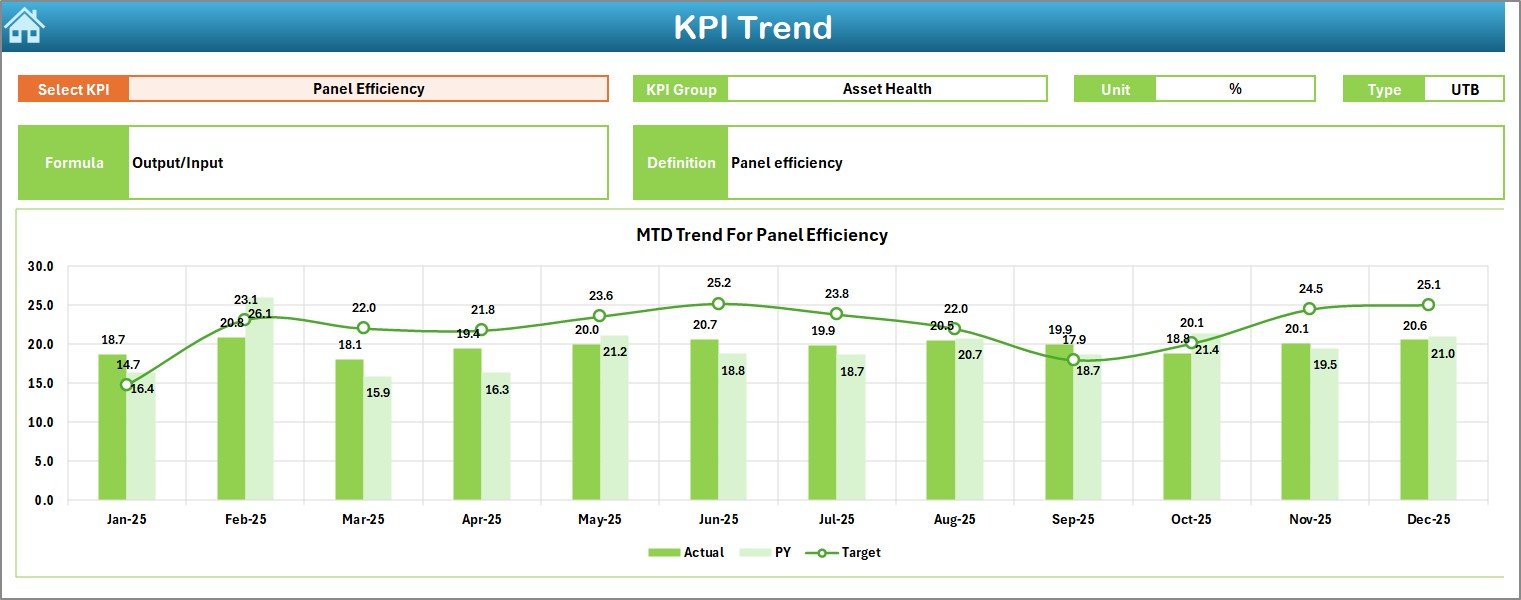
Trend Sheet — KPI Performance Analysis
The Trend Sheet provides deeper analytical insights.
Users select a KPI from the dropdown located at cell C3.
Information Displayed
- KPI Group
- KPI Unit
- KPI Type (Upper the Better / Lower the Better)
- KPI Formula
- KPI Definition
Additionally, the sheet displays trend charts for:
- MTD Actual vs Target vs Previous Year
- YTD Actual vs Target vs Previous Year
Therefore, users analyze performance movement over time instead of reviewing static numbers.
Trend analysis helps identify:
- Seasonal patterns
- Performance improvement areas
- Operational risks
Click to buy Solar Parks KPI Dashboard in Excel
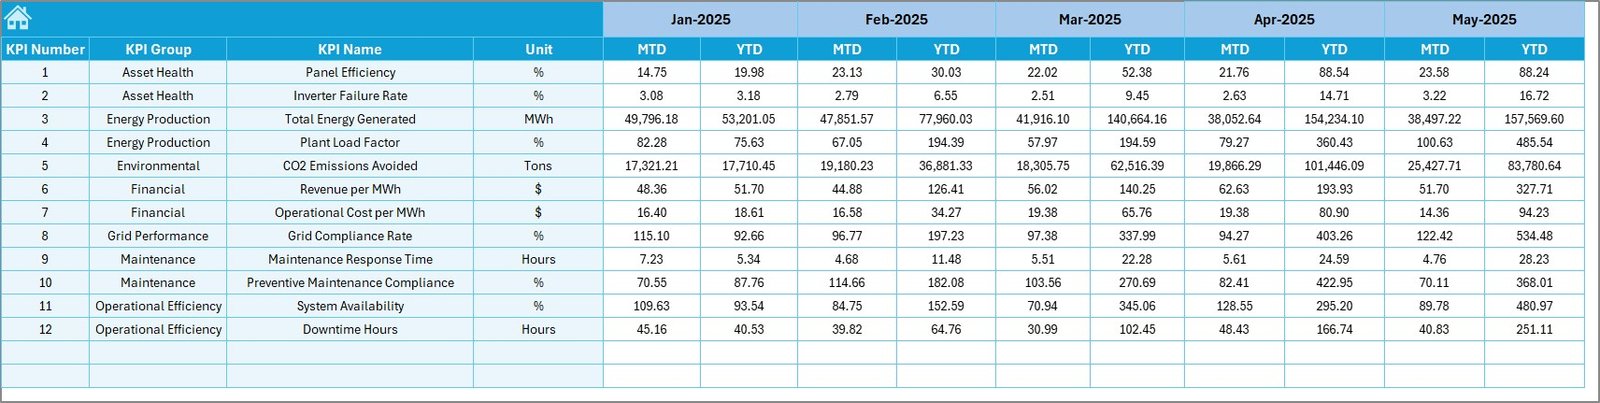
Actual Numbers Input Sheet — Data Entry Area
This sheet allows users to input operational performance data.
How It Works
- Enter MTD and YTD actual values
- Set the starting month in cell E1
- Dashboard updates automatically
Because data entry remains centralized, organizations maintain consistency and accuracy.
Click to buy Solar Parks KPI Dashboard in Excel
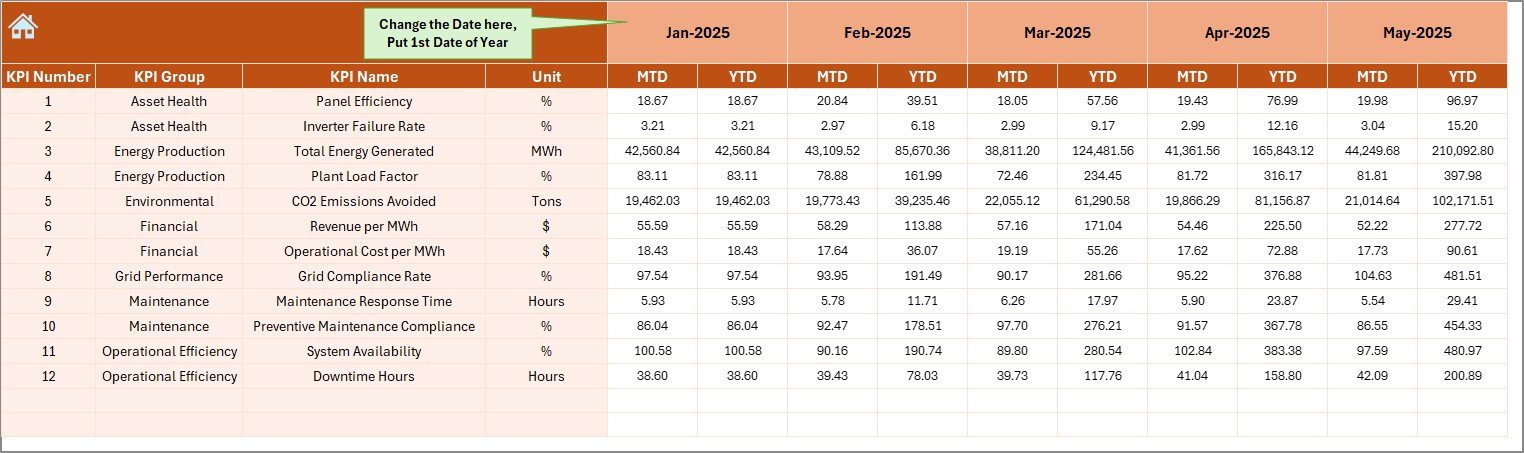
Target Sheet — Goal Planning
The Target Sheet stores planned KPI values.
Users enter:
- Monthly targets
- YTD targets for each KPI
This structure allows performance benchmarking against predefined goals.
Consequently, management evaluates operational success objectively.
Click to buy Solar Parks KPI Dashboard in Excel
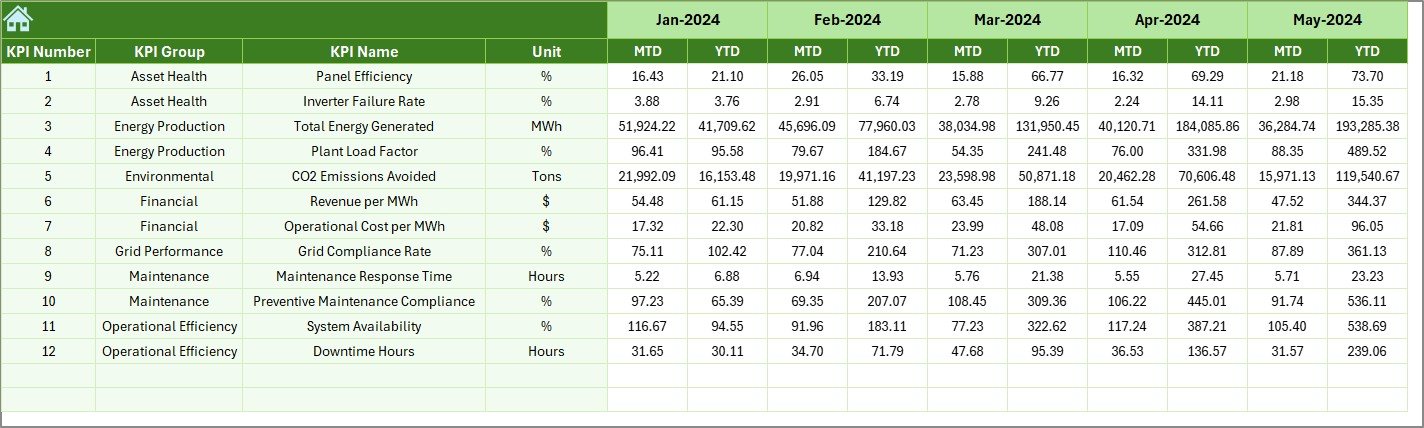
Previous Year Numbers Sheet — Benchmarking Tool
Historical comparison plays a vital role in performance improvement.
In this sheet, users enter previous year data similar to current-year input.
Benefits
- Enables year-over-year comparison
- Identifies growth trends
- Measures operational improvement
Therefore, decision-makers understand whether performance improves or declines.
Click to buy Solar Parks KPI Dashboard in Excel
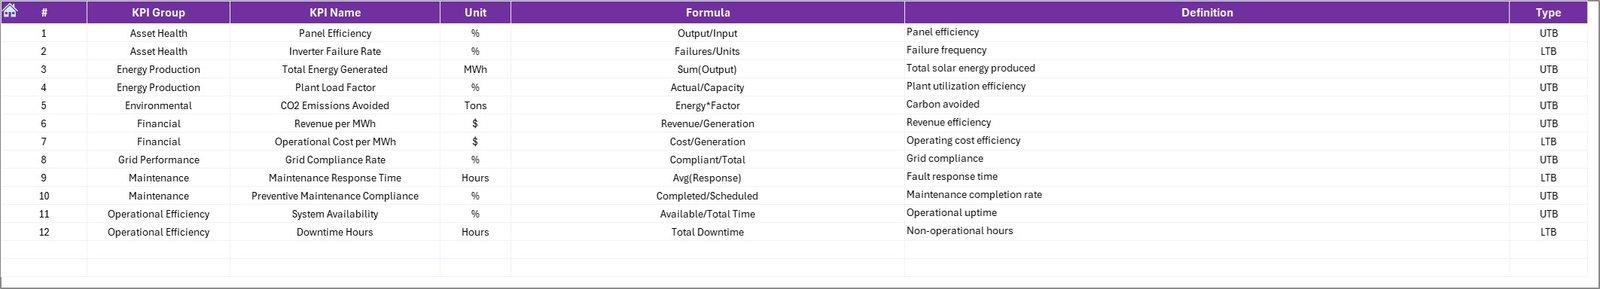
KPI Definition Sheet — KPI Master Database
The KPI Definition Sheet acts as the central reference table.
Users define:
- KPI Name
- KPI Group
- Unit of Measurement
- Formula
- KPI Definition
Because all KPIs remain documented, organizations maintain data clarity and standardization.
Click to buy Solar Parks KPI Dashboard in Excel
How Does the Solar Parks KPI Dashboard Improve Decision-Making?
A well-designed dashboard does more than display numbers. It transforms data into action.
Real-Time Insights
Managers monitor plant performance instantly.
Faster Problem Detection
Performance deviations become visible immediately.
Data-Driven Planning
Operational strategies rely on measurable KPIs rather than assumptions.
Improved Accountability
Teams clearly understand performance expectations.
As a result, organizations improve efficiency and profitability simultaneously.
Advantages of Solar Parks KPI Dashboard in Excel
Using a Solar Parks KPI Dashboard offers several operational and strategic advantages.
Centralized Performance Monitoring
All KPIs remain available in one dashboard, which eliminates scattered reporting.
Easy to Use
Excel familiarity reduces training requirements.
Automated Analysis
Dropdown selections automatically refresh reports.
Visual Performance Indicators
Conditional formatting simplifies interpretation.
Historical Comparison
Previous year benchmarking supports strategic planning.
Cost-Effective Solution
Organizations avoid expensive analytics software.
Better Operational Control
Managers identify inefficiencies quickly and take corrective action.
How to Use the Solar Parks KPI Dashboard Step-by-Step?
Follow these steps to start using the dashboard efficiently.
Step 1: Define KPIs
Enter KPI details in the KPI Definition Sheet.
Step 2: Enter Targets
Add monthly and yearly targets in the Target Sheet.
Step 3: Input Previous Year Data
Fill historical performance numbers.
Step 4: Enter Actual Data
Update MTD and YTD actual numbers.
Step 5: Select Month
Choose the month from the dashboard dropdown.
Step 6: Analyze Trends
Review performance patterns in the Trend Sheet.
By following this workflow, users maintain accurate performance tracking.
Best Practices for the Solar Parks KPI Dashboard in Excel
Organizations achieve the best results when they follow structured dashboard practices.
Maintain Data Accuracy
Always verify data before entry.
Update Data Regularly
Update KPIs monthly to ensure reliable analysis.
Set Realistic Targets
Use historical data when defining goals.
Review Trends Frequently
Analyze trends instead of focusing only on current results.
Standardize KPI Definitions
Keep formulas consistent across teams.
Assign Responsibilities
Allocate KPI ownership to specific team members.
Focus on Actionable KPIs
Track metrics that directly influence operational outcomes.
Who Can Benefit from This Dashboard?
The Solar Parks KPI Dashboard serves multiple roles.
Solar Park Operators
Monitor energy production efficiency.
Renewable Energy Companies
Track multiple plant performance.
Operations Managers
Improve maintenance planning.
Financial Analysts
Evaluate profitability metrics.
Energy Consultants
Provide performance advisory services.
Because the dashboard remains flexible, different stakeholders use it effectively.
Why Use Excel Instead of Specialized Software?
Many organizations wonder why Excel still works well for KPI dashboards.
Key Reasons
- No subscription cost
- Easy customization
- Offline accessibility
- Quick deployment
- Universal compatibility
Therefore, Excel remains a practical analytics platform for operational dashboards.
Future Scope of KPI Dashboards in Solar Energy
As renewable energy grows, performance analytics will become even more critical.
Future dashboards may include:
- IoT integration
- Real-time SCADA data feeds
- Predictive maintenance analytics
- AI-based forecasting
- Automated alerts
However, Excel dashboards still provide an excellent foundation for structured performance management.
Conclusion
The Solar Parks KPI Dashboard in Excel provides a powerful yet simple solution for monitoring solar plant performance. Instead of relying on fragmented reports, organizations gain a centralized system that tracks Actual vs Target performance, analyzes trends, and compares historical results.
Moreover, the dashboard improves decision-making, enhances operational transparency, and supports continuous performance improvement.
Because it combines automation, visualization, and structured KPI management, this template helps solar park operators maximize efficiency and profitability while maintaining full control over performance metrics.
Ultimately, organizations that monitor KPIs consistently achieve better energy output, reduced downtime, and stronger financial results.
Frequently Asked Questions (FAQs)
- What is a Solar Parks KPI Dashboard?
A Solar Parks KPI Dashboard is an Excel-based tool that tracks and analyzes solar plant performance using key performance indicators.
- Can beginners use this dashboard?
Yes. The dashboard uses dropdown selections and structured sheets, so beginners can use it easily.
- What data do I need to start?
You need KPI definitions, targets, actual performance numbers, and previous year data.
- How often should I update the dashboard?
You should update KPI data monthly for accurate analysis.
- Can I customize KPIs?
Yes. You can modify KPI definitions according to plant requirements.
- Does the dashboard support trend analysis?
Yes. The Trend Sheet provides MTD and YTD performance charts.
- Is Excel suitable for renewable energy analytics?
Yes. Excel provides flexibility, automation, and visualization suitable for operational KPI tracking.
Visit our YouTube channel to learn step-by-step video tutorials
Watch the step-by-step video tutorial: