Space technology organizations operate in one of the most complex and data-intensive environments in the world. From satellite launches and mission success rates to R&D efficiency and system reliability, every decision depends on accurate and timely performance data. However, when KPI data remains scattered across spreadsheets, reports, and systems, teams struggle to gain clarity.
That is exactly where a Space Technology KPI Dashboard in Excel becomes a powerful solution.
In this detailed guide, you will learn what a Space Technology KPI Dashboard in Excel is, how it works, why space organizations need it, and how each worksheet supports better performance monitoring. Moreover, this article explains the advantages, best practices, and common questions related to this dashboard in a clear and practical way.
Click to buy Space Technology KPI Dashboard in Excel
What Is a Space Technology KPI Dashboard in Excel?
A Space Technology KPI Dashboard in Excel is a ready-to-use performance tracking template designed to monitor, analyze, and visualize key performance indicators related to space missions, satellite operations, research programs, and technology development.
Instead of checking multiple reports or raw data tables, decision-makers can view all critical KPIs in one centralized dashboard. As a result, teams gain faster insights, stronger control, and improved accountability.
Because this dashboard runs entirely in Microsoft Excel, it stays cost-effective, flexible, and easy to customize. At the same time, it delivers structured KPI tracking without the need for complex BI tools.
Why Do Space Technology Organizations Need a KPI Dashboard?
Space programs involve high investments, strict timelines, and zero tolerance for error. Therefore, organizations must track performance continuously and act quickly when risks appear.
A Space Technology KPI Dashboard in Excel helps because:
- It centralizes mission-critical data in one place
- It highlights performance gaps instantly
- It supports data-driven decisions
- It reduces manual reporting effort
- It improves transparency across teams
Moreover, Excel dashboards allow teams to adapt KPIs as missions evolve, which makes them ideal for dynamic space projects.
How Does the Space Technology KPI Dashboard in Excel Work?
This dashboard uses a structured worksheet design where input sheets feed analytical sheets automatically. As you update actuals, targets, or previous-year data, the dashboard refreshes instantly.
Because the logic relies on Excel formulas and conditional formatting, users can track trends without writing code. As a result, even non-technical users can manage performance data confidently.
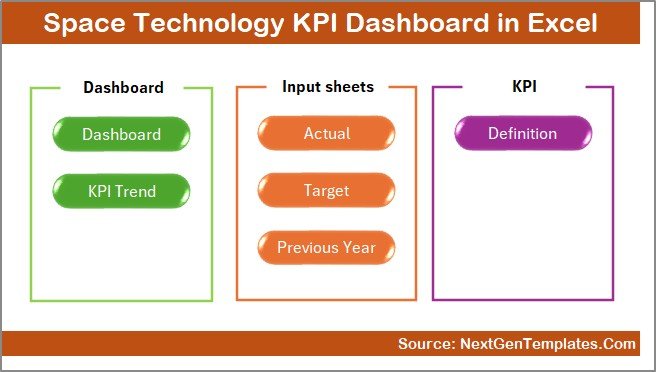
What Are the Key Features of the Space Technology KPI Dashboard in Excel?
This KPI dashboard includes 7 well-structured worksheets, each designed for a specific purpose. Together, they create a complete performance management system.
Summary Page
The Summary Page acts as the index sheet of the dashboard.
Key Highlights of the Summary Page
- Six navigation buttons for quick access
- One-click jump to any analytical sheet
- Clean and user-friendly layout
Because of this page, users do not waste time searching for sheets. Instead, they navigate the dashboard smoothly and efficiently.
Click to buy Space Technology KPI Dashboard in Excel
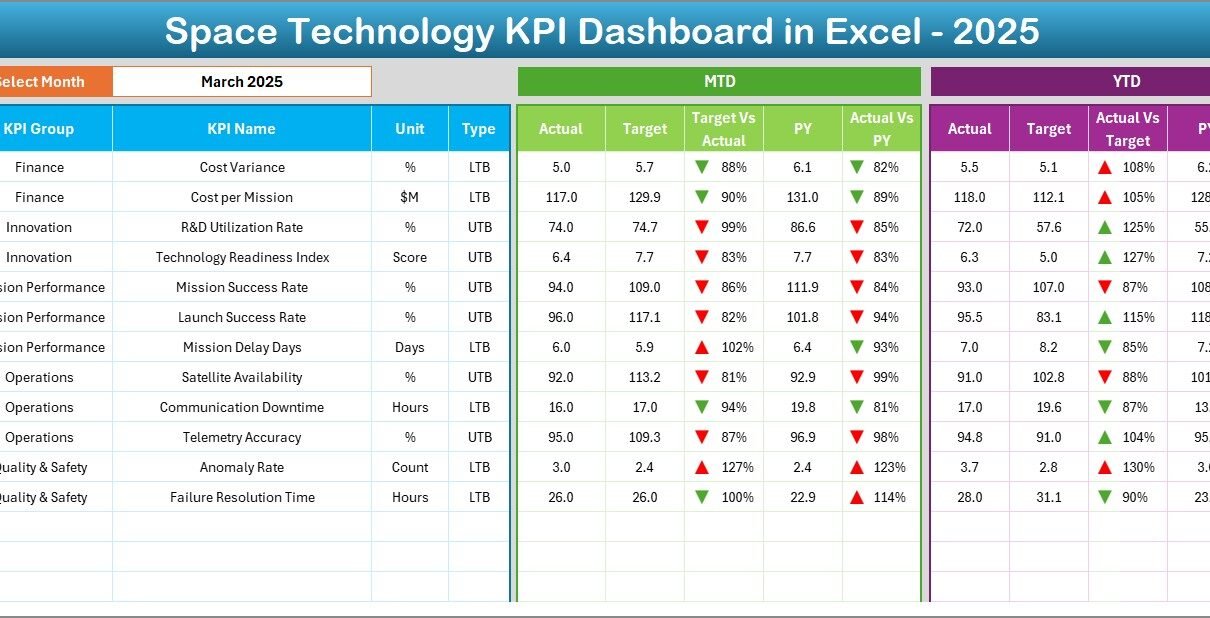
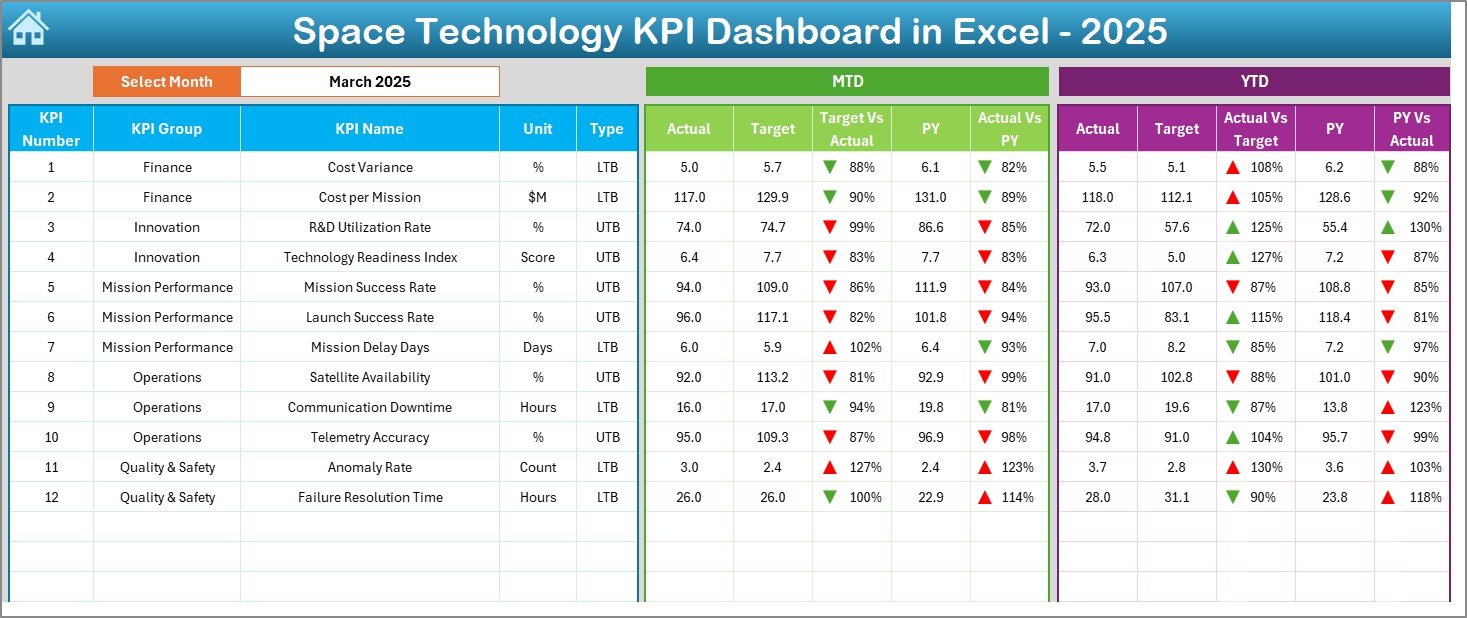
Dashboard Sheet
The Dashboard Sheet serves as the main performance view.
Key Capabilities of the Dashboard Sheet
- Month selection dropdown in cell D3
- Automatic update of all KPIs based on selected month
- Clear visibility of both monthly and yearly performance
KPIs Displayed on the Dashboard
- MTD Actual, Target, and Previous Year
- Target vs Actual variance
- Previous Year vs Actual variance
- YTD Actual, Target, and Previous Year
- YTD Target vs Actual variance
- YTD Previous Year vs Actual variance
Why Conditional Formatting Matters Here
The dashboard uses up and down arrows with conditional formatting. As a result:
- Green arrows show positive performance
- Red arrows highlight negative trends
This visual approach helps leaders identify issues instantly and act faster.
Click to buy Space Technology KPI Dashboard in Excel
Trend Sheet
The Trend Sheet allows users to analyze one KPI at a time in detail.
What Can You Do on the Trend Sheet?
- Select a KPI name from the dropdown in cell C3
- View detailed KPI metadata instantly
- Analyze trends over time visually
KPI Information Displayed
- KPI Group
- Unit of KPI
- KPI Type (Upper the Better or Lower the Better)
- KPI Formula
- KPI Definition
Trend Charts Available
- MTD trend for Actual, Target, and Previous Year
- YTD trend for Actual, Target, and Previous Year
Because of this structure, teams understand not only the numbers but also the meaning behind every KPI.

Click to buy Space Technology KPI Dashboard in Excel
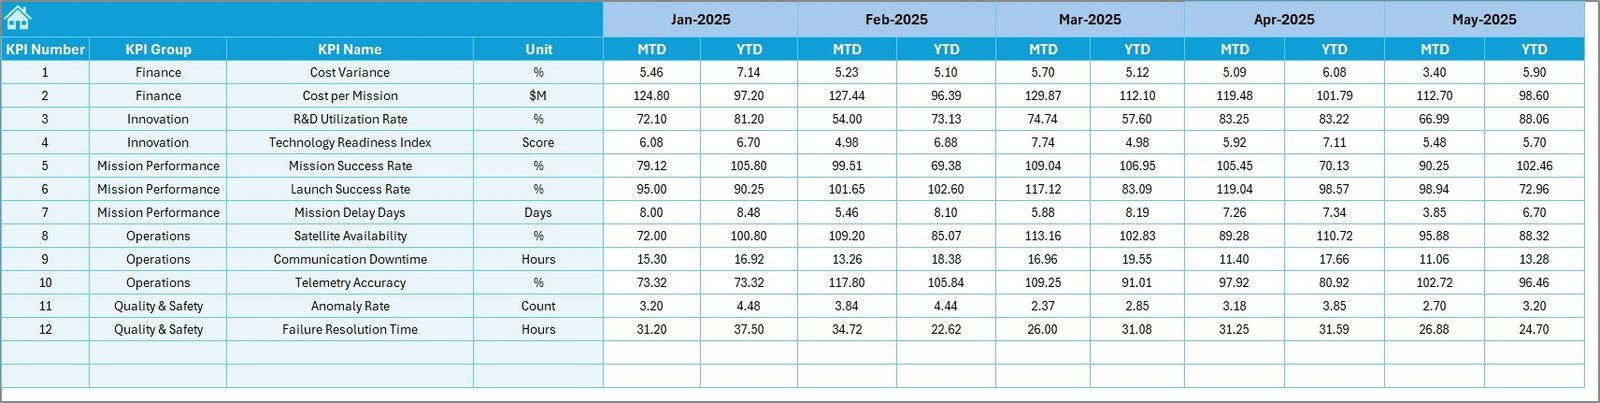
Actual Numbers
The Actual Numbers Input Sheet handles all real performance data.
How This Sheet Works
- Select the first month of the year in cell E1
- Enter MTD and YTD actual values for each KPI
- Change the month to update data automatically
Because of this setup, users maintain consistent data entry throughout the year.

Click to buy Space Technology KPI Dashboard in Excel
How Do Targets Get Managed in the Dashboard?
The Target Sheet Tab stores all planned performance values.
Why This Sheet Is Important
- Enter monthly MTD and YTD targets for each KPI
- Compare actual performance against goals
- Identify underperforming or overperforming KPIs
As a result, leadership teams can track goal achievement clearly.
Click to buy Space Technology KPI Dashboard in Excel
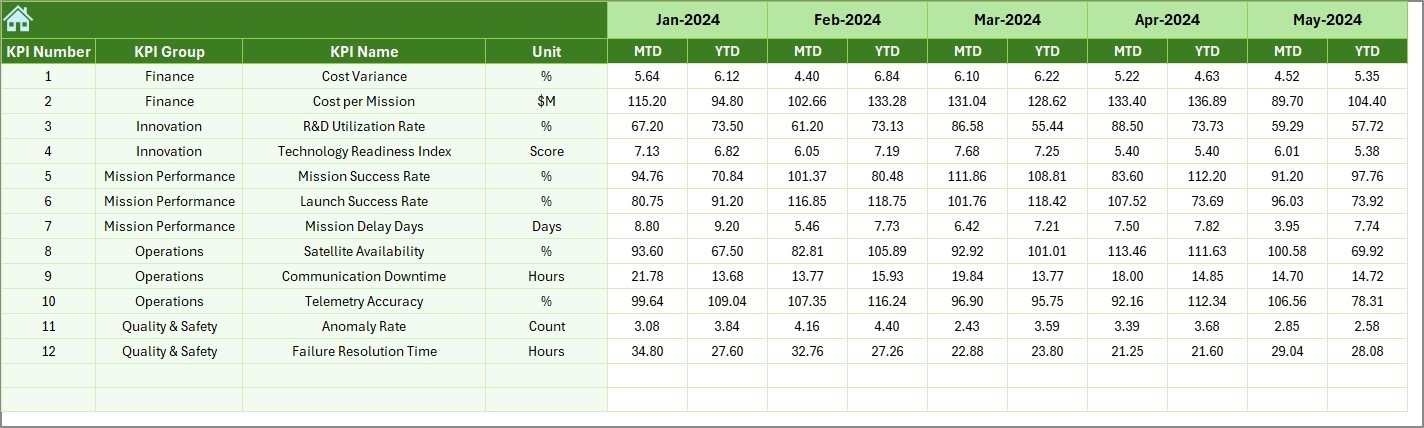
Previous Year Numbers
The Previous Year Number Sheet allows historical comparison.
Benefits of Previous Year Analysis
- Measure year-over-year improvement
- Identify recurring performance issues
- Understand long-term trends
Because space technology projects span multiple years, this comparison becomes extremely valuable.
Click to buy Space Technology KPI Dashboard in Excel
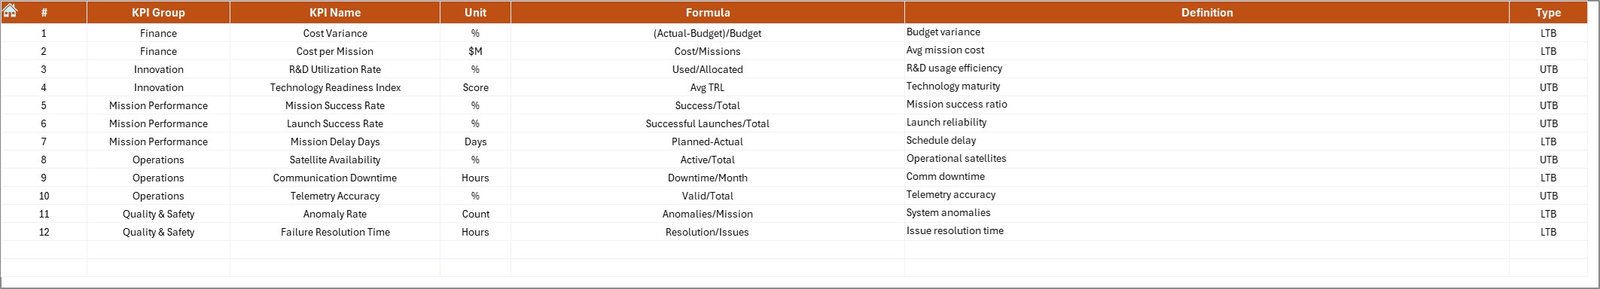
KPI Definition Sheet
The KPI Definition Sheet ensures clarity and consistency.
Information Maintained in This Sheet
- KPI Name
- KPI Group
- Unit of Measurement
- KPI Formula
- KPI Definition
Because of this sheet, every user interprets KPIs correctly. Moreover, it eliminates confusion during reviews and audits.
Click to buy Space Technology KPI Dashboard in Excel
What Types of KPIs Can You Track in a Space Technology Dashboard?
This dashboard supports a wide range of space-related KPIs, such as:
- Satellite launch success rate
- Mission completion percentage
- System reliability index
- Payload accuracy metrics
- R&D efficiency KPIs
- Cost variance metrics
- Schedule adherence KPIs
Since the dashboard remains flexible, teams can add or modify KPIs as needed.
Advantages of Space Technology KPI Dashboard in Excel
A Space Technology KPI Dashboard in Excel delivers several practical benefits.
- Centralized Performance Monitoring
You track all KPIs in one place. As a result, decision-makers gain full visibility instantly.
- Faster Decision-Making
Visual indicators and trend charts highlight issues quickly. Therefore, teams respond faster.
- Improved Accountability
Clear targets and variances make responsibilities transparent across departments.
- Cost-Effective Solution
Excel eliminates the need for expensive BI tools while still delivering powerful insights.
- Easy Customization
Users can add KPIs, adjust formulas, and modify layouts without technical skills.
Best Practices for the Space Technology KPI Dashboard in Excel
To get maximum value from this dashboard, follow these best practices.
- Define KPIs Clearly
Always document KPI formulas and definitions in the KPI Definition sheet. This practice avoids confusion.
- Update Data Regularly
Update actuals and targets monthly to maintain accuracy and trust.
- Use Consistent Units
Ensure all KPI units remain consistent across sheets to avoid misinterpretation.
- Review Trends, Not Just Numbers
Always analyze MTD and YTD trends instead of focusing only on current values.
- Limit KPIs to What Matters
Track only meaningful KPIs that align with mission objectives.
How Can This Dashboard Improve Space Program Governance?
This dashboard supports governance by:
- Providing standardized reporting
- Enabling transparent reviews
- Supporting audit-ready documentation
- Encouraging data-driven culture
As a result, leadership gains confidence in operational control.
Conclusion: Why Should You Use a Space Technology KPI Dashboard in Excel?
A Space Technology KPI Dashboard in Excel transforms complex performance data into clear, actionable insights. It simplifies KPI tracking, improves transparency, and supports smarter decision-making across space missions and technology programs.
Because the dashboard combines structured inputs, visual indicators, and trend analysis, it helps organizations stay aligned with their strategic goals. Moreover, Excel’s flexibility makes this solution accessible, scalable, and practical for space organizations of all sizes.
Frequently Asked Questions (FAQs)
What is a Space Technology KPI Dashboard in Excel used for?
A Space Technology KPI Dashboard in Excel helps track, analyze, and visualize performance metrics related to space missions, systems, and operations.
Can I customize KPIs in this dashboard?
Yes, you can easily add, remove, or modify KPIs by updating the KPI Definition, Actual, and Target sheets.
Do I need advanced Excel skills to use this dashboard?
No, basic Excel knowledge is enough to operate and update this dashboard.
How often should I update the dashboard?
You should update actual and target data monthly to maintain accuracy and relevance.
Can this dashboard handle long-term space projects?
Yes, the inclusion of YTD and Previous Year analysis makes it suitable for multi-year space programs.
Visit our YouTube channel to learn step-by-step video tutorials
Watch the step-by-step video tutorial:
Click to buy Space Technology KPI Dashboard in Excel