In today’s highly competitive chemical industry, companies must monitor production efficiency, quality performance, safety compliance, and financial outcomes continuously. However, many specialty chemical manufacturers still rely on scattered spreadsheets and manual reporting. As a result, decision-makers struggle to track performance accurately and respond quickly to operational challenges.
Therefore, organizations increasingly adopt structured KPI dashboards to monitor business performance in real time. One powerful and practical solution is the Specialty Chemicals KPI Dashboard in Excel — a ready-to-use analytical system designed to track key performance indicators efficiently.
Click to Purchases Specialty Chemicals KPI Dashboard in Excel
In this comprehensive guide, you will learn everything about the Specialty Chemicals KPI Dashboard in Excel, including its structure, features, benefits, implementation steps, best practices, and frequently asked questions.
What Is a Specialty Chemicals KPI Dashboard in Excel?
A Specialty Chemicals KPI Dashboard in Excel is an interactive performance management tool that helps chemical companies track operational, financial, quality, and safety KPIs using a centralized Excel interface.
Instead of reviewing multiple reports separately, managers can analyze all critical performance indicators in one location. Consequently, teams make faster decisions and improve operational efficiency.
Moreover, the dashboard converts raw production and business data into meaningful insights through charts, KPI cards, and trend analysis.
Why Do Specialty Chemical Companies Need KPI Dashboards?
Specialty chemicals manufacturing involves complex processes, strict regulations, and high production costs. Therefore, companies must monitor performance continuously.
Without a KPI dashboard:
-
Data stays scattered across departments
-
Performance tracking becomes slow
-
Errors increase during reporting
-
Management decisions rely on assumptions
However, when organizations implement a KPI dashboard, they gain real-time visibility into operations.
As a result, leaders quickly identify inefficiencies and take corrective action.
What KPIs Are Typically Tracked in Specialty Chemicals?
A well-designed dashboard monitors multiple performance areas simultaneously.
1. Production KPIs
-
Production Yield %
-
Batch Success Rate
-
Capacity Utilization
-
Production Volume
2. Quality KPIs
-
Defect Rate
-
First Pass Yield
-
Customer Complaints
-
Rework Percentage
3. Safety KPIs
-
Incident Rate
-
Lost Time Injury Frequency Rate (LTIFR)
-
Safety Compliance %
4. Financial KPIs
-
Cost per Batch
-
Profit Margin
-
Raw Material Cost Variance
5. Operational Efficiency KPIs
-
Downtime Hours
-
Equipment Efficiency
-
On-Time Delivery %
Because these KPIs connect directly to performance outcomes, companies achieve better operational control.
Click to Purchases Specialty Chemicals KPI Dashboard in Excel
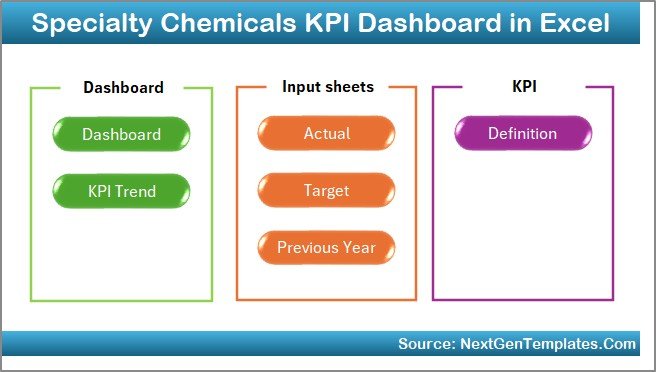
Overview of the Specialty Chemicals KPI Dashboard in Excel
In this article, we created a ready-to-use Specialty Chemicals KPI Dashboard in Excel designed specifically for KPI monitoring and performance tracking.
The dashboard contains 7 structured worksheets, each serving a specific purpose.
1️⃣ Home Sheet – Central Navigation Hub
The Home Sheet works as an index page.
Here, users find six navigation buttons that instantly move to different sheets.
Why this matters:
-
Improves user experience
-
Saves time while navigating
-
Makes the dashboard beginner-friendly
Therefore, even non-technical users can operate the dashboard easily.
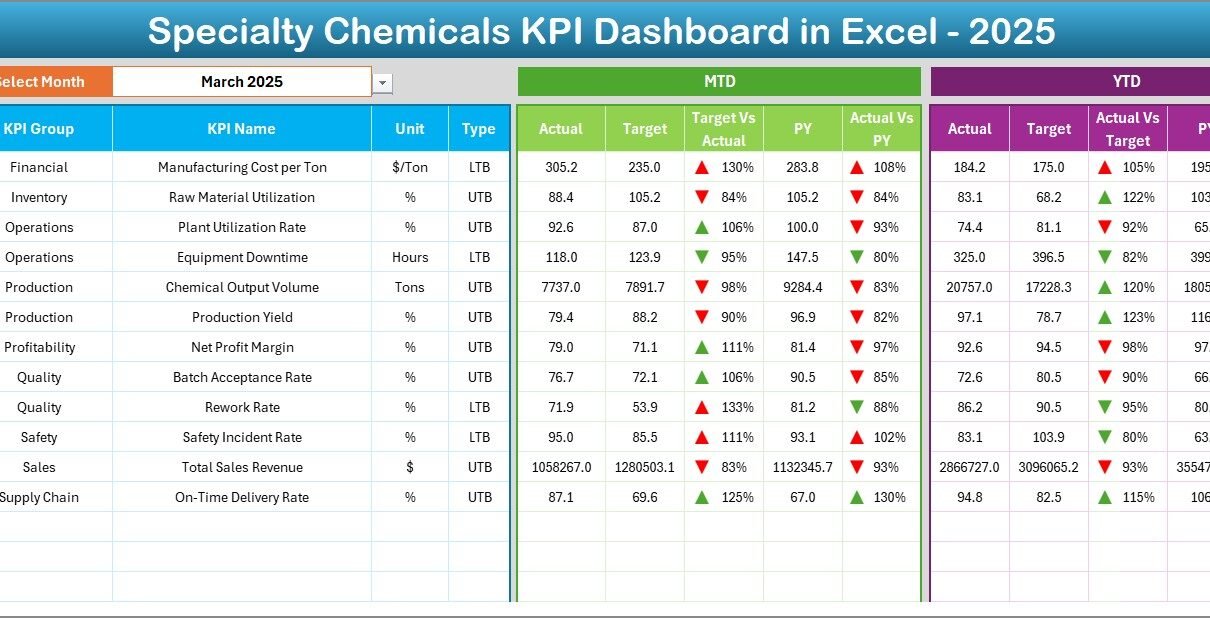
2️⃣ Dashboard Sheet – Main Performance Overview
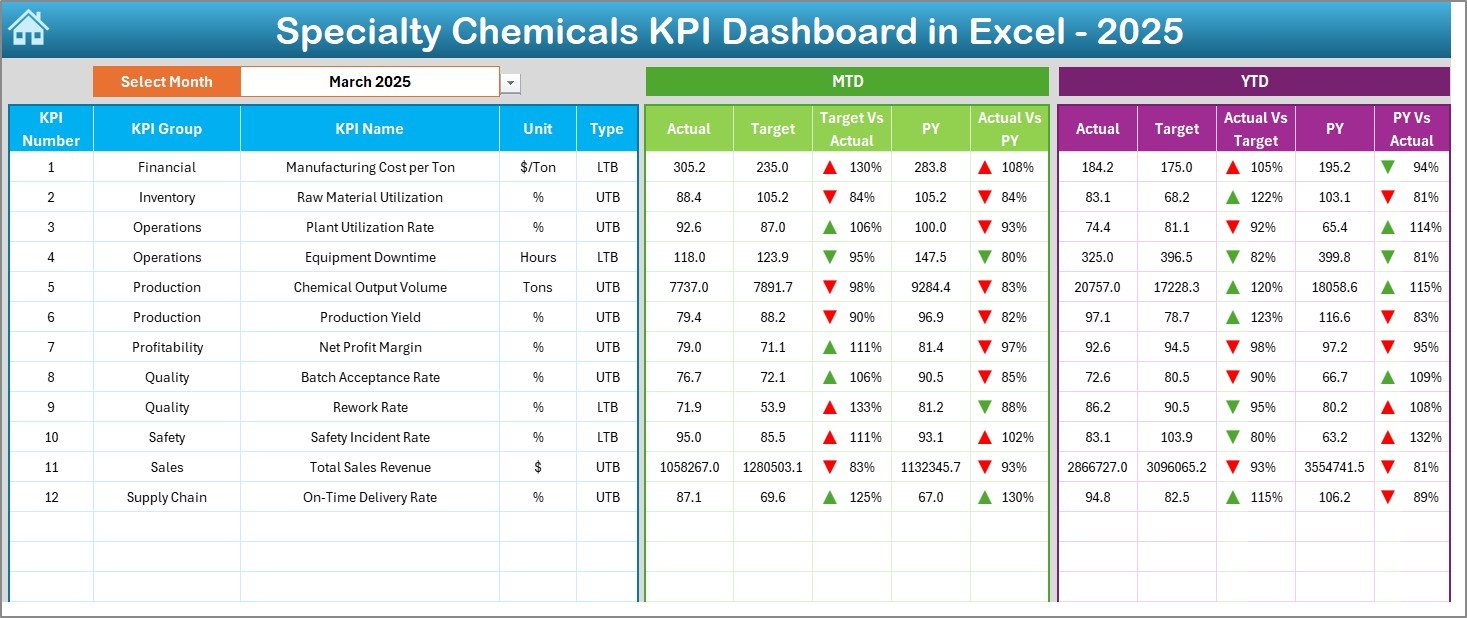
The Dashboard Sheet acts as the core reporting interface.
Here, users see consolidated KPI performance for the selected month.
Key Functionalities
-
Month selection dropdown in cell D3
-
Automatic dashboard updates
-
MTD and YTD comparisons
-
Visual performance indicators
Metrics Displayed
The dashboard shows:
✅ MTD (Month-to-Date)
-
Actual values
-
Target values
-
Previous year data
-
Target vs Actual comparison
-
Previous Year vs Actual comparison
✅ YTD (Year-to-Date)
-
Actual performance
-
Targets
-
Previous year comparison
Additionally, conditional formatting displays up and down arrows, which instantly highlight performance trends.
As a result, managers understand performance without reading detailed reports.
3️⃣ KPI Trend Sheet – Deep Performance Analysis
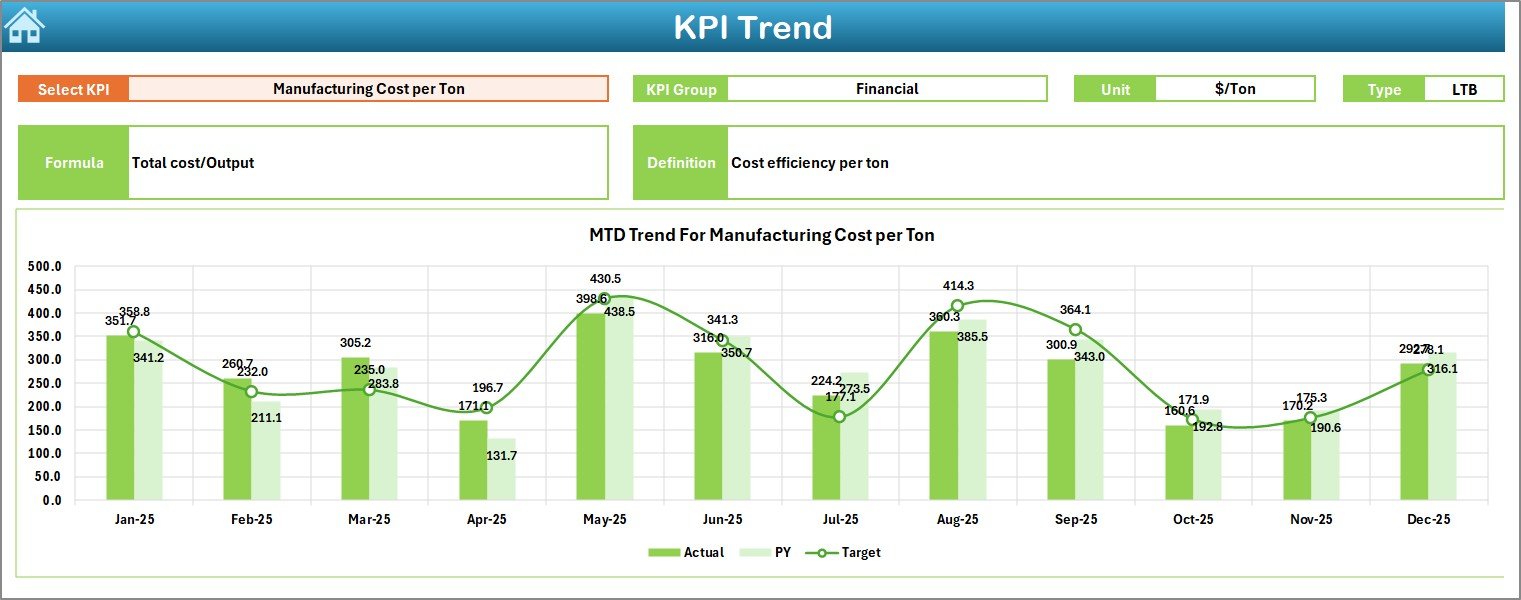
The KPI Trend Sheet allows detailed KPI-level analysis.
Users select a KPI name from the dropdown in cell C3.
Click to Purchases Specialty Chemicals KPI Dashboard in Excel
Information Displayed
-
KPI Group
-
KPI Unit
-
KPI Type (Lower the Better / Upper the Better)
-
KPI Formula
-
KPI Definition
Furthermore, the sheet displays:
-
MTD Trend Chart
-
YTD Trend Chart
-
Actual vs Target vs Previous Year comparison
Therefore, users easily identify performance patterns over time.
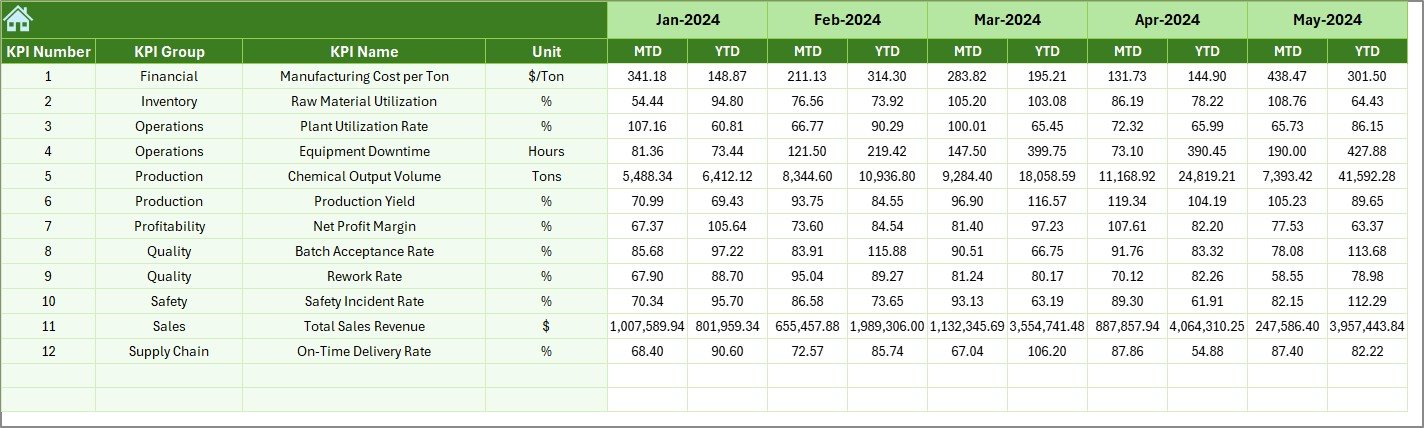
4️⃣ Actual Numbers Input Sheet – Data Entry Area
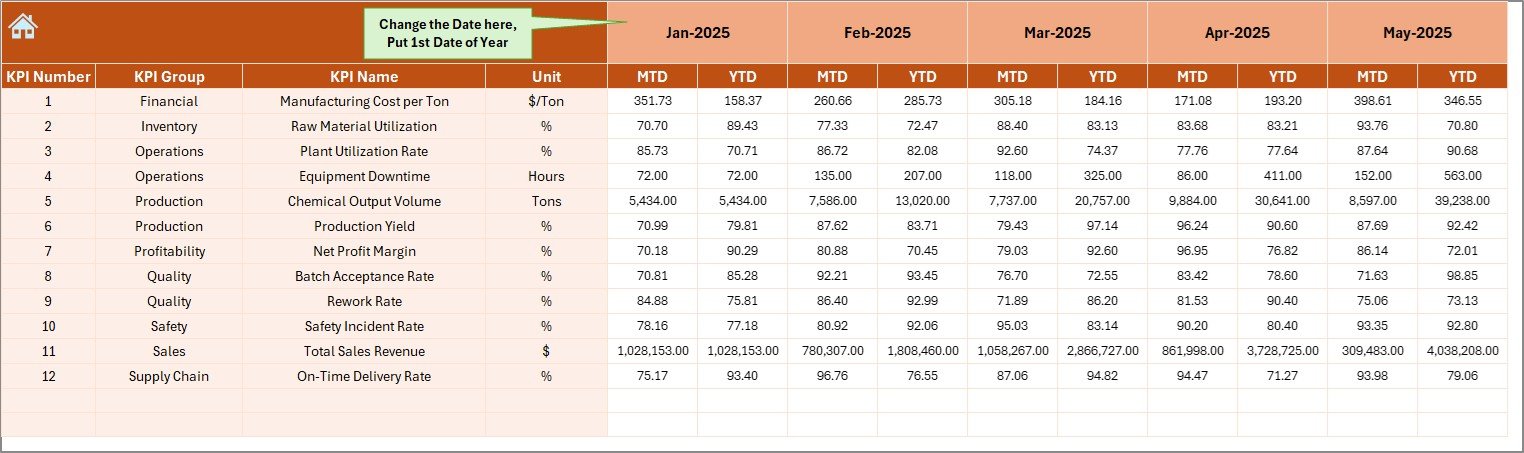
This sheet allows users to input real performance data.
How it works:
-
Enter actual MTD and YTD values
-
Change the starting month in cell E1
-
Dashboard updates automatically
Because the structure remains simple, data entry requires minimal training.
5️⃣ Target Sheet – Goal Management
In this sheet, users enter monthly KPI targets.
The dashboard then compares targets against actual performance automatically.
Consequently, organizations track goal achievement efficiently.
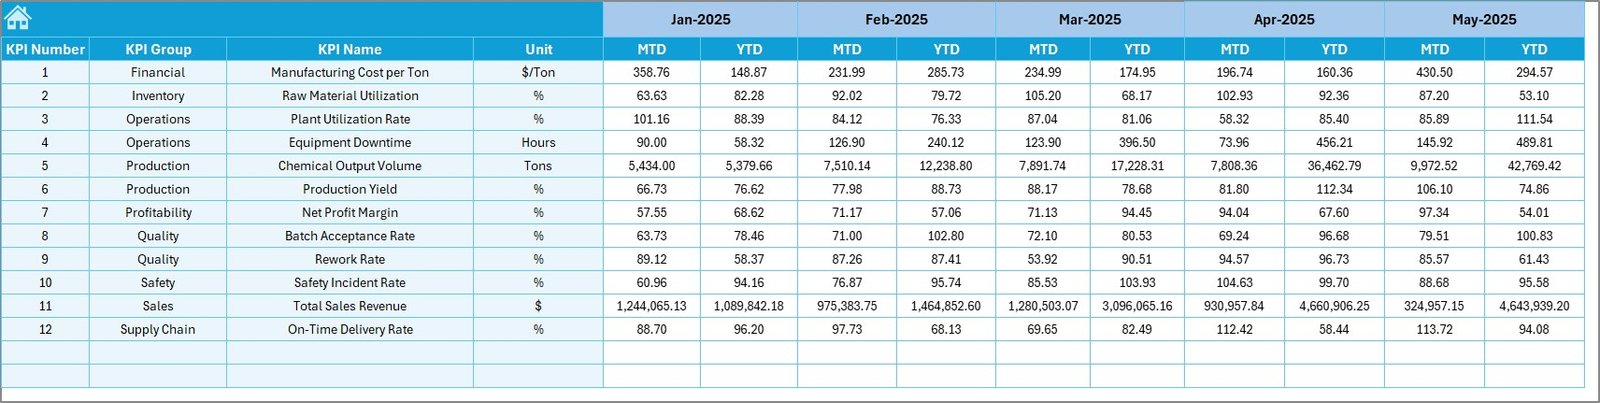
6️⃣ Previous Year Numbers Sheet – Historical Benchmarking
Historical data plays a major role in performance evaluation.
Here, users enter last year’s KPI numbers.
Afterward, the dashboard calculates performance improvement or decline.
This comparison helps management understand long-term trends.
7️⃣ KPI Definition Sheet – KPI Master Database
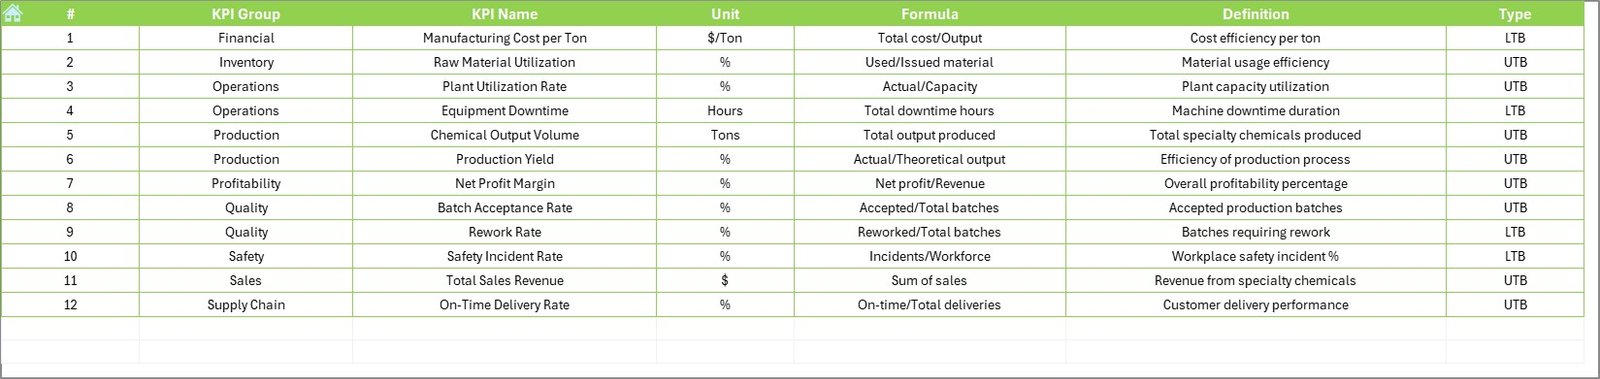
The KPI Definition sheet acts as the foundation of the dashboard.
Users define:
-
KPI Name
-
KPI Group
-
Unit
-
Formula
-
KPI Definition
Because all sheets reference this master data, consistency remains intact throughout the dashboard.
How Does the Dashboard Improve Decision-Making?
A structured KPI dashboard transforms data into insights.
Managers can:
-
Detect performance gaps quickly
-
Compare targets vs results instantly
-
Analyze monthly trends
-
Monitor operational risks
-
Improve planning accuracy
Therefore, leadership shifts from reactive decisions to proactive management.
Advantages of Specialty Chemicals KPI Dashboard in Excel
Click to Purchases Specialty Chemicals KPI Dashboard in Excel
Implementing this dashboard provides several operational and strategic benefits.
✅ Centralized Performance Monitoring
All KPIs appear in one place. Consequently, reporting becomes faster and clearer.
✅ Real-Time Insights
Once users update data, the dashboard recalculates automatically.
✅ Easy to Use
Excel familiarity reduces training requirements.
✅ Better Accountability
Teams track performance against targets consistently.
✅ Improved Productivity
Managers spend less time preparing reports and more time analyzing results.
✅ Cost-Effective Solution
Organizations avoid expensive software investments.
How to Implement the Specialty Chemicals KPI Dashboard?
Follow these steps for successful implementation.
Step 1: Define Business KPIs
Select KPIs aligned with production, quality, safety, and finance goals.
Step 2: Populate KPI Definition Sheet
Enter KPI formulas and definitions clearly.
Step 3: Enter Targets
Add monthly targets into the Target sheet.
Step 4: Add Historical Data
Input previous-year performance numbers.
Step 5: Update Actual Data Monthly
Enter MTD and YTD numbers regularly.
Step 6: Analyze Dashboard Insights
Review performance trends and take action.
Because the process remains structured, implementation becomes smooth.
How Does Excel Make KPI Tracking Powerful?
Excel remains one of the most flexible analytics tools.
Excel advantages include:
-
Dynamic formulas
-
Conditional formatting
-
Automated calculations
-
Interactive charts
-
Customizable layouts
Therefore, companies gain enterprise-level analytics without complex systems.
Common Challenges in Specialty Chemicals KPI Tracking
Although KPI dashboards help significantly, organizations often face challenges.
Data Accuracy Issues
Incorrect data entry leads to misleading insights.
KPI Overload
Tracking too many KPIs reduces focus.
Lack of Standard Definitions
Teams interpret metrics differently.
Irregular Updates
Outdated dashboards lose value.
However, proper processes eliminate these challenges.
Best Practices for the Specialty Chemicals KPI Dashboard
To maximize dashboard effectiveness, follow these best practices.
✔ Select Meaningful KPIs
Choose KPIs that directly impact business performance.
✔ Maintain Data Consistency
Use standardized measurement units.
✔ Update Data Regularly
Schedule monthly updates.
✔ Use Visual Indicators
Color coding improves understanding instantly.
✔ Review Trends Frequently
Trend analysis reveals long-term patterns.
✔ Train Users
Ensure teams understand KPI definitions.
How Can Managers Use This Dashboard Strategically?
Click to Purchases Specialty Chemicals KPI Dashboard in Excel
Managers should not treat dashboards as reporting tools only.
Instead, they should use them for strategic planning.
Practical Uses:
-
Production optimization
-
Quality improvement programs
-
Cost reduction initiatives
-
Performance reviews
-
Forecast planning
As a result, dashboards become decision-support systems.
Who Can Benefit from This KPI Dashboard?
This dashboard serves multiple roles across the specialty chemicals industry.
Beneficiaries include:
-
Plant Managers
-
Operations Heads
-
Quality Managers
-
Finance Teams
-
Supply Chain Managers
-
Business Analysts
Because the dashboard remains flexible, organizations customize it easily.
Future of KPI Dashboards in Specialty Chemicals
Data-driven manufacturing continues to grow rapidly.
Organizations increasingly integrate dashboards with:
-
ERP systems
-
IoT sensors
-
Production automation
-
Predictive analytics
Therefore, Excel dashboards act as the first step toward digital transformation.
Conclusion
The Specialty Chemicals KPI Dashboard in Excel provides a structured, practical, and powerful way to monitor organizational performance. Instead of relying on manual reports, companies gain instant visibility into operational, financial, and quality metrics.
Moreover, the dashboard simplifies KPI tracking through automated calculations, trend analysis, and visual indicators. Consequently, decision-makers identify problems faster and improve operational efficiency.
When organizations implement this dashboard correctly and follow best practices, they strengthen performance management and build a strong data-driven culture.
Ultimately, this ready-to-use Excel solution empowers specialty chemical companies to transform data into actionable insights and achieve sustainable growth.
Frequently Asked Questions (FAQs)
1. What is a Specialty Chemicals KPI Dashboard?
It is an Excel-based tool that tracks operational, financial, quality, and safety KPIs in one centralized dashboard.
2. Do I need advanced Excel skills to use it?
No. The dashboard uses simple inputs and automated calculations, so beginners can use it easily.
3. How often should I update the dashboard?
You should update it monthly to maintain accurate performance tracking.
4. Can I customize KPIs?
Yes. You can modify KPIs using the KPI Definition sheet.
5. What does MTD and YTD mean?
-
MTD: Month-to-Date performance
-
YTD: Year-to-Date cumulative performance
6. Why compare with previous year data?
Click to Purchases Specialty Chemicals KPI Dashboard in Excel
Historical comparison helps evaluate improvement trends and long-term performance.
7. Is Excel suitable for KPI dashboards?
Yes. Excel offers flexibility, automation, and visualization features suitable for performance monitoring.
8. Who should use this dashboard?
Managers, analysts, and operational leaders in specialty chemical companies benefit the most.
Visit our YouTube channel to learn step-by-step video tutorials