Modern sports equipment manufacturing operates in a fast-moving and highly competitive environment. Companies manufacture products such as fitness machines, cricket equipment, football gear, athletic footwear, gym accessories, and performance training tools. However, as production volume increases, operational complexity also grows.Manufacturers must monitor production efficiency, quality performance, delivery timelines, workforce productivity, inventory movement, and financial outcomes simultaneously. Therefore, businesses need a centralized performance monitoring system that converts raw operational data into clear insights.This is exactly where a Sports Equipment Manufacturing KPI Dashboard in Power BI becomes essential.Instead of relying on scattered spreadsheets and manual reporting, organizations can analyze performance through interactive visuals, automated comparisons, and real-time KPI monitoring. As a result, managers make faster decisions, identify problems early, and improve operational efficiency consistently.
In this complete guide, you will learn everything about the Sports Equipment Manufacturing KPI Dashboard in Power BI, including features, structure, implementation, advantages, best practices, and frequently asked questions.
Click to buy Sports Equipment Manufacturing KPI Dashboard in Power BI
What Is a Sports Equipment Manufacturing KPI Dashboard in Power BI?
A Sports Equipment Manufacturing KPI Dashboard in Power BI is a ready-to-use business intelligence solution designed to monitor manufacturing performance using structured Key Performance Indicators (KPIs).
The dashboard collects data from an Excel file and transforms it into interactive reports and visual analytics. Consequently, decision-makers can evaluate performance instantly without manual calculations.
Instead of reviewing multiple reports, users can:
- Track manufacturing KPIs in one place
- Compare Actual vs Target performance
- Monitor Month-To-Date (MTD) and Year-To-Date (YTD) results
- Analyze historical performance trends
- Drill into KPI definitions and formulas
Therefore, the dashboard simplifies performance tracking while improving operational transparency.
Why Do Sports Equipment Manufacturers Need KPI Dashboards?
Manufacturing sports equipment involves multiple departments working together. Production teams focus on efficiency, quality teams monitor defects, and management tracks profitability. However, when data remains disconnected, teams struggle to align their goals.
A KPI dashboard solves this challenge.
Common Problems Without KPI Tracking
- Manual report preparation consumes time
- Performance visibility remains limited
- Managers react late to issues
- Targets become difficult to track
- Historical comparisons require effort
On the other hand, a structured dashboard provides clarity and control.
With a KPI Dashboard, Organizations Can:
- Monitor performance daily or monthly
- Identify underperforming KPIs quickly
- Improve production planning
- Reduce operational risks
- Enable data-driven decision making
As a result, companies shift from reactive management to proactive performance improvement.
How Does the Sports Equipment Manufacturing KPI Dashboard Work?
The dashboard operates using Power BI visualization combined with Excel data input. First, users enter KPI data into structured Excel sheets. Then Power BI automatically updates visuals and performance indicators.
Because of this automation, users avoid repetitive calculations and reporting work.
Dashboard Structure: Pages Inside the Power BI File
The dashboard contains three powerful pages, each designed for a specific purpose.
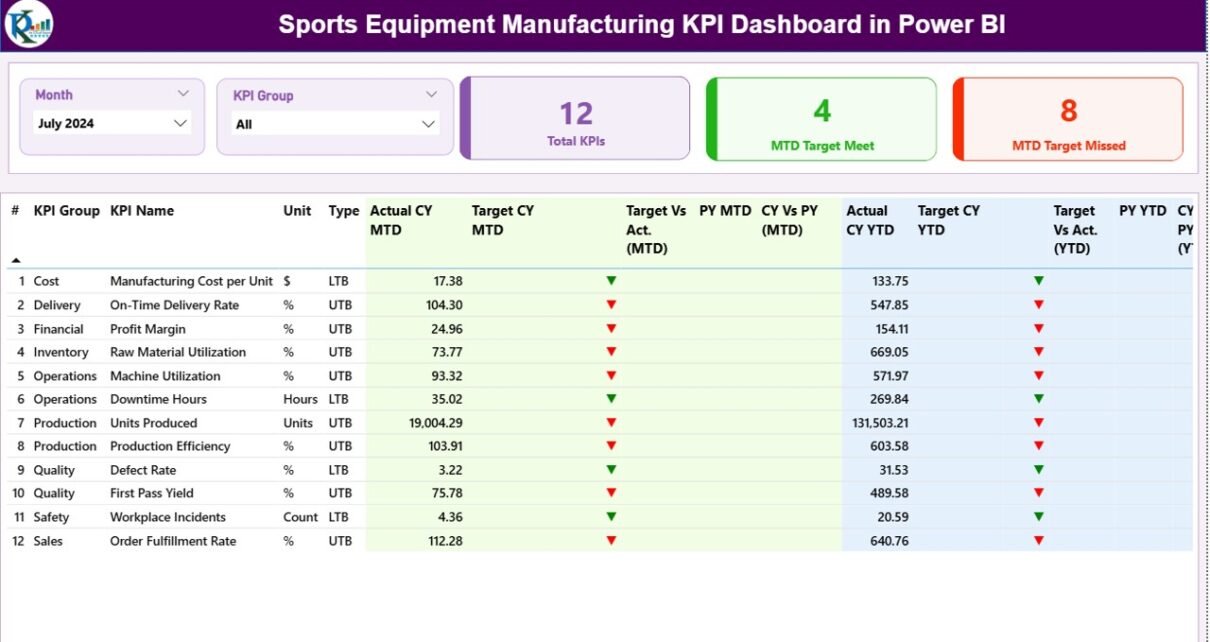
Summary Page – The Central Performance Overview
The Summary Page acts as the main interface of the dashboard. Managers usually start their analysis here because it provides a complete KPI snapshot.
Key Elements Available on the Summary Page
Interactive Slicers
At the top, users can select:
- Month slicer
- KPI Group slicer
Therefore, the entire dashboard updates instantly based on selections.
KPI Performance Cards
Three KPI cards display:
- Total KPIs Count
- MTD Target Meet Count
- MTD Target Missed Count
These cards quickly show overall performance health.
Detailed KPI Table Explained
The dashboard displays detailed KPI information including:
- KPI Number – Sequence identifier
- KPI Group – Category of KPI
- KPI Name – Performance metric name
- Unit – Measurement unit
- Type – LTB (Lower the Better) or UTB (Upper the Better)
MTD Performance Metrics
The dashboard calculates Month-To-Date performance automatically:
- Actual CY MTD
- Target CY MTD
- MTD Status Icon (▲ Green / ▼ Red)
- Target vs Actual % (Actual ÷ Target)
- Previous Year MTD
- Current Year vs Previous Year %
As a result, users instantly understand short-term performance trends.
YTD Performance Metrics
Similarly, Year-To-Date analysis includes:
- Actual CY YTD
- Target CY YTD
- YTD Status Indicators
- Target vs Actual YTD %
- Previous Year YTD
- CY vs PY Comparison %
Therefore, management gains both monthly and yearly insights simultaneously.

Click to buy Sports Equipment Manufacturing KPI Dashboard in Power BI
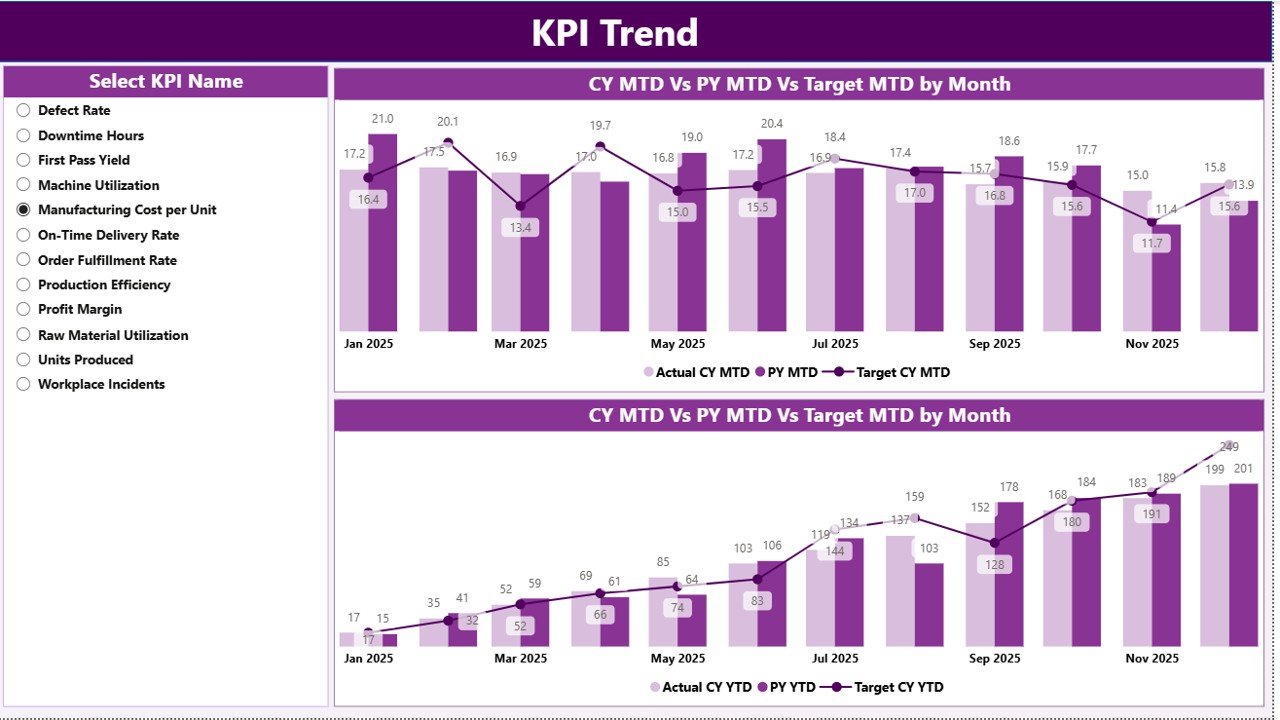
KPI Trend Page – Performance Over Time
While the summary page shows status, the KPI Trend Page explains performance behavior.
Features of the Trend Page
- KPI selection slicer on the left
Two combo charts showing:
Current Year Actuals
Previous Year Actuals
Targets
Charts display both MTD and YTD comparisons.
Because of visual trend analysis, users can easily identify:
- Growth patterns
- Seasonal performance
- Declining KPIs
- Improvement opportunities
Consequently, strategic planning becomes easier.
Click to buy Sports Equipment Manufacturing KPI Dashboard in Power BI
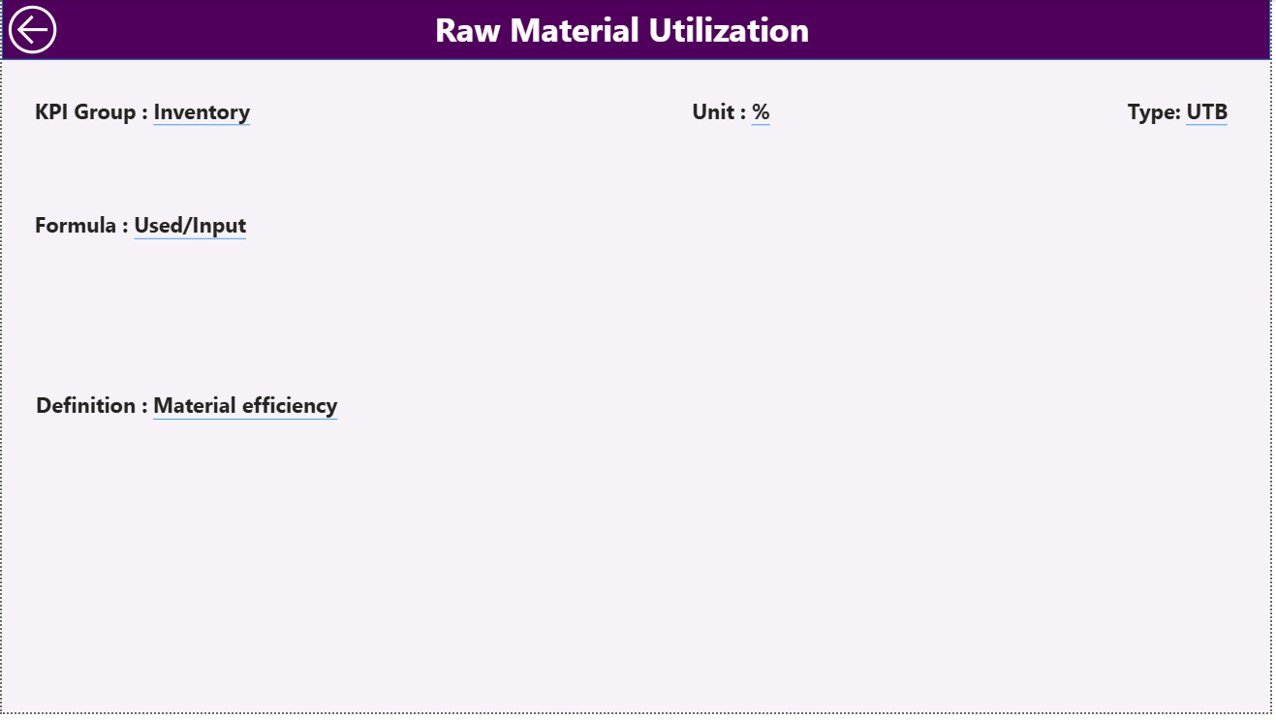
KPI Definition Page – Drill-Through Analysis
The KPI Definition Page remains hidden to maintain dashboard simplicity. However, users can drill through from the summary page.
This page displays:
- KPI Formula
- KPI Definition
- Measurement logic
- KPI Type (LTB or UTB)
Additionally, a back button allows users to return to the main dashboard instantly.
Therefore, users receive both high-level and detailed insights without clutter.
Click to buy Sports Equipment Manufacturing KPI Dashboard in Power BI
Excel Data Source Structure
The dashboard uses an Excel file as its data source. Users only need to maintain three worksheets.
Input_Actual Sheet
Users enter:
- KPI Name
- Month (first date of month)
- MTD values
- YTD values
Once data updates, Power BI refreshes automatically.
Input_Target Sheet
This sheet stores planned targets:
- KPI Name
- Month
- Target MTD
- Target YTD
Therefore, the dashboard compares actual performance against goals.
KPI Definition Sheet
Users define KPI metadata:
- KPI Number
- KPI Group
- KPI Name
- Unit
- Formula
- Definition
- Type (LTB/UTB)
This structure ensures standardized KPI tracking.
What KPIs Can Be Tracked in Sports Equipment Manufacturing?
Organizations can customize KPIs according to operations.
Production KPIs
- Production Output Rate
- Machine Utilization
- Downtime Percentage
- Cycle Time
Quality KPIs
- Defect Rate
- Rework Percentage
- Quality Compliance Score
Supply Chain KPIs
- Inventory Turnover
- On-Time Delivery
- Raw Material Availability
Financial KPIs
- Production Cost per Unit
- Profit Margin
- Revenue Growth
Workforce KPIs
- Labor Productivity
- Attendance Efficiency
- Training Effectiveness
Thus, the dashboard adapts to different manufacturing environments.
Advantages of Sports Equipment Manufacturing KPI Dashboard in Power BI
Implementing this dashboard provides multiple business benefits.
- Centralized Performance Monitoring
All KPIs appear in one dashboard. Therefore, managers avoid switching between reports.
- Faster Decision Making
Visual indicators immediately highlight issues. Consequently, teams take action quickly.
- Automated Reporting
Power BI performs calculations automatically. As a result, reporting time reduces significantly.
- Real-Time Insights
Data refresh allows continuous performance tracking.
- Improved Accountability
Teams clearly see target achievement status.
- Historical Comparison
Previous year comparisons help evaluate progress accurately.
- User-Friendly Interface
Interactive slicers make analysis simple even for non-technical users.
How to Implement the Dashboard Step-by-Step?
Organizations can deploy the dashboard easily.
Step 1: Define KPIs
Identify production, quality, and financial KPIs.
Step 2: Prepare Excel Data
Enter actual and target values into input sheets.
Step 3: Load Data into Power BI
Connect Excel file to the dashboard.
Step 4: Refresh Data
Update visuals using refresh functionality.
Step 5: Monitor Performance
Use slicers and charts for analysis.
Therefore, implementation requires minimal technical effort.
Best Practices for the Sports Equipment Manufacturing KPI Dashboard in Power BI
Following best practices ensures maximum value.
Use Clear KPI Definitions
Always define formulas and measurement logic.
Update Data Regularly
Consistent updates improve accuracy.
Avoid Too Many KPIs
Focus on critical performance indicators.
Use Standard Units
Maintain consistent measurement units.
Review Trends Monthly
Trend analysis reveals performance patterns.
Train Users
Ensure managers understand dashboard navigation.
Align KPIs with Business Goals
Every KPI should support strategic objectives.
How Does Power BI Improve Manufacturing Analytics?
Power BI transforms raw data into meaningful insights.
Visual Analytics
Charts simplify complex numbers.
Interactive Filtering
Users analyze data dynamically.
Drill-Through Capability
Detailed analysis becomes effortless.
Data Integration
Excel data connects seamlessly.
Therefore, Power BI acts as a powerful decision-support system.
Common Challenges and How This Dashboard Solves Them
Hence, organizations achieve operational clarity.
Who Can Benefit from This Dashboard?
Many professionals gain value from this solution:
- Manufacturing Managers
- Plant Supervisors
- Operations Heads
- Quality Managers
- Supply Chain Analysts
- Business Executives
Additionally, small and large manufacturers can both adopt it.
Future of KPI Dashboards in Manufacturing
Manufacturing analytics continues to evolve. Companies increasingly rely on data visualization and predictive insights.
In the future, KPI dashboards will include:
- AI-based forecasting
- Predictive maintenance analytics
- Automated alerts
- Real-time IoT integration
Therefore, adopting Power BI dashboards today prepares organizations for digital transformation.
Conclusion
Sports equipment manufacturing requires continuous monitoring, accurate reporting, and fast decision-making. However, manual reporting methods limit visibility and slow operational improvement.
The Sports Equipment Manufacturing KPI Dashboard in Power BI provides a structured, automated, and user-friendly solution that transforms Excel data into actionable insights.
Because it combines KPI tracking, trend analysis, and performance comparison in one platform, organizations gain complete control over manufacturing performance.
Ultimately, businesses that use data effectively achieve higher productivity, improved quality, and stronger profitability.
Frequently Asked Questions (FAQs)
- What is a KPI dashboard in Power BI?
A KPI dashboard in Power BI visualizes performance metrics using interactive charts and automated calculations.
- Can beginners use this dashboard?
Yes. Users only need to update Excel data, and the dashboard updates automatically.
- What does LTB and UTB mean?
LTB means Lower the Better, while UTB means Upper the Better KPI performance type.
- How often should data be updated?
Organizations should update data monthly or weekly depending on reporting needs.
- Can I customize KPIs?
Yes. You can modify KPI definitions and add new KPIs easily.
- Does the dashboard support historical comparison?
Yes. It compares current performance with previous year results automatically.
- Is Power BI suitable for manufacturing analytics?
Absolutely. Power BI provides strong visualization and analytical capabilities for manufacturing environments.
Visit our YouTube channel to learn step-by-step video tutorials
Watch the step-by-step video tutorial:
Click to buy Sports Equipment Manufacturing KPI Dashboard in Power BI