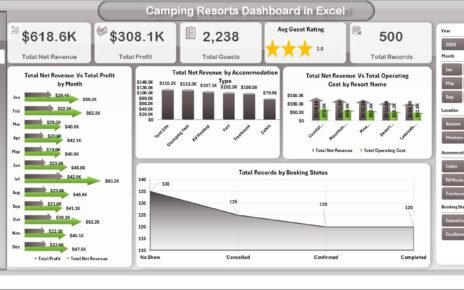
In the fast-paced world of sports, data plays a critical role in driving success. From player performance to team efficiency, every decision depends on accurate insights. Whether it’s managing training intensity, improving win ratios, or analyzing financial outcomes, a Sports KPI Scorecard in Excel helps you track all essential metrics in one structured view.
This article will guide you through everything you need to know about building and using a Sports KPI Scorecard in Excel — its structure, benefits, features, and best practices to make data your ultimate coaching partner.
🎯 What Is a Sports KPI Scorecard in Excel?
A Sports KPI Scorecard in Excel is a performance management tool designed to measure and visualize the key performance indicators (KPIs) for sports organizations, academies, or individual teams.
Instead of manually collecting and reviewing multiple sheets of statistics, this scorecard consolidates all critical metrics — such as player efficiency, team performance, injury rates, and financial outcomes — into one clean and dynamic dashboard.
It helps coaches, managers, and sports analysts monitor progress, identify strengths and weaknesses, and make informed decisions that lead to winning results.
Click to Purchases Sports KPI Scorecard in Excel
📊 Why Do Sports Organizations Need a KPI Scorecard?
Every sports organization faces challenges in tracking and managing performance across different areas — coaching, fitness, operations, finance, and fan engagement. Without a centralized system, it becomes difficult to assess overall effectiveness.
Here’s why having a KPI scorecard in Excel is a game changer:
-
✅ It brings all KPIs together in one place.
-
✅ It allows instant comparison between actual and target performance.
-
✅ It provides visual feedback using charts and color indicators.
-
✅ It enables data-driven decision-making for coaches and administrators.
-
✅ It helps predict future outcomes using historical data trends.
With Excel’s flexibility, you can modify, expand, or customize KPIs to fit your sport — be it football, cricket, basketball, tennis, or athletics.
🧩 Key Features of the Sports KPI Scorecard in Excel
The Sports KPI Scorecard is built to simplify complex analysis. It includes four primary worksheets, each serving a unique purpose in the performance management cycle.
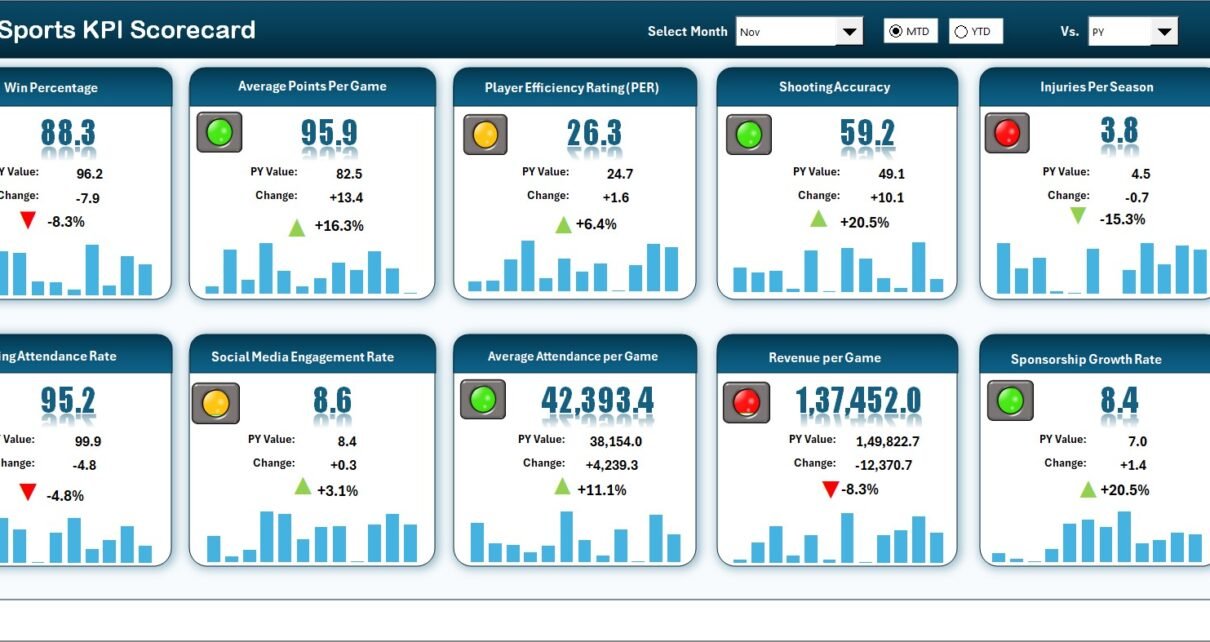
1️⃣ Scorecard Sheet — The Central Dashboard
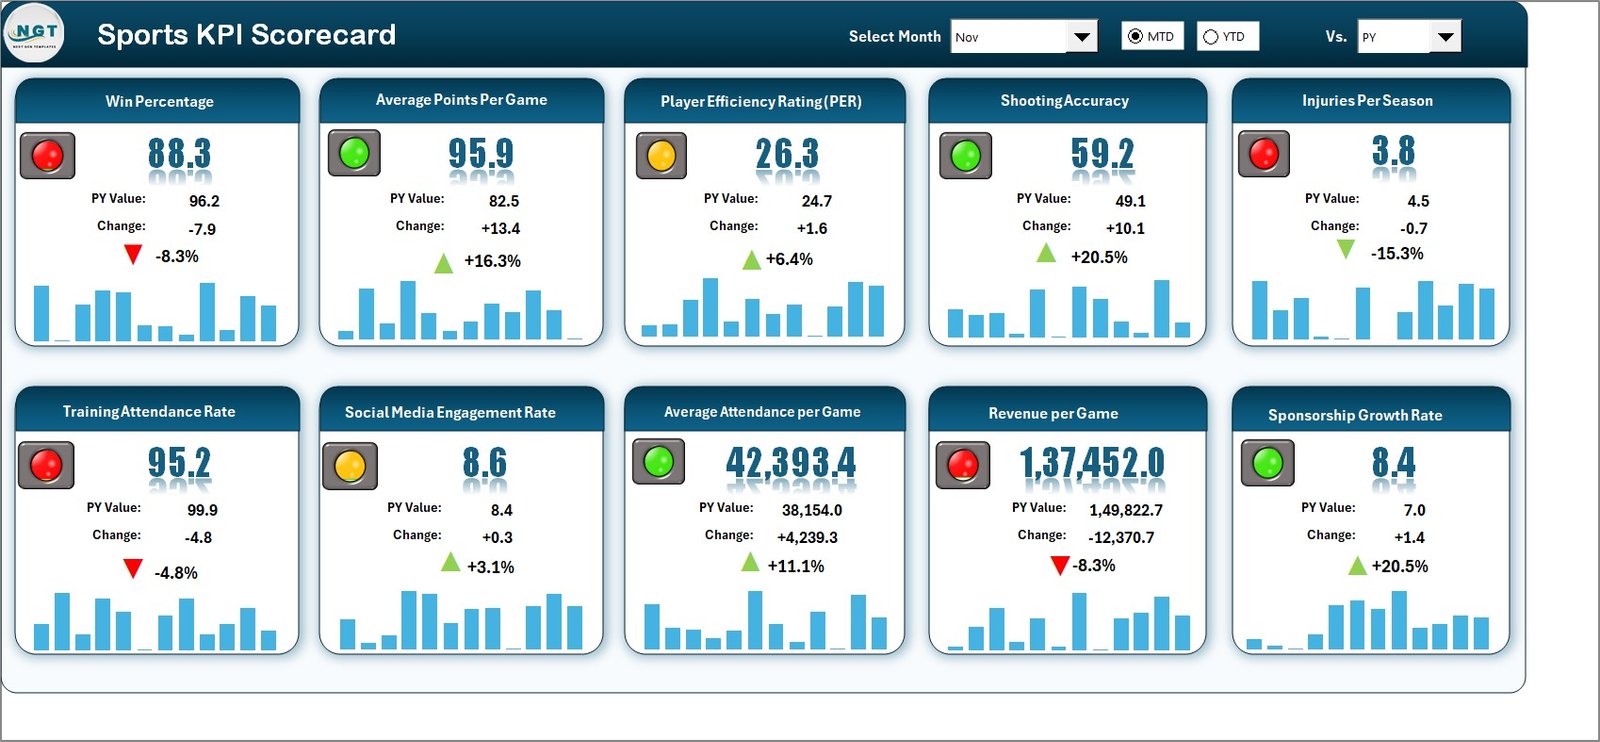
The Scorecard sheet is the heart of this template. It provides a comprehensive and visual summary of your sports KPIs.
Key Features:
-
🎛 Dropdown Menus: Choose the month and mode (MTD or YTD) for performance analysis.
-
📈 Actual vs Target Values: Instantly compare actual performance against set goals.
-
🟢 Visual Indicators: Use color-coded arrows and icons to highlight positive or negative trends.
-
🧾 Comprehensive KPI Overview: View details like KPI Group, KPI Name, Unit, Actuals, Targets, and Performance Gaps.
This sheet gives you a quick snapshot of how your sports department, academy, or team is performing over time.
2️⃣ KPI Trend Sheet — Analyze Historical Data
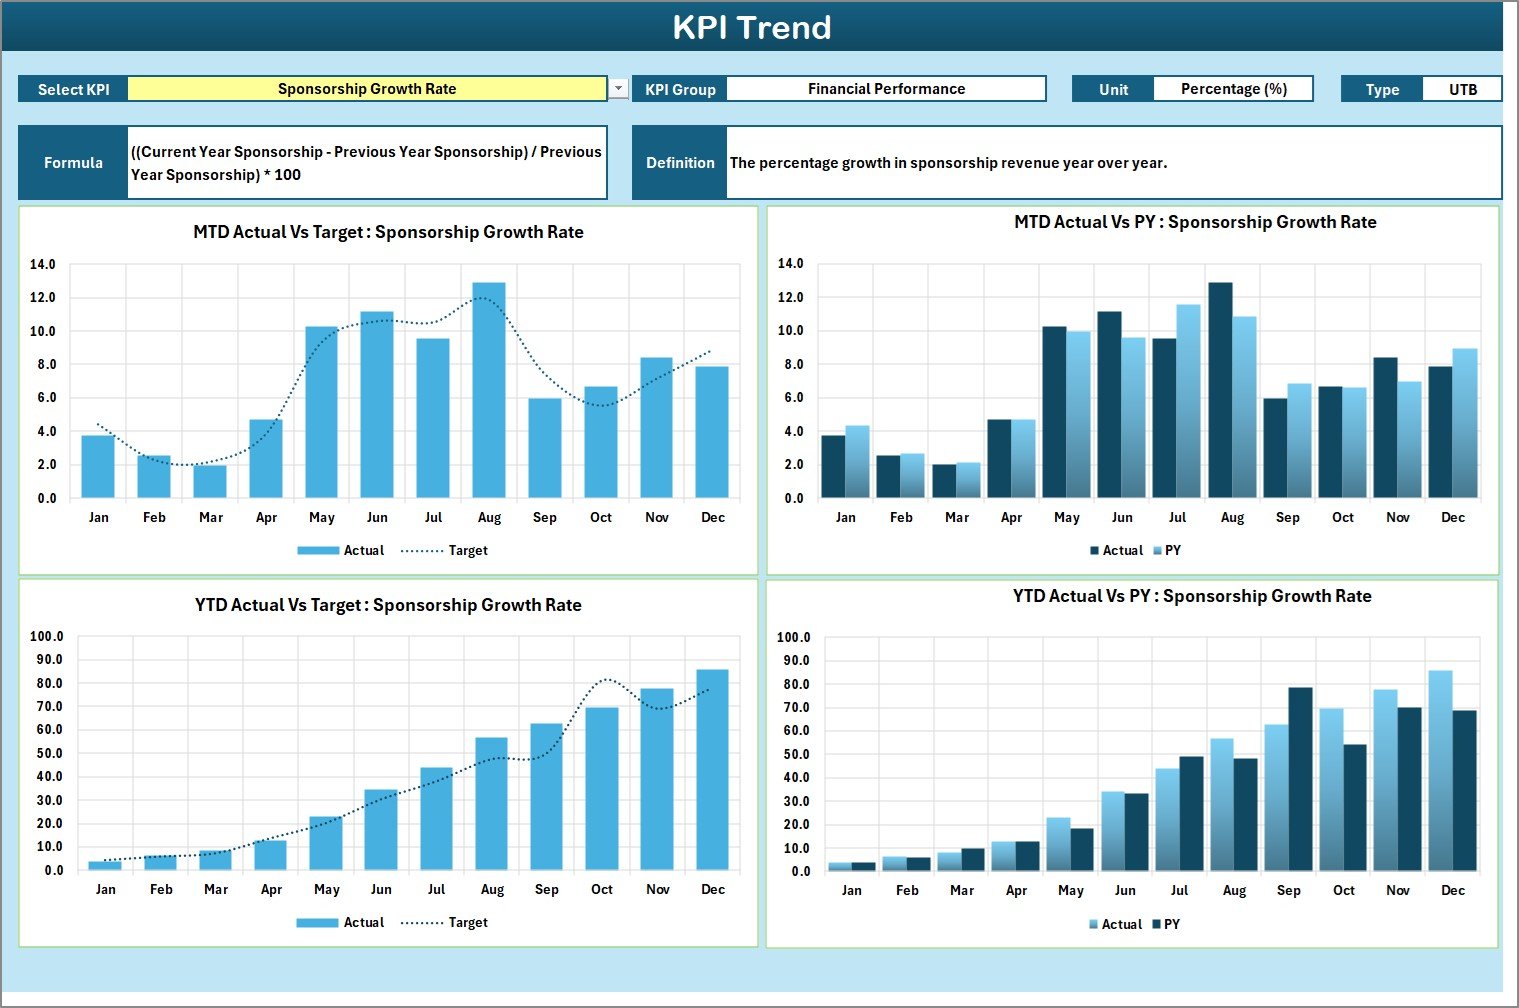
The KPI Trend sheet allows you to track and visualize how performance evolves over time.
By selecting a KPI from the dropdown (cell C3), the dashboard dynamically displays related details such as:
-
KPI Group
-
Unit of Measurement
-
KPI Type (UTB – Upper the Better / LTB – Lower the Better)
-
Formula
-
Definition
Below this section, trend charts illustrate Month-to-Date (MTD) and Year-to-Date (YTD) performance for Actual, Target, and Previous Year (PY) data.
This helps managers and coaches spot performance fluctuations and understand whether progress is consistent or needs improvement.
3️⃣ Input Data Sheet — The Data Backbone
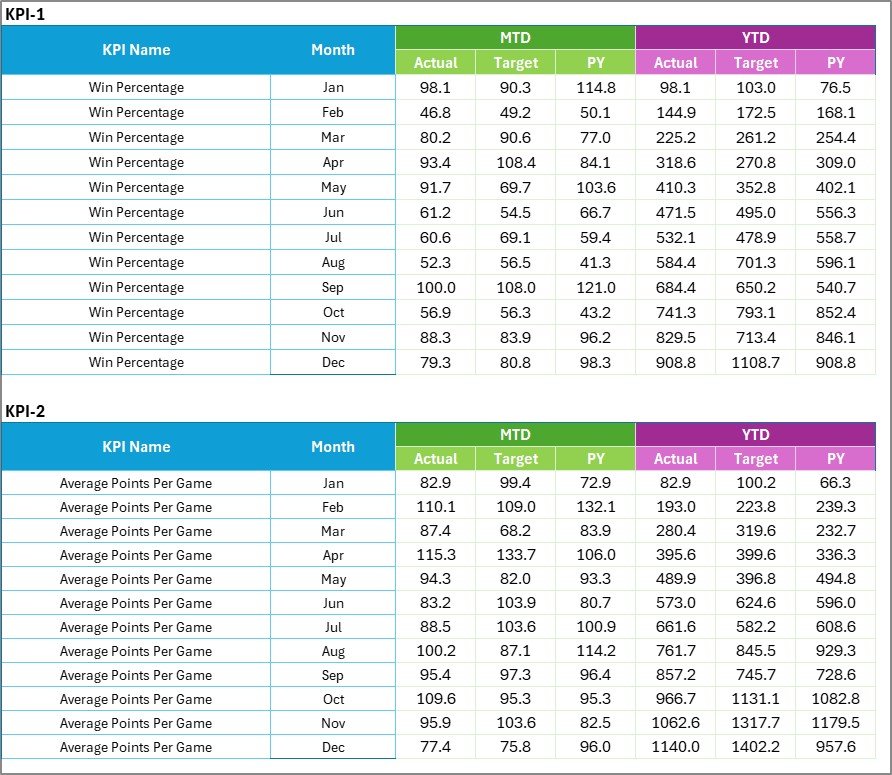
The Input Data sheet is where all KPI data is recorded and updated.
Main Functions:
-
✍️ Data Entry: Record actual values, targets, and other KPI metrics for each month.
-
🔁 Real-Time Updates: Easily modify data as new results become available.
-
🧮 Dynamic Links: Automatically updates other sheets, ensuring your scorecard reflects real-time performance.
This structure ensures accuracy and consistency, allowing Excel formulas and pivot tables to calculate trends automatically.
4️⃣ KPI Definition Sheet — The Reference Library
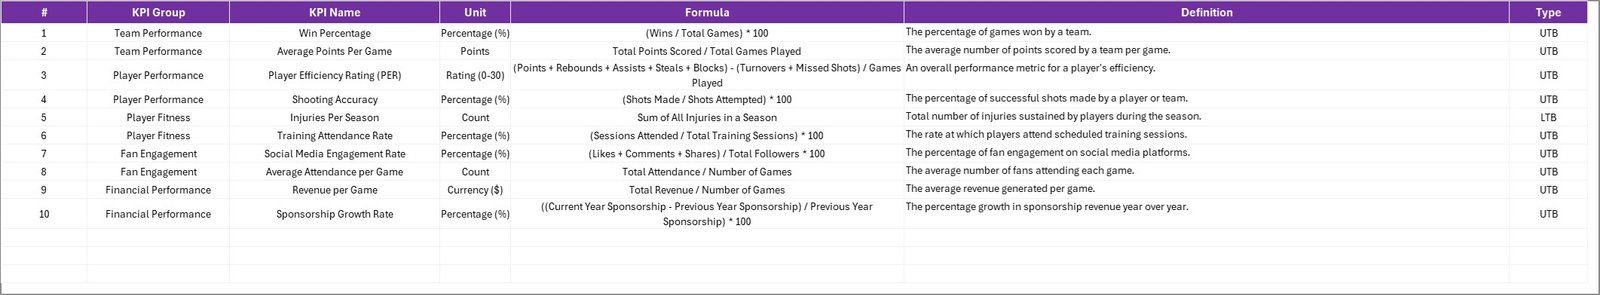
The KPI Definition sheet acts as a knowledge base that defines each KPI’s purpose and calculation method.
Columns include:
-
KPI Name
-
KPI Group
-
Unit of Measurement
-
Formula
-
Definition
Having this reference makes it easier for new team members, analysts, or coaches to understand how each metric is derived and what it measures. It also ensures standardization across departments or teams.
⚙️ How Does the Sports KPI Scorecard Work?
The system works through interconnected Excel sheets that dynamically pull, calculate, and display performance results.
Here’s the step-by-step process:
-
Input Data: Enter Actual, Target, and Previous Year values into the Input Data sheet.
-
Automatic Calculations: Excel formulas compute MTD and YTD values.
-
KPI Mapping: Each KPI links with its definition and category.
-
Visual Display: The Scorecard and Trend sheets display insights through tables and charts.
-
Analysis: Coaches and managers use this data to assess performance gaps, improvement areas, and overall efficiency.
This workflow ensures speed, accuracy, and clarity, even for users with basic Excel knowledge.
⚽ Common KPIs Tracked in a Sports KPI Scorecard
A Sports KPI Scorecard can include a variety of performance metrics depending on your focus — athletic, operational, or financial.
🏋️♂️ Player and Team Performance KPIs
-
Goals or Points Scored
-
Win/Loss Ratio
-
Average Training Hours per Player
-
Injury Rate (%)
-
Fitness Test Completion Rate
-
Player Efficiency Rating
💼 Operational KPIs
-
Training Attendance (%)
-
Equipment Utilization Rate
-
Coaching Session Effectiveness
-
Facility Maintenance Cost
💰 Financial KPIs
-
Revenue per Event or Match
-
Sponsorship ROI
-
Budget Utilization (%)
-
Cost per Player or Team
💬 Fan and Engagement KPIs
-
Social Media Engagement
-
Attendance per Game
-
Merchandise Sales Growth
-
Customer Satisfaction Score
These metrics can be customized depending on your sport, league size, and data availability.
Click to Purchases Sports KPI Scorecard in Excel
🧠 Advantages of Sports KPI Scorecard in Excel
Implementing a Sports KPI Scorecard brings numerous benefits. Let’s explore the key advantages below.
- 1. 📊 Centralized Performance Tracking
- The scorecard consolidates all relevant data into one dashboard, reducing time spent searching across multiple reports.
- 2. 🔍 Better Decision-Making
- Instant comparison between actual and target values helps identify weak areas quickly. Coaches can take corrective action before performance dips further.
- 3. 💪 Increased Accountability
- Since each KPI is assigned to a team, player, or department, it promotes transparency and accountability within the organization.
- 4. ⚡ Real-Time Insights
- Dynamic formulas and visual indicators allow instant updates as soon as data changes, making it ideal for real-time tracking during tournaments or seasons.
- 5. 🧩 Easy Customization
- The Excel-based structure makes it easy to add or remove KPIs, modify charts, or include new sports categories without technical expertise.
- 6. 💵 Cost-Effective Solution
- Unlike expensive sports analytics software, Excel offers a low-cost yet powerful platform that most organizations already have access to.
- 7. 📈 Improved Strategic Planning
- Long-term trend analysis helps organizations plan training schedules, budget allocations, and future recruitment based on accurate insights.
🧮 How to Use the Sports KPI Scorecard Effectively
To get maximum value from your scorecard, follow these practical steps:
-
Set Clear Objectives: Define what success means for your organization — winning rates, player health, or revenue growth.
-
Choose the Right KPIs: Only track KPIs that align with your goals. Avoid data overload.
-
Maintain Data Consistency: Enter data regularly and verify accuracy before analysis.
-
Visualize Results: Use charts and conditional formatting to identify trends faster.
-
Review Periodically: Analyze data monthly or quarterly for both short-term and long-term progress.
-
Collaborate Across Teams: Share dashboards with coaching staff, management, and financial departments for holistic evaluation.
🌟 Real-World Example: Applying the Scorecard in a Sports Academy
Let’s take the example of a Football Academy using the Sports KPI Scorecard.
-
The Input Sheet contains data on player goals, fitness test scores, and injury percentages.
-
The Scorecard Sheet displays Actual vs Target results for each month.
-
The Trend Sheet visualizes the year-long progress of KPIs like “Goal Conversion Rate” and “Average Recovery Time.”
-
The KPI Definition Sheet provides clear formulas for calculating “Win Percentage” or “Average Training Hours.”
The academy uses these insights to adjust training intensity, improve player efficiency, and increase match success rates over the season.
💡 Best Practices for the Sports KPI Scorecard in Excel
To ensure your scorecard delivers reliable and actionable insights, apply these best practices.
✅ 1. Keep It Simple and Focused
Avoid overloading your scorecard with too many KPIs. Focus on 10–15 high-impact metrics that align with your performance goals.
✅ 2. Use Conditional Formatting Wisely
Visual cues such as arrows or color gradients make results easier to interpret at a glance.
✅ 3. Automate Calculations
Use Excel formulas to automatically calculate MTD, YTD, and variance values, reducing manual errors.
✅ 4. Protect Critical Cells
Lock important formula cells to prevent accidental modification, especially when sharing with multiple users.
✅ 5. Refresh Data Regularly
Ensure data inputs are updated after every game, event, or training session for accurate analysis.
✅ 6. Maintain Version Control
Save different versions (monthly or quarterly) to track historical performance.
✅ 7. Train Users
Educate your staff or team managers on how to input data correctly and interpret the results effectively.
Following these practices ensures your scorecard remains accurate, efficient, and relevant over time.
🏅 Opportunities for Improvement
Even the best systems can improve. Here are some ways to enhance your Sports KPI Scorecard:
-
Integrate Power Query to automate data imports from multiple sources.
-
Add Power BI visualization for advanced analytics.
-
Create macros for quick data refresh and reporting.
-
Implement drop-down filters for departments, teams, or player categories.
-
Add trend comparisons across multiple years.
By continuously improving your scorecard, you’ll ensure it evolves with your organization’s growing needs.
Click to Purchases Sports KPI Scorecard in Excel
🧭 Conclusion
The Sports KPI Scorecard in Excel transforms how sports organizations monitor and manage performance. It provides a comprehensive, data-driven framework that ensures every player, coach, and department performs at their best.
With its structured design, real-time analytics, and visual feedback, this scorecard not only simplifies data tracking but also fosters a culture of accountability and improvement.
Whether you manage a local club or an international sports academy, this Excel-based system helps you stay ahead, make smarter decisions, and ultimately — win more often.
❓ Frequently Asked Questions (FAQs)
1. What is a Sports KPI Scorecard used for?
It’s used to track, measure, and evaluate the performance of players, teams, and departments within a sports organization using KPIs.
2. How is this scorecard different from a dashboard?
A scorecard focuses on KPI measurement and target tracking, while a dashboard emphasizes data visualization and summary analysis.
3. Can I customize the KPIs in this Excel scorecard?
Yes, the template is fully customizable. You can add, edit, or delete KPIs according to your sport or organizational goals.
4. Is it suitable for individual sports or only teams?
It works for both. Individual athletes (like swimmers or runners) and teams (like football or basketball) can use this system effectively.
5. Do I need advanced Excel skills to use it?
No. Basic Excel knowledge is enough since most formulas and charts are automated.
6. Can I integrate this Excel file with Power BI or Google Sheets?
Yes. You can link it to Power BI for interactive reports or import it into Google Sheets for cloud-based collaboration.
7. How often should I update the data?
Ideally, after each match, tournament, or weekly performance review to maintain real-time accuracy.
8. Is the Sports KPI Scorecard cost-effective?
Absolutely. It’s a one-time Excel-based tool that eliminates the need for expensive analytics software.
9. Can this scorecard track financial and non-financial metrics?
Yes, it can handle both — from revenue tracking to player satisfaction metrics.
10. How does it help in strategic planning?
By analyzing long-term trends, organizations can set realistic goals, optimize training programs, and plan future investments.
Click to Purchases Sports KPI Scorecard in Excel
Visit our YouTube channel to learn step-by-step video tutorials