The steel and metals industry is the backbone of modern infrastructure, construction, automotive, energy, and countless other sectors. Yet, like any complex industry, it faces challenges such as fluctuating raw material prices, supply chain disruptions, and increasing demands for quality and sustainability.
To thrive in this competitive environment, organizations must measure, monitor, and optimize their performance. This is where a Steel & Metals KPI Dashboard in Excel becomes a game-changer.
Instead of manually calculating key performance indicators (KPIs) or struggling with scattered reports, companies can use this ready-to-use Excel dashboard to track operations, productivity, quality, and profitability.
In this article, we will explore the structure, features, benefits, and best practices of using a Steel & Metals KPI Dashboard in Excel. We will also provide practical insights into why it matters and how it can transform decision-making in your business.
Click to Purchases Steel & Metals KPI Dashboard in Excel
What Is a Steel & Metals KPI Dashboard in Excel?
A Steel & Metals KPI Dashboard is an Excel-based performance management tool that consolidates all critical industry KPIs into a single, interactive interface. It helps managers and executives quickly analyze performance trends, identify issues, and take corrective action.
Unlike static spreadsheets, this dashboard offers dynamic views with slicers, charts, and conditional formatting that make data easy to interpret. Whether you want to monitor monthly production efficiency, track cost variances, or evaluate sustainability metrics, the dashboard provides instant insights.
Key Features of the Steel & Metals KPI Dashboard
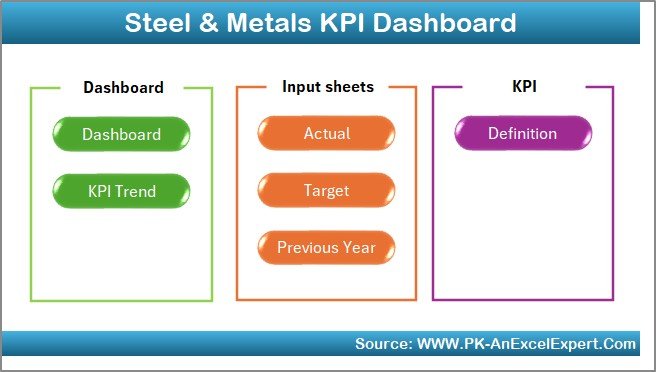
This dashboard template comes with 7 well-structured worksheets, each designed to handle a specific function. Let’s explore them one by one.
Click to Purchases Steel & Metals KPI Dashboard in Excel
1. Home Sheet: The Command Center
-
Acts as the index page for the dashboard.
-
Includes 6 clickable buttons that allow you to jump directly to different sheets.
-
Provides a user-friendly navigation system, ensuring quick access to reports.
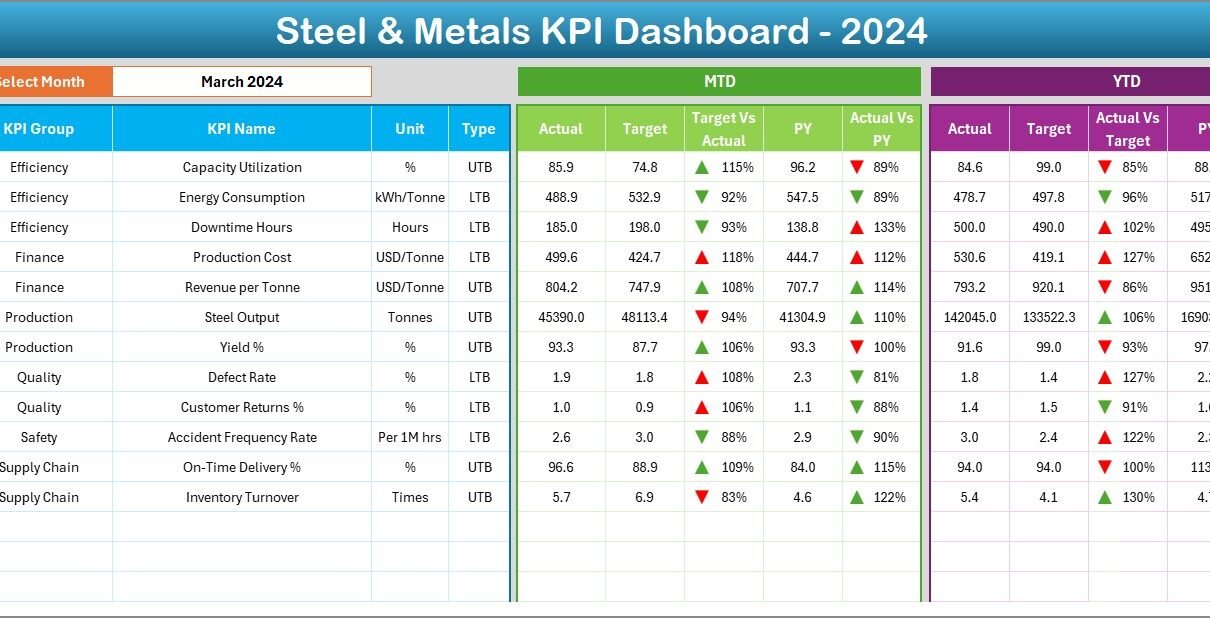
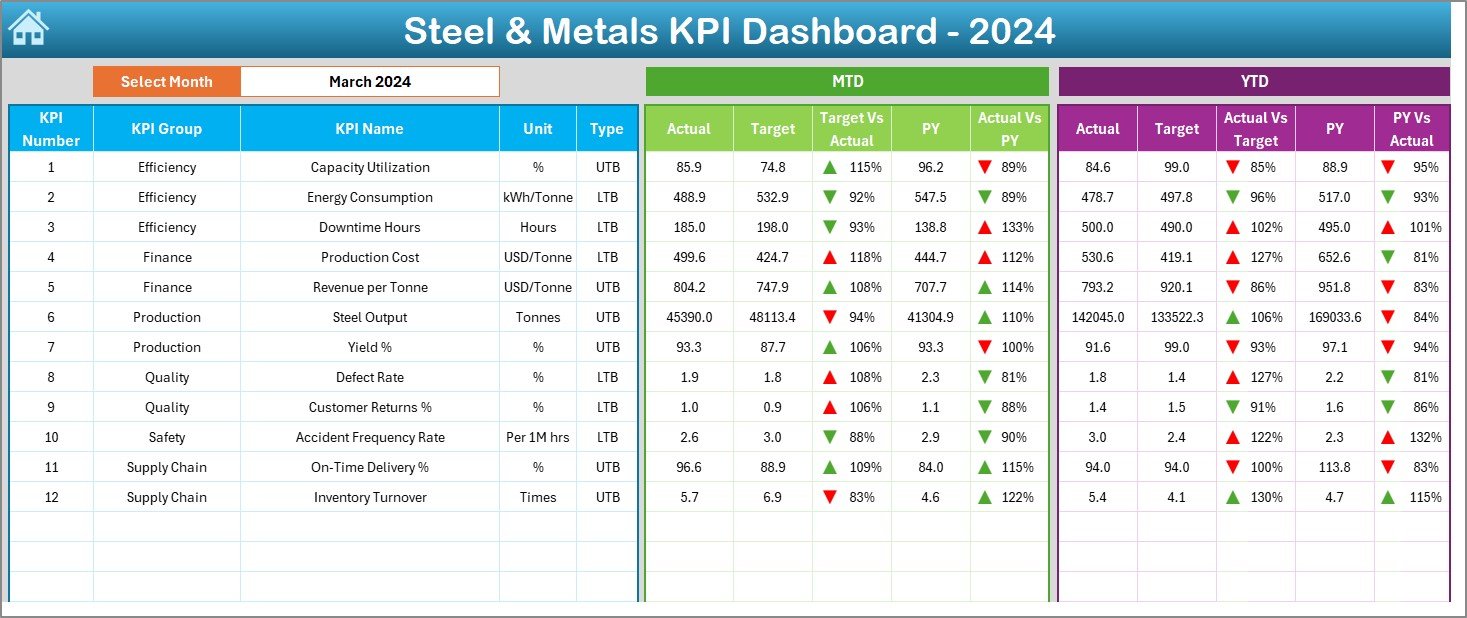
2. Dashboard Sheet Tab: Centralized KPI View
-
The main dashboard tab where all KPI results are displayed.
-
Includes a month selector in range D3, allowing users to filter results dynamically.
-
Displays MTD (Month-to-Date) and YTD (Year-to-Date) Actuals, Targets, and Previous Year (PY) data.
-
Visualizes performance with conditional formatting arrows (up/down) for quick comparison.
-
Offers insights into both short-term and long-term performance trends.
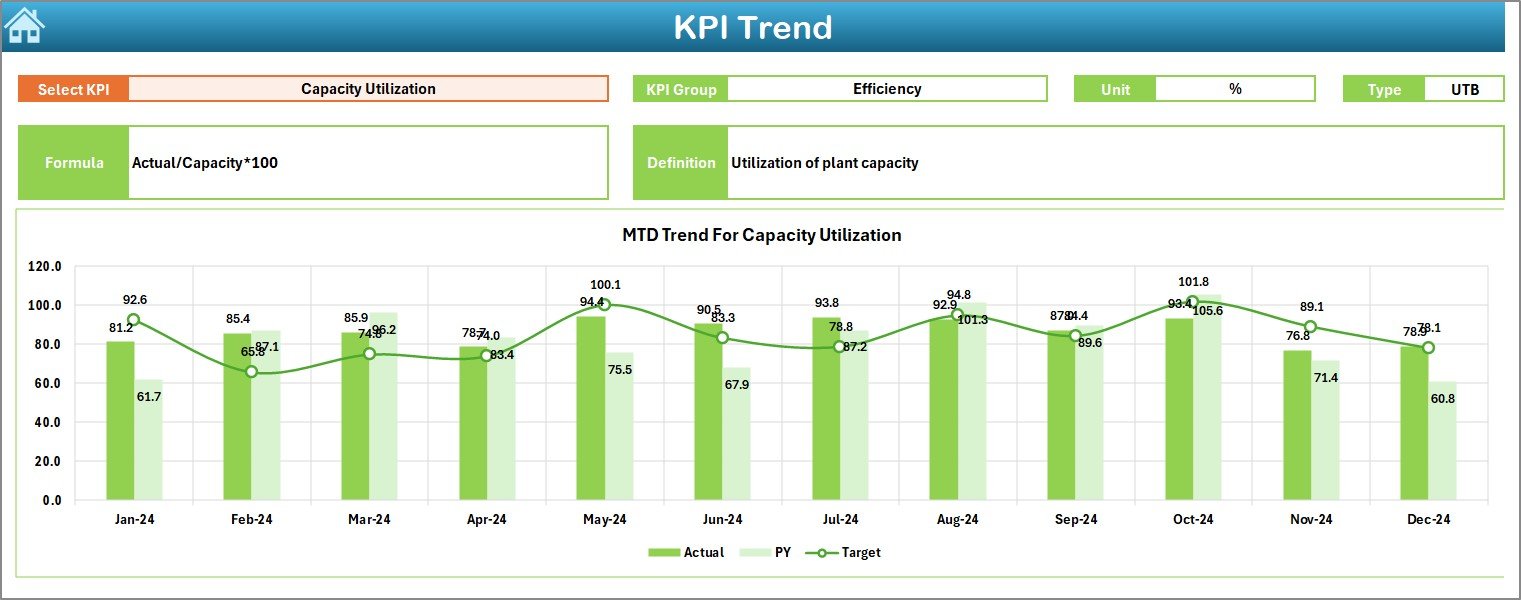
3. KPI Trend Sheet Tab: Deep Dive into Metrics
-
Allows selection of any KPI from a drop-down menu (range C3).
-
Displays details like KPI Group, Unit, Formula, Type (Lower the Better or Upper the Better), and Definition.
-
Provides trend charts for MTD and YTD performance against targets and previous years.
-
Enables better understanding of whether issues are short-term anomalies or long-term trends.
4. Actual Numbers Input Sheet
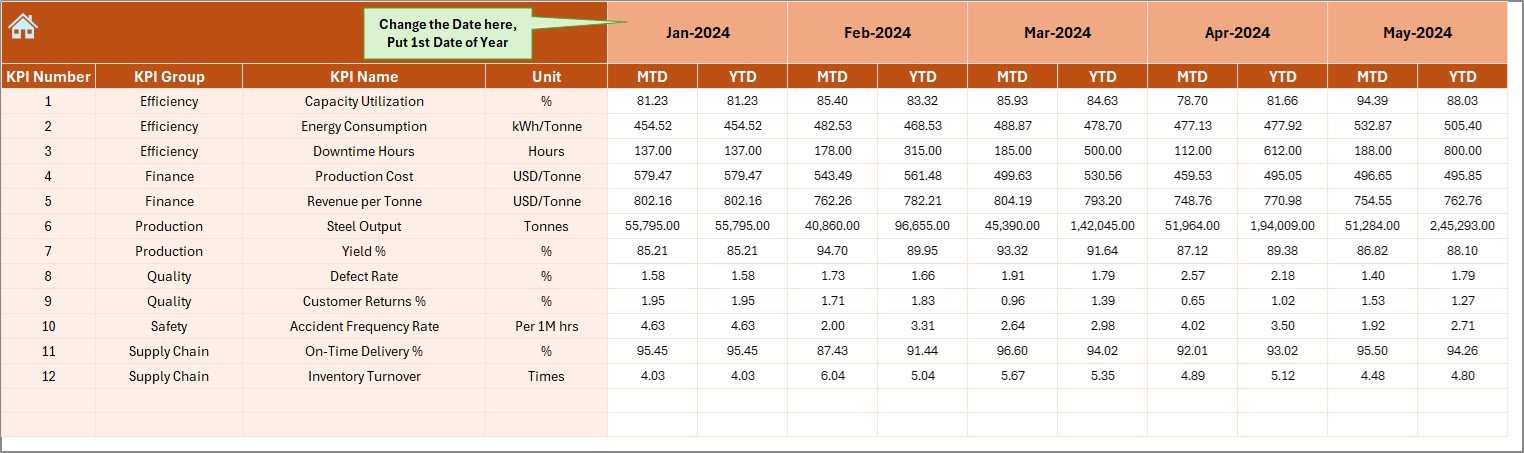
-
A dedicated input sheet for recording actual performance data.
-
Data is entered for both MTD and YTD values.
-
Month range (E1) allows quick switching of time periods.
-
Ensures that the dashboard always stays updated with the latest figures.
5. Target Sheet Tab
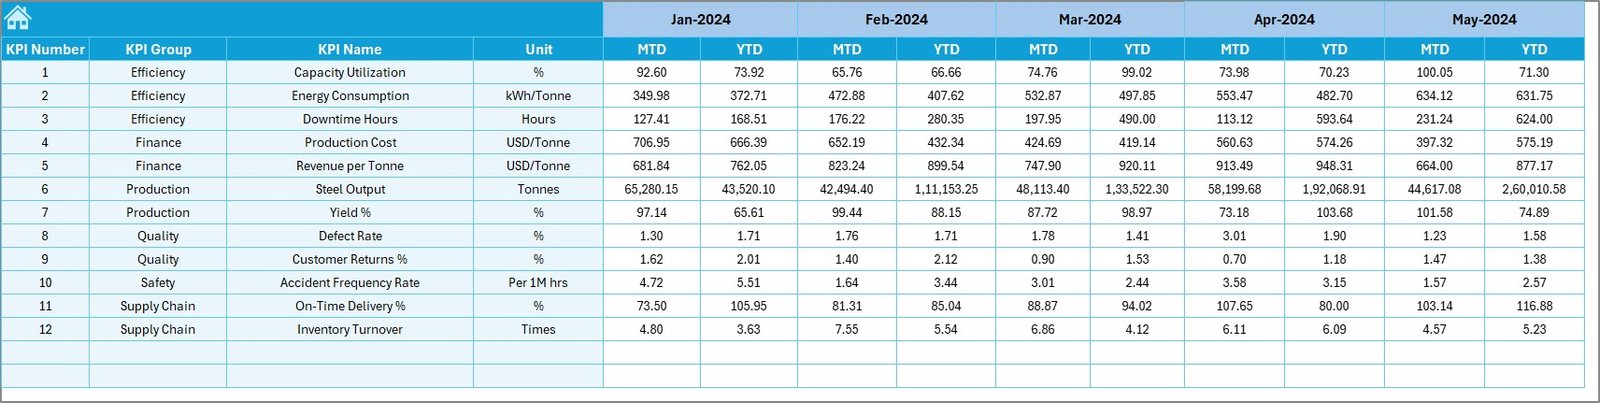
-
Stores target values for each KPI.
-
Supports both MTD and YTD targets.
-
Helps set clear benchmarks for comparison with actual results.
6. Previous Year Number Sheet Tab
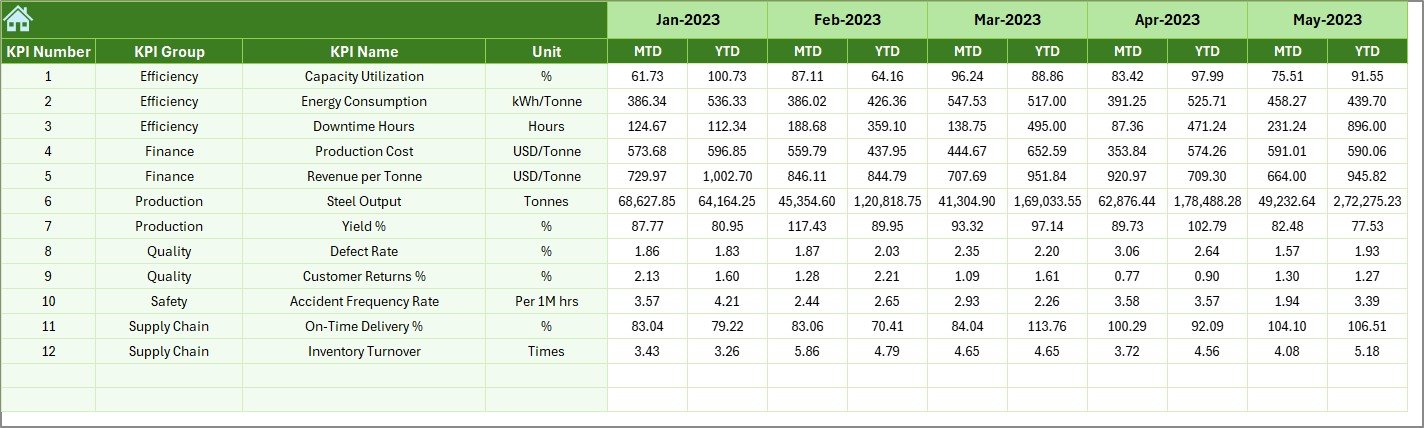
-
Stores historical data from the previous year.
-
Crucial for year-over-year comparisons, trend analysis, and forecasting.
-
Provides a solid benchmark for evaluating progress.
7. KPI Definition Sheet Tab
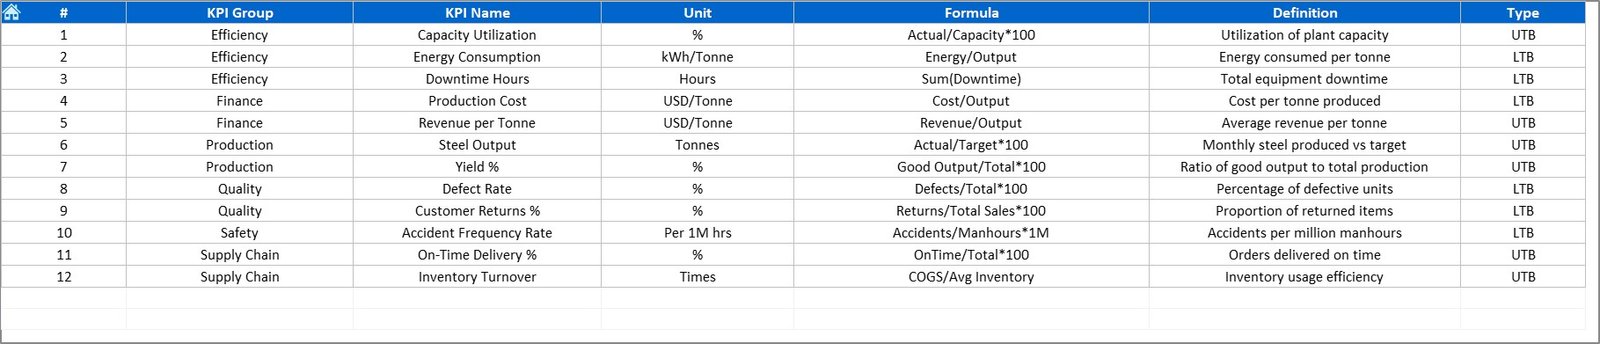
-
Contains a structured dictionary of all KPIs.
-
Includes fields like KPI Name, Group, Unit, Formula, and Definition.
-
Ensures consistency across departments by standardizing KPI definitions.
Why Use a KPI Dashboard in the Steel & Metals Industry?
The steel and metals industry is extremely data-driven. Small inefficiencies in production, supply chain, or quality control can lead to massive losses. Using a KPI dashboard provides:
-
Real-time insights for faster decision-making
-
Transparent performance tracking across departments
-
Data accuracy by avoiding manual errors
-
Benchmarking against historical and target data
-
Continuous improvement opportunities
Advantages of Steel & Metals KPI Dashboard in Excel
Using this dashboard offers several benefits for managers and business leaders:
-
📊 Holistic View: Combines multiple KPIs into one place.
-
⚡ Faster Decision-Making: Conditional formatting instantly highlights problem areas.
-
📈 Trend Analysis: Historical vs. target comparisons make forecasting easier.
-
🔍 Error Reduction: Automated calculations reduce manual mistakes.
-
💰 Cost Savings: Excel-based solution saves money compared to expensive BI tools.
-
🔄 Flexibility: Can be customized for different plants, product lines, or departments.
-
✅ Ease of Use: No technical expertise needed – just Excel skills.
Opportunities for Improvement
While this Excel-based KPI Dashboard is powerful, there are opportunities for further enhancement:
-
🌐 Integration with ERP/SCM Systems: Automating data flow reduces manual updates.
-
📡 Cloud Access: Migrating to cloud-based Excel or Power BI improves collaboration.
-
📊 Advanced Visualizations: Adding interactive slicers and dynamic charts enhances usability.
-
🛠 Automation with VBA: Reduces repetitive tasks and ensures faster reporting cycles.
-
🔒 Data Security: Incorporating user-level access can help protect sensitive information.
Best Practices for the Steel & Metals KPI Dashboard
To get maximum value, organizations should follow these best practices:
✅ Define KPIs Clearly: Standardize definitions in the KPI Definition sheet.
✅ Keep Data Updated: Enter actuals and targets regularly for accurate insights.
✅ Focus on Actionable KPIs: Track metrics that directly impact performance.
✅ Leverage Visuals: Use conditional formatting, trend lines, and charts for clarity.
✅ Compare with Benchmarks: Use PY data to set realistic goals.
✅ Automate When Possible: Use Excel formulas, pivot tables, and macros to save time.
Real-World Applications of the Dashboard
This dashboard can be used across various functions in the steel and metals industry:
-
Production Teams: Monitor output efficiency, downtime, and scrap rates.
-
Quality Teams: Track defect percentages and compliance with standards.
-
Supply Chain Teams: Evaluate raw material lead times and logistics performance.
-
Finance Teams: Compare production costs against budgets.
-
Executives: Get a bird’s-eye view of business health.
How This Dashboard Transforms Decision-Making
Before using dashboards, managers often relied on lengthy reports or gut-based decisions. With this Excel-based KPI Dashboard:
-
They can instantly see variances in production or costs.
-
They can identify trends and take preventive measures.
-
They can align targets across departments for greater consistency.
-
They can track performance transparently, ensuring accountability.
Conclusion
The Steel & Metals KPI Dashboard in Excel is more than just a reporting template – it is a strategic decision-making tool. By consolidating key performance indicators, providing interactive insights, and enabling real-time comparisons, it empowers businesses to stay competitive in a demanding industry.
With structured sheets for input, targets, and definitions, this dashboard ensures clarity, consistency, and accuracy. Organizations that adopt it can expect improved efficiency, reduced costs, and stronger performance visibility.
Click to Purchases Steel & Metals KPI Dashboard in Excel
Frequently Asked Questions (FAQs)
1. What is the purpose of the Steel & Metals KPI Dashboard?
It helps organizations monitor and analyze KPIs like production, costs, and quality in a single Excel-based system.
2. Can this dashboard be customized?
Yes, it is flexible and can be tailored for different departments, KPIs, or plants.
3. Do I need advanced Excel skills to use it?
No. Basic Excel knowledge is enough to use the dashboard. However, advanced skills can help in further customization.
4. How often should the data be updated?
For accurate results, update MTD and YTD figures regularly – preferably on a monthly basis.
5. Can I integrate it with ERP systems?
Yes, with some automation or data connection features in Excel, you can link it with ERP or SCM systems for real-time updates.
6. Why not use Power BI or other BI tools instead?
Excel dashboards are cost-effective, easy to use, and widely accessible. However, large enterprises with complex needs may prefer BI tools for scalability.
Visit our YouTube channel to learn step-by-step video tutorials
Click to Purchases Steel & Metals KPI Dashboard in Excel

