Subscription box businesses continue to grow rapidly across industries such as beauty, food, fitness, lifestyle, books, and digital services. However, as subscriber counts increase, managing performance using scattered spreadsheets becomes difficult. Therefore, subscription box companies need a centralized, structured, and easy-to-use KPI dashboard to track growth, retention, revenue, and operational efficiency.
That is exactly where the Subscription Box Services KPI Dashboard in Excel plays a critical role.
In this detailed and SEO-friendly article, you will learn what a Subscription Box Services KPI Dashboard in Excel is, why it is important, how it works, its worksheet-wise structure, key features, advantages, opportunities for improvement, best practices, and frequently asked questions. Moreover, the language remains simple, active, and business-focused, making this guide useful for founders, managers, analysts, and operations teams.
Click to Purchases Subscription Box Services KPI Dashboard in Excel
What Is a Subscription Box Services KPI Dashboard in Excel?
A Subscription Box Services KPI Dashboard in Excel is a ready-to-use performance tracking tool designed to monitor key metrics related to subscription-based businesses. It consolidates subscriber, revenue, retention, and operational KPIs into a single Excel file with interactive visuals, comparisons, and trends.
Instead of reviewing multiple Excel sheets or manual reports, this dashboard presents MTD (Month-to-Date) and YTD (Year-to-Date) performance in a clear and structured format. As a result, business owners can quickly identify growth opportunities, performance gaps, and operational issues.
Because the dashboard is built entirely in Excel, it remains easy to use, customize, and share without requiring any advanced software.
Why Do Subscription Box Businesses Need a KPI Dashboard?
Subscription businesses operate on recurring revenue models, where small changes in churn, retention, or fulfillment costs can significantly impact profitability. Therefore, tracking the right KPIs becomes essential.
A Subscription Box Services KPI Dashboard in Excel helps because:
-
It provides clear visibility into subscription performance
-
It tracks MTD and YTD growth trends
-
It compares actual vs target performance
-
It highlights underperforming KPIs using visual indicators
-
It supports data-driven planning and forecasting
As a result, subscription box businesses gain better control over growth, costs, and customer experience.
Click to Purchases Subscription Box Services KPI Dashboard in Excel
What KPIs Can Be Tracked Using This Dashboard?
This dashboard supports a wide range of subscription box KPIs. Because KPI definitions are configurable, businesses can tailor metrics to their specific model.
Common KPI groups include:
-
Subscriber Growth KPIs
-
Revenue & ARPU KPIs
-
Churn & Retention KPIs
-
Fulfillment & Operations KPIs
-
Customer Experience KPIs
-
Marketing & Acquisition KPIs
Since all KPIs are managed through a KPI Definition sheet, teams can easily add or modify KPIs without changing the dashboard layout.
Key Features of the Subscription Box Services KPI Dashboard in Excel
This dashboard is designed with practicality and usability in mind. Below are the key features explained clearly.
How Many Worksheets Are Included in the Dashboard?
The Subscription Box Services KPI Dashboard in Excel includes 7 well-structured worksheets, each serving a specific purpose.
What Is the Role of the Home Sheet?
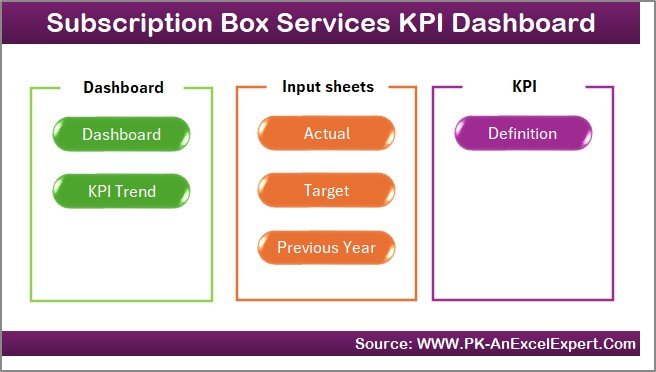
The Home Sheet acts as an index or navigation page.
Key Highlights of the Home Sheet
-
🧭 Acts as a central navigation hub
-
🔘 Contains 6 clickable buttons
-
➡️ Allows users to jump directly to any worksheet
This sheet improves usability and makes the dashboard easy to navigate, especially for non-technical users.
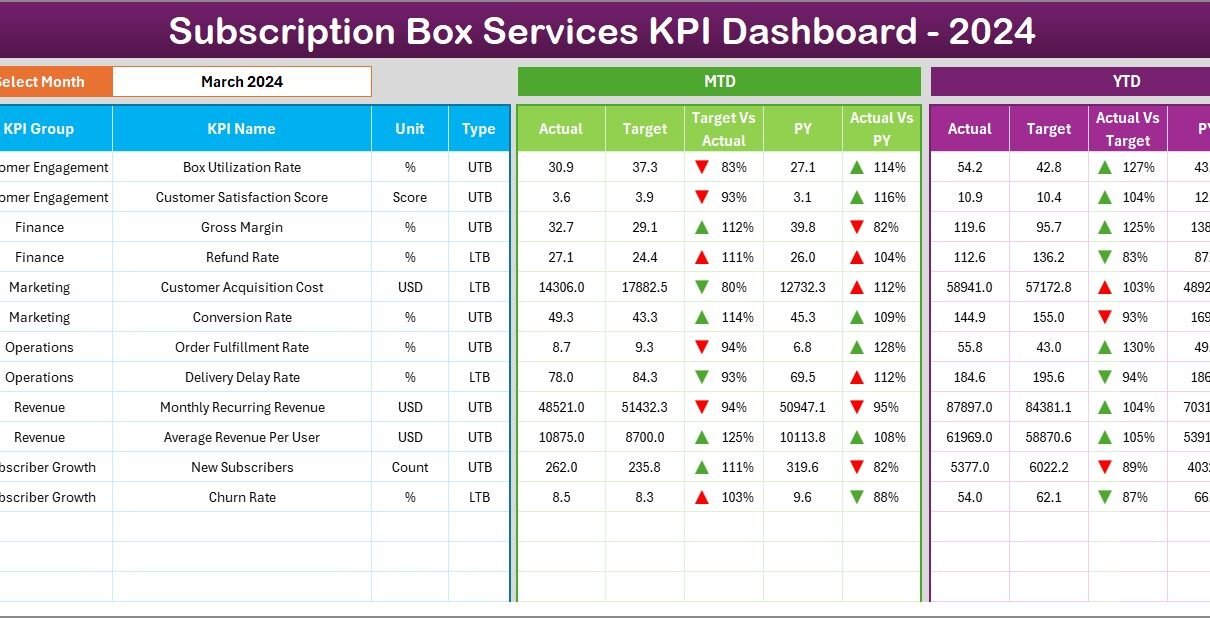
What Does the Dashboard Sheet Show?
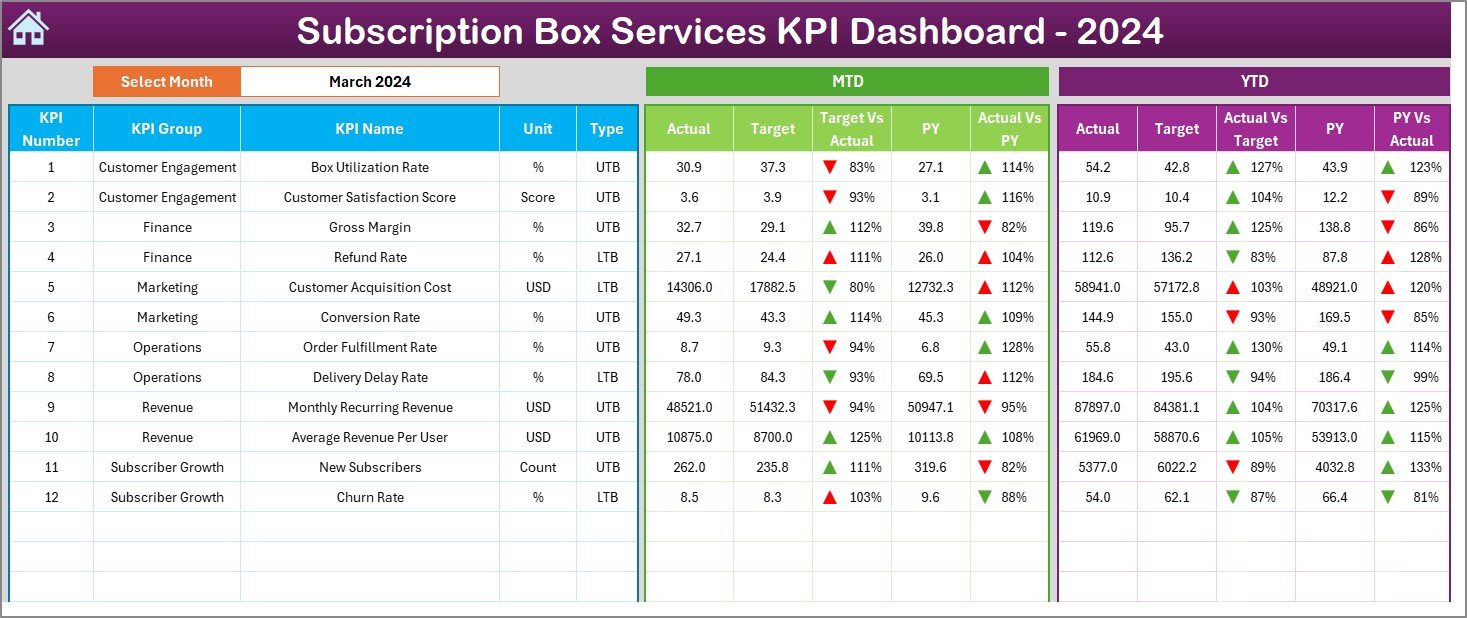
The Dashboard Sheet is the main analytical page where all KPI performance information appears.
Key Features of the Dashboard Sheet
-
📅 Month Selection (Cell D3)
Users can select the month from a drop-down list. As soon as the month changes, all dashboard values update automatically. -
📊 MTD Performance Section
-
MTD Actual
-
MTD Target
-
MTD Previous Year
-
Target vs Actual %
-
PY vs Actual %
-
Conditional formatting with ▲ / ▼ arrows
-
-
📈 YTD Performance Section
-
YTD Actual
-
YTD Target
-
YTD Previous Year
-
Target vs Actual %
-
PY vs Actual %
-
Conditional formatting with ▲ / ▼ arrows
-
Because of this structure, users can instantly understand how subscription performance compares against targets and historical results.
Click to Purchases Subscription Box Services KPI Dashboard in Excel
How Does the KPI Trend Sheet Help in Analysis?
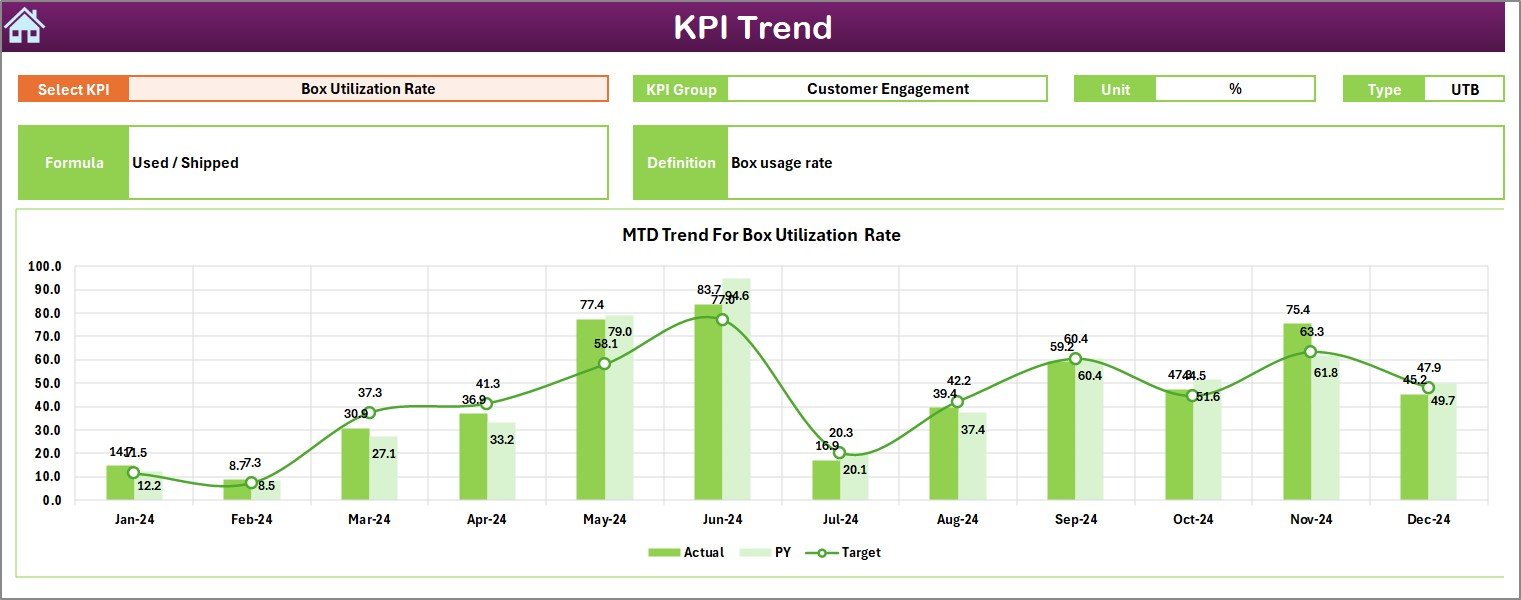
The KPI Trend Sheet focuses on trend-based analysis for individual KPIs.
Key Elements of the KPI Trend Sheet
-
🎯 KPI Selection (Cell C3) – Select a KPI from the drop-down
-
📌 Displays:
-
KPI Group
-
KPI Unit
-
KPI Type (LTB / UTB)
-
KPI Formula
-
KPI Definition
-
-
📉 MTD Trend Chart
-
Actual
-
Target
-
Previous Year
-
-
📈 YTD Trend Chart
-
Actual
-
Target
-
Previous Year
-
These charts help users understand whether performance improves, declines, or stays stable over time.
Click to Purchases Subscription Box Services KPI Dashboard in Excel
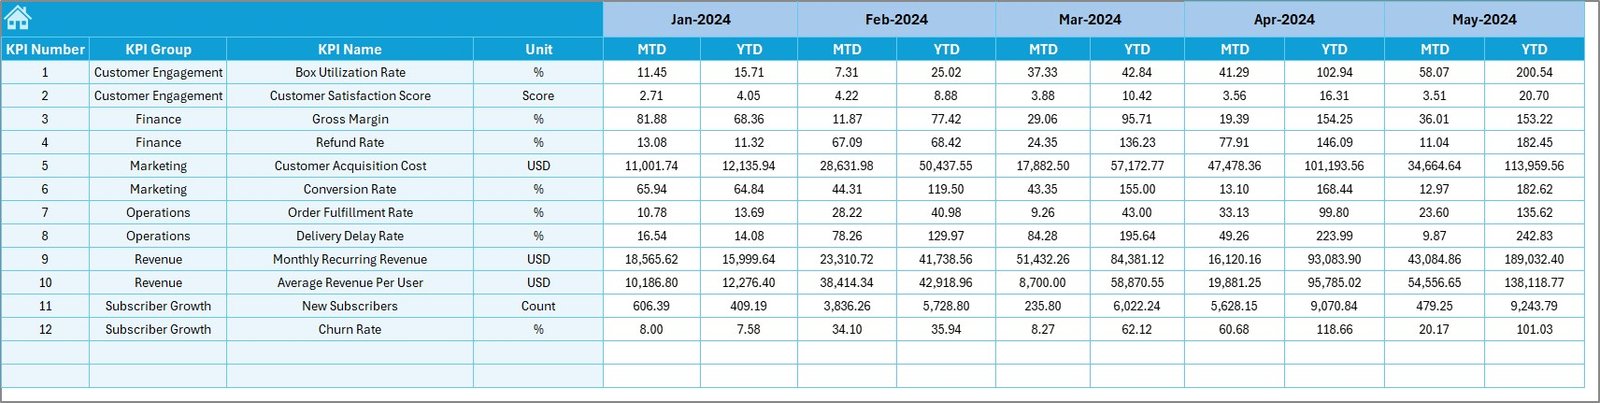
What Is the Purpose of the Actual Numbers Input Sheet?

The Actual Numbers Input Sheet is where users enter real performance data.
What Data Goes Into This Sheet?
-
📅 Month selector (Cell E1 – first month of the year)
-
KPI-wise:
-
MTD Actual values
-
YTD Actual values
-
This sheet captures actual business performance and acts as the foundation for all calculations.
What Does the Target Sheet Contain?
The Target Sheet stores expected performance benchmarks.
Key Inputs in the Target Sheet
-
KPI-wise:
-
MTD Target values
-
YTD Target values
-
By maintaining targets separately, businesses can easily revise goals without affecting historical data.
Why Is the Previous Year Number Sheet Important?
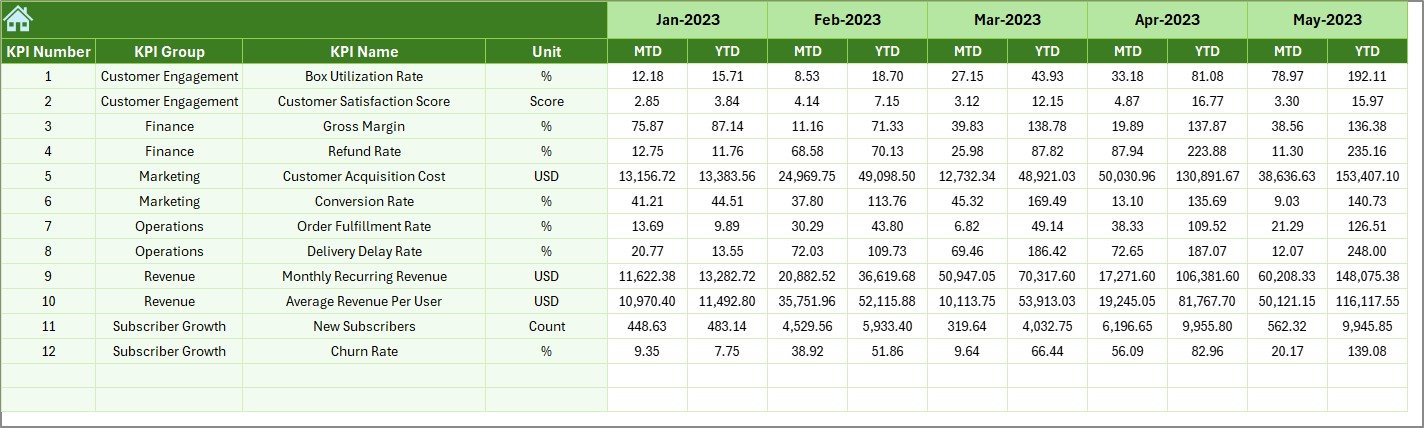
The Previous Year Number Sheet allows year-over-year comparison.
What Should Be Entered Here?
-
KPI-wise:
-
Previous Year MTD values
-
Previous Year YTD values
-
This sheet enables trend comparison and growth analysis across years.
What Is the Role of the KPI Definition Sheet?
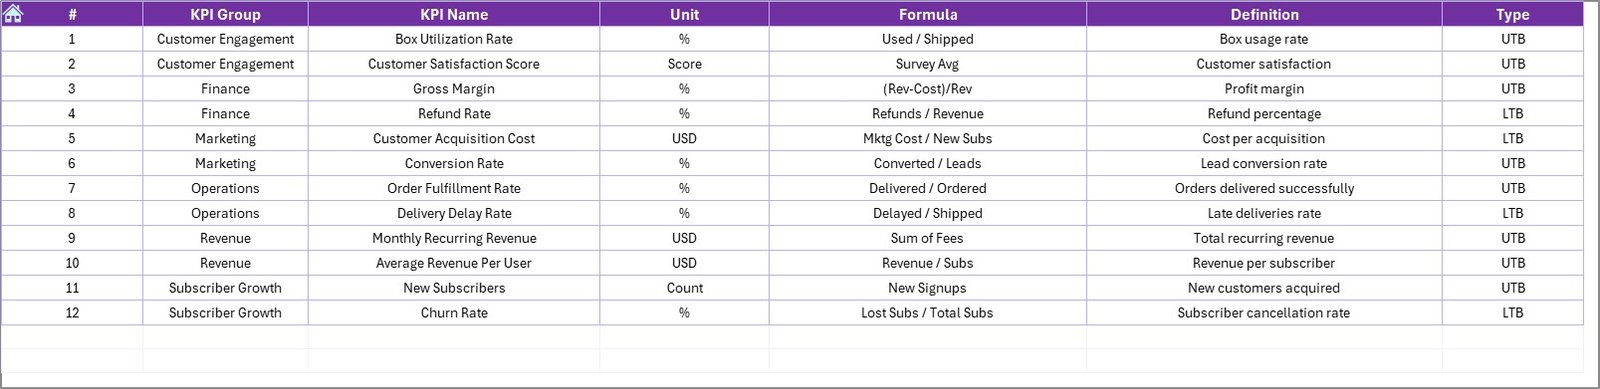
The KPI Definition Sheet acts as the backbone of the dashboard.
Key Fields in the KPI Definition Sheet
-
KPI Name
-
KPI Group
-
Unit
-
Formula
-
KPI Definition
Because all KPIs are defined here, the dashboard remains flexible and scalable.
How Does This Dashboard Improve Subscription Box Performance?
This dashboard improves subscription box performance because it:
-
Centralizes all KPIs in one file
-
Reduces manual reporting effort
-
Highlights problem areas quickly
-
Improves management review meetings
-
Supports data-driven decision-making
As a result, businesses can focus more on strategy and less on reporting.
Click to Purchases Subscription Box Services KPI Dashboard in Excel
Advantages of the Subscription Box Services KPI Dashboard in Excel
Below are the key advantages, explained clearly:
📊 Centralized KPI Tracking – All metrics in one dashboard
⏱️ Time-Saving Reporting – No repetitive calculations
🎯 Clear Target Visibility – Actual vs target comparisons
📈 Trend Analysis – MTD and YTD insights
🔄 Easy Updates – Simple Excel-based inputs
👥 User-Friendly Design – Suitable for non-technical users
💰 Cost-Effective Solution – No expensive software required
Opportunities for Improvement in the Dashboard
Although the dashboard is powerful, further enhancements can add more value:
➕ Add subscriber cohort analysis
➕ Include churn reason tracking
➕ Add product-wise or box-wise performance
➕ Include marketing channel attribution
➕ Automate data input using integrations
These improvements can elevate the dashboard to an advanced analytics level.
Click to Purchases Subscription Box Services KPI Dashboard in Excel
Best Practices for the Subscription Box Services KPI Dashboard in Excel
To maximize dashboard value, follow these best practices:
✅ Define KPIs clearly and consistently
✅ Update actual, target, and PY data regularly
✅ Avoid tracking too many KPIs
✅ Focus on actionable metrics
✅ Review trends, not just single-month results
✅ Train users on KPI interpretation
By following these practices, teams ensure reliable and meaningful insights.
Who Can Use This Dashboard?
This dashboard benefits a wide range of users:
-
Subscription Box Founders
-
Operations Managers
-
Finance Teams
-
Marketing Managers
-
Business Analysts
-
Startup Consultants
Because of its flexible design, both startups and mature subscription businesses can use it effectively.
Why Use Excel for Subscription KPI Dashboards?
Excel remains a preferred tool because:
-
It is widely available
-
It is easy to customize
-
It supports structured data
-
It works without technical dependencies
Therefore, Excel-based dashboards remain practical and scalable for many businesses.
Conclusion
The Subscription Box Services KPI Dashboard in Excel provides a structured, visual, and easy-to-use solution for tracking subscription business performance. By combining MTD and YTD metrics, target comparisons, trend analysis, and KPI definitions, this dashboard turns raw data into actionable insights.
Moreover, its seven-sheet structure ensures clarity, flexibility, and scalability. When used with best practices, this dashboard helps subscription box businesses improve growth, retention, and operational efficiency.
Click to Purchases Subscription Box Services KPI Dashboard in Excel
Frequently Asked Questions (FAQs)
What is a Subscription Box Services KPI Dashboard in Excel?
It is an Excel-based dashboard designed to track subscription business KPIs using MTD and YTD metrics.
Can I customize KPIs in this dashboard?
Yes, you can add or modify KPIs using the KPI Definition sheet.
Do I need advanced Excel skills to use this dashboard?
No, basic Excel knowledge is sufficient.
How often should data be updated?
Ideally, data should be updated monthly.
Can this dashboard work for small subscription startups?
Yes, it works for both small startups and growing businesses.
Does the dashboard support year-over-year comparison?
Yes, it includes previous year comparisons for MTD and YTD.
Can I add charts or KPIs later?
Yes, the dashboard structure supports easy expansion.
Click to Purchases Subscription Box Services KPI Dashboard in Excel
Visit our YouTube channel to learn step-by-step video tutorials