In today’s fast-paced business environment, sustainability in supply chain and logistics is no longer optional—it’s essential. Companies worldwide are under immense pressure to reduce emissions, minimize waste, optimize fuel usage, and operate responsibly. But how do you track progress and stay accountable?
That’s where a Supply Chain and Logistics Sustainability KPI Dashboard in Excel comes into play. This powerful, easy-to-use tool offers real-time visibility into sustainability metrics—right from carbon footprint to packaging waste. And the best part? You don’t need any expensive software to make it happen.
In this comprehensive article, you’ll learn everything about setting up and using a sustainability KPI dashboard in Excel, why it’s important, how it works, best practices, and answers to common questions.
Click to Purchases Supply Chain and Logistics Sustainability KPI Dashboard in Excel
What Is a Supply Chain and Logistics Sustainability KPI Dashboard?
A Supply Chain and Logistics Sustainability KPI Dashboard is a centralized tool designed in Microsoft Excel to monitor, analyze, and visualize key sustainability indicators. These indicators span across different aspects of your supply chain, such as:
-
Carbon emissions
-
Fuel efficiency
-
Waste management
-
Packaging sustainability
-
Supplier compliance
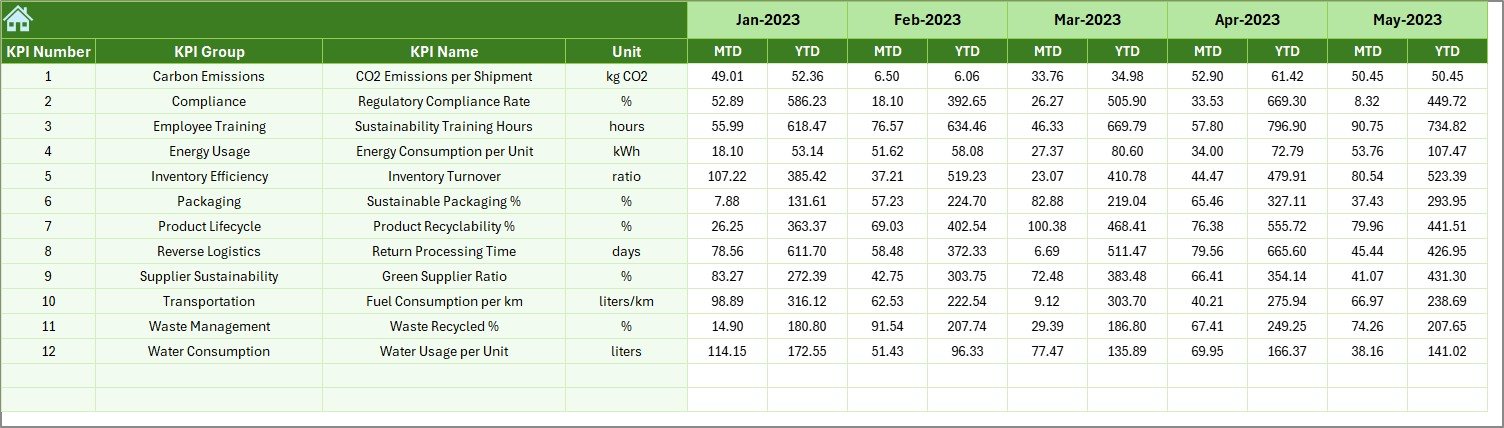
The dashboard allows companies to track MTD (Month-to-Date) and YTD (Year-to-Date) numbers, compare them with targets, and assess performance against the previous year. This leads to smarter, more responsible decisions across the supply chain.
Why Use Excel for Sustainability KPI Tracking?
You might be wondering, “Why Excel?” Well, Excel offers an incredibly flexible, cost-effective, and universally accessible platform for dashboard creation. Here’s why Excel is the perfect fit:
-
No expensive licenses required
-
Customizable for your unique KPIs
-
Easy to update and maintain
-
Compatible with existing business processes
-
Interactive visualizations with charts and slicers
Inside the Excel Sustainability KPI Dashboard – Explained
This ready-to-use Excel dashboard contains seven organized worksheets, each playing a critical role in sustainability reporting. Let’s explore each one in detail:
Home Sheet – Your Navigation Hub
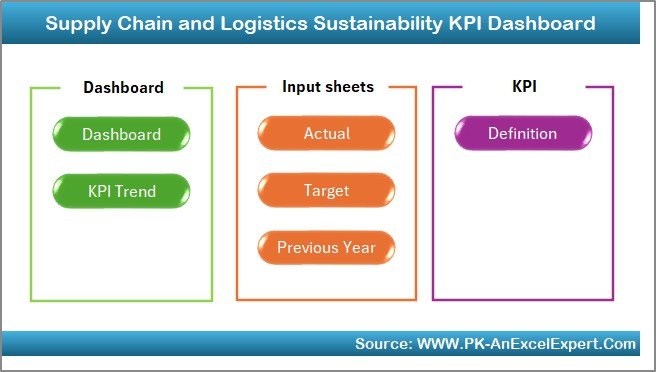
The Home Sheet acts as an index page. It includes 6 clickable buttons that help you jump directly to any section of the dashboard. This enhances user experience and saves valuable time.
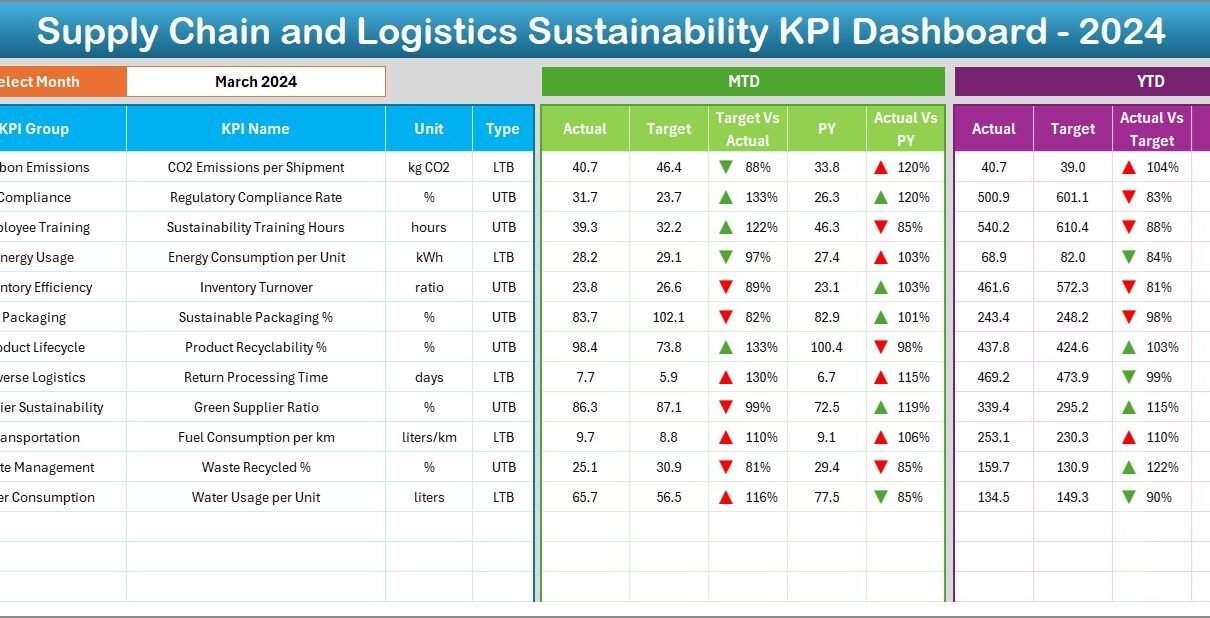
Dashboard Sheet Tab – The Main Control Room
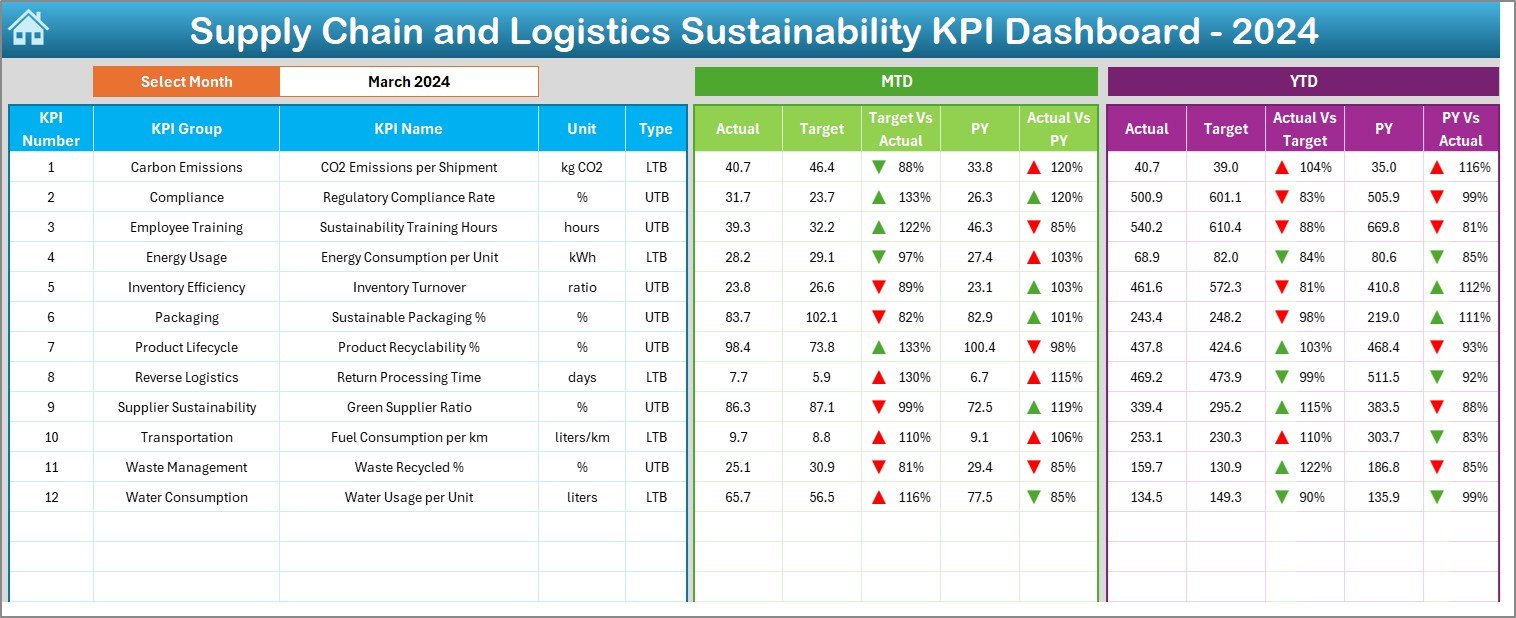
This is the heart of the entire dashboard. Here, you get a snapshot of all KPIs across different months.
-
Use the dropdown menu in cell D3 to select the desired month.
-
Instantly view MTD and YTD Actuals, Targets, and Previous Year values.
-
Visual up and down arrows (via conditional formatting) quickly highlight areas of improvement or concern.
-
Side-by-side comparisons of Target vs Actual and Previous Year vs Actual ensure full visibility and accountability.
KPI Trend Sheet – Deep Dive into Metrics
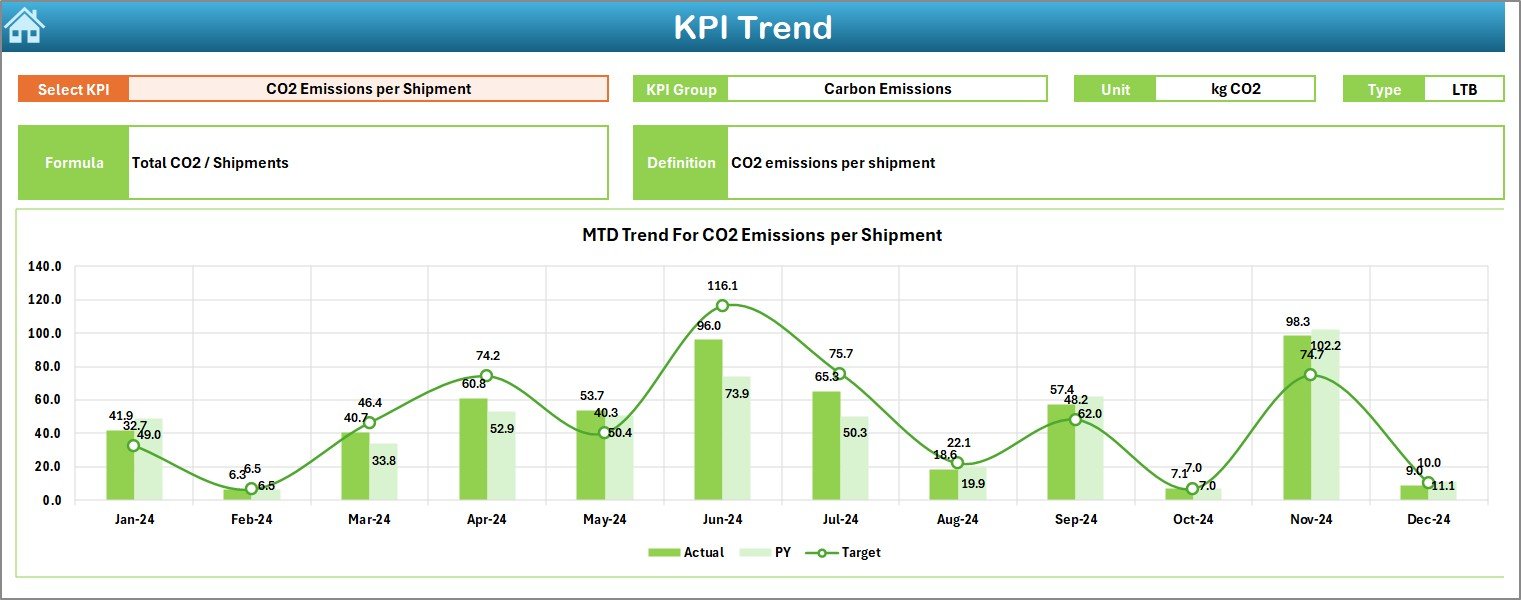
Want to see how a specific KPI is performing over time? The KPI Trend Sheet makes this super easy:
-
Choose a KPI from the dropdown in cell C3.
-
Instantly see its KPI Group, Unit, Formula, Definition, and whether it’s UTB (Upper the Better) or LTB (Lower the Better).
-
View MTD and YTD trend charts comparing Actual, Target, and Previous Year numbers.
This sheet is crucial for spotting patterns, identifying bottlenecks, and forecasting performance.
Click to Purchases Supply Chain and Logistics Sustainability KPI Dashboard in Excel
Actual Numbers Input Sheet – Your Data Gateway
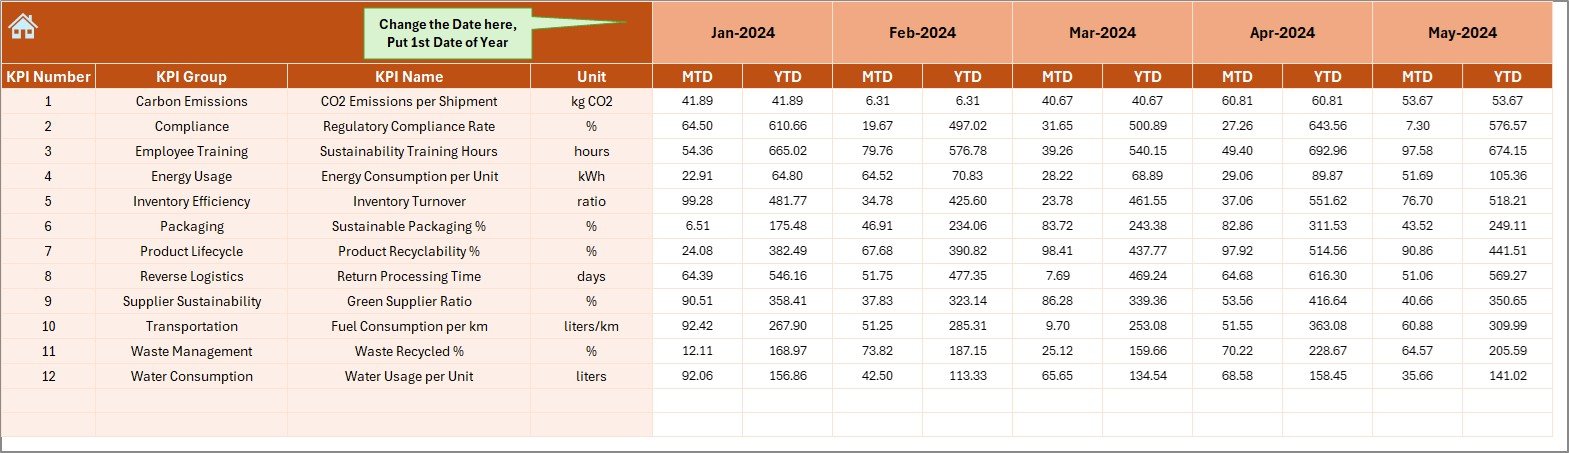
Inputting data is seamless here:
-
Use cell E1 to select the starting month of the fiscal year.
-
Enter MTD and YTD actuals for each KPI on a month-by-month basis.
-
This is the only manual data entry sheet, making the process smooth and error-free.
Target Sheet Tab – Set Your Goals
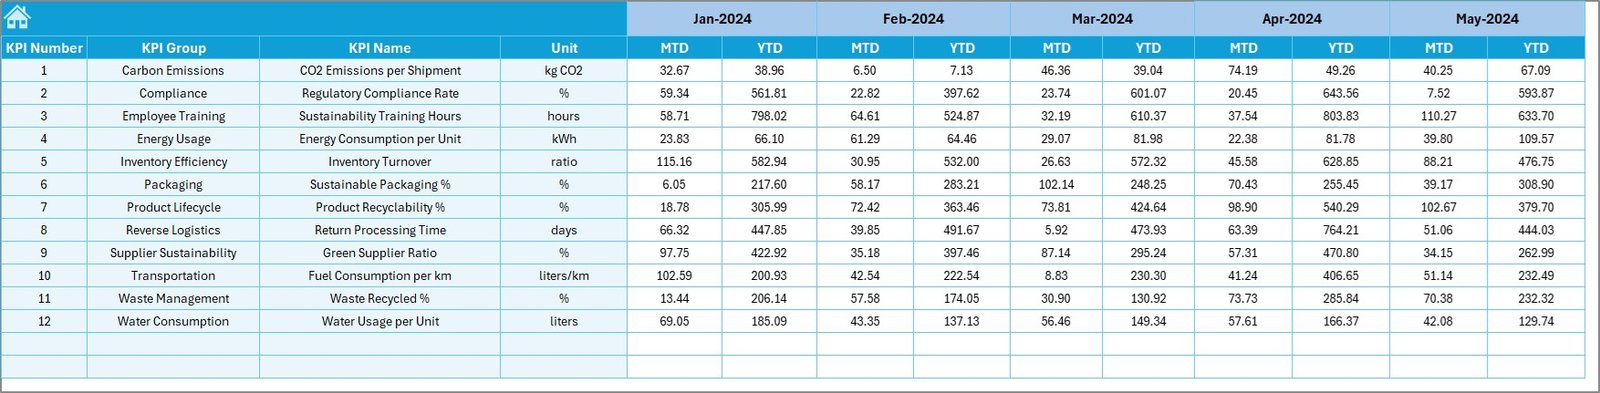
Use this sheet to define your monthly MTD and YTD target numbers for each KPI.
-
Clear separation between KPIs and months.
-
Helps establish realistic and achievable goals.
-
Keeps your sustainability strategy aligned with corporate objectives.
Previous Year Numbers Sheet – Historical Insights
Looking at how you performed last year is vital. This sheet lets you enter Previous Year MTD and YTD values.
-
Enables side-by-side comparison with current performance.
-
Identifies long-term improvements and declines.
Advantages of a Supply Chain Sustainability KPI Dashboard
There are countless benefits of using this type of dashboard. Some of the key ones include:
-
♻️ Improved Environmental Responsibility
Quickly measure and reduce your environmental impact. -
📉 Cost Savings
Sustainable operations often lead to reduced energy, packaging, and transportation costs. -
📈 Enhanced Decision-Making
Real-time KPI monitoring allows you to adjust strategies before problems escalate. -
📋 Regulatory Compliance
Stay ahead of legal requirements related to emissions, waste disposal, and energy usage. -
🔄 Continuous Improvement
Track progress year over year and make strategic improvements based on trends.
Best Practices for Using the Excel KPI Dashboard
To get the most out of your dashboard, follow these tried-and-tested best practices:
1. Keep It Simple and Scannable
Avoid clutter. Use clear labels, easy-to-read charts, and consistent formatting.
2. Update Data Regularly
Update your actuals, targets, and previous year numbers every month to maintain accuracy.
3. Use Conditional Formatting Effectively
Visual cues like up/down arrows or color highlights are incredibly effective in drawing attention to performance gaps.
4. Customize KPIs to Your Needs
Not every business is the same. Tailor your KPIs based on your industry and sustainability goals.
5. Involve All Stakeholders
Make sure the dashboard is accessible and understandable to logistics managers, sustainability officers, and executives alike.
How to Get Started
If you’re ready to elevate your sustainability tracking, just download the Supply Chain and Logistics Sustainability KPI Dashboard in Excel from our store or create one yourself using the structure above.
Set your KPIs, feed your data, and you’re all set to track and improve your sustainable supply chain practices!
Conclusion
In conclusion, sustainability is no longer just a buzzword—it’s a business necessity. With the right tools in place, you can not only track your progress but actively improve it. The Supply Chain and Logistics Sustainability KPI Dashboard in Excel gives you full visibility, keeps you compliant, and empowers better decisions—without the cost of fancy software.
❓ Frequently Asked Questions (FAQs)
Q1: What KPIs should I include in a Supply Chain Sustainability Dashboard?
You can include metrics such as:
-
CO2 Emissions per shipment
-
Packaging waste generated
-
Fuel consumption per ton-km
-
% of recyclable packaging
-
Supplier sustainability score
Q2: Is Excel sufficient for professional KPI dashboards?
Click to Purchases Supply Chain and Logistics Sustainability KPI Dashboard in Excel
Yes! Excel offers extensive flexibility, data visualization tools, and user-friendly formulas that are more than enough for small to medium-sized businesses.
Q3: How often should I update the data?
Update your dashboard monthly to keep MTD and YTD figures accurate and ensure timely interventions.
Q4: What if my company uses different fiscal months?
No worries! The dashboard includes a cell (E1 in the Actual Numbers Input sheet) where you can set the start month of your fiscal year.
Q5: Can this dashboard handle multiple years of data?
Absolutely. You can either:
-
Create separate copies for each year, or
-
Expand the current layout to include multiple years in one workbook.
Click to Purchases Supply Chain and Logistics Sustainability KPI Dashboard in Excel
Visit our YouTube channel to learn step-by-step video tutorials