In today’s fast-moving world, supply chain management plays a critical role in ensuring that goods move efficiently from production to customers. Companies must monitor suppliers, warehouses, logistics, and returns to stay profitable and competitive. However, managing this vast flow of information becomes challenging without an organized system.
That’s where the Supply Chain Management Report in Excel comes in — a powerful yet simple reporting solution that brings every piece of your supply chain together in one interactive dashboard.
Click to Purchases Supply Chain Management Report in Excel
This article explores everything you need to know about building and using a Supply Chain Management Report in Excel, including its key features, benefits, best practices, and expert insights.
What Is a Supply Chain Management Report in Excel?
A Supply Chain Management (SCM) Report in Excel is an analytical tool designed to track, measure, and analyze every aspect of the supply chain. It consolidates raw data from different sources — such as purchase orders, deliveries, warehouse performance, and returns — into a single, dynamic Excel dashboard.
Instead of manually checking multiple sheets, this report provides a centralized view of key performance indicators (KPIs) through charts, cards, and slicers. It enables decision-makers to understand how efficiently the supply chain operates, where bottlenecks occur, and how performance can be improved.
📊 Why Use Excel for Supply Chain Reporting?
Excel remains one of the most flexible and widely used tools for business analysis. Even with advanced platforms like Power BI or ERP systems, Excel offers several advantages:
-
Easy customization for different business models.
-
Seamless integration with CSV, ERP, or inventory databases.
-
Built-in formulas and pivot tables for analysis.
-
Interactive dashboards using slicers and charts.
-
Low cost and universal accessibility.
Whether you are a manufacturer, distributor, or retailer, Excel provides a robust foundation for your reporting system.
Key Features of the Supply Chain Management Report in Excel
This professionally designed Excel report contains three interconnected pages that together form a complete supply chain reporting system.
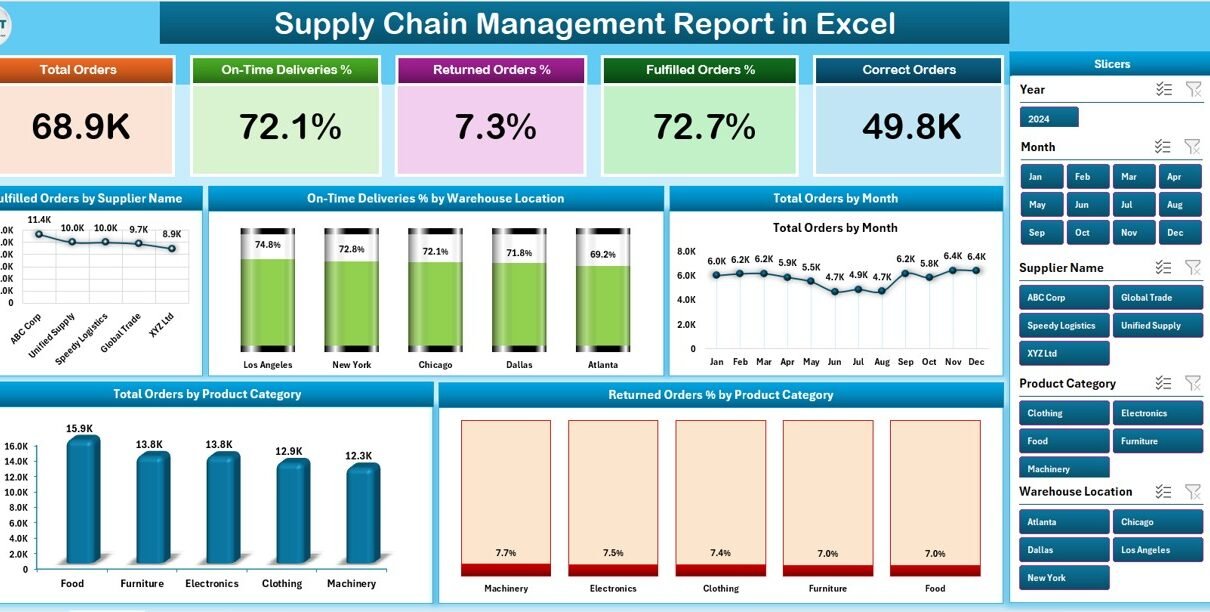
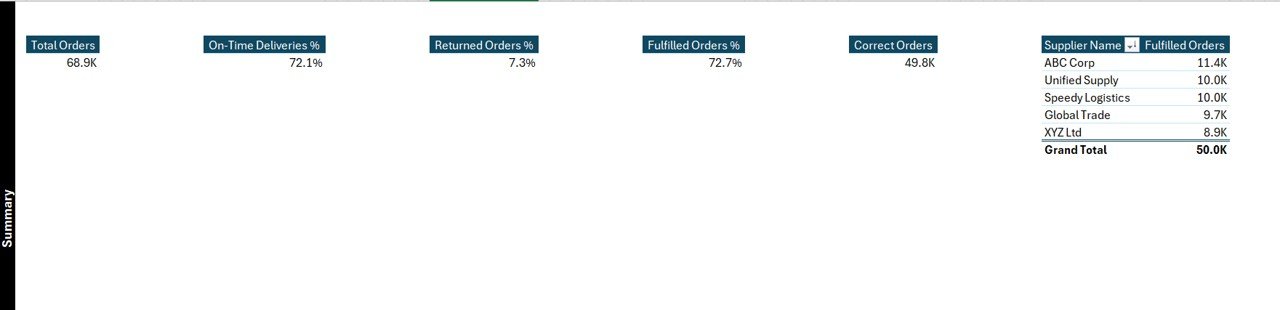
1️⃣ Summary Page — The Central Dashboard
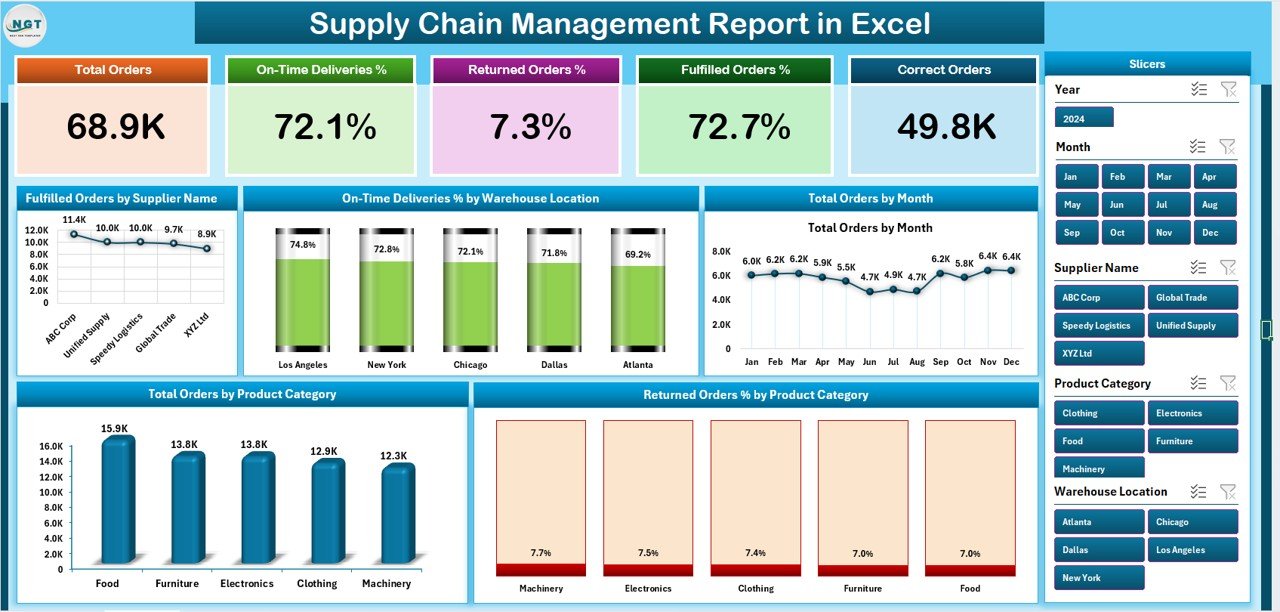
The Summary Page acts as the control center of your report. It displays all critical KPIs and visual insights at a glance.
Key Highlights:
-
Five KPI cards on the top show metrics like Total Orders, Fulfilled Orders, On-Time Delivery %, Returned Orders %, and Supplier Performance.
-
A right-side slicer panel allows users to filter by month, supplier, product category, or warehouse location.
Five powerful charts visualize the most important performance trends:
- Fulfilled Orders by Supplier Name
- On-Time Deliveries % by Warehouse Location
- Total Orders by Month
- Total Orders by Production Unit
- Returned Orders % by Product Category
Together, these visuals provide a real-time overview of supply chain health.
2️⃣ Report Page — Detailed Insights
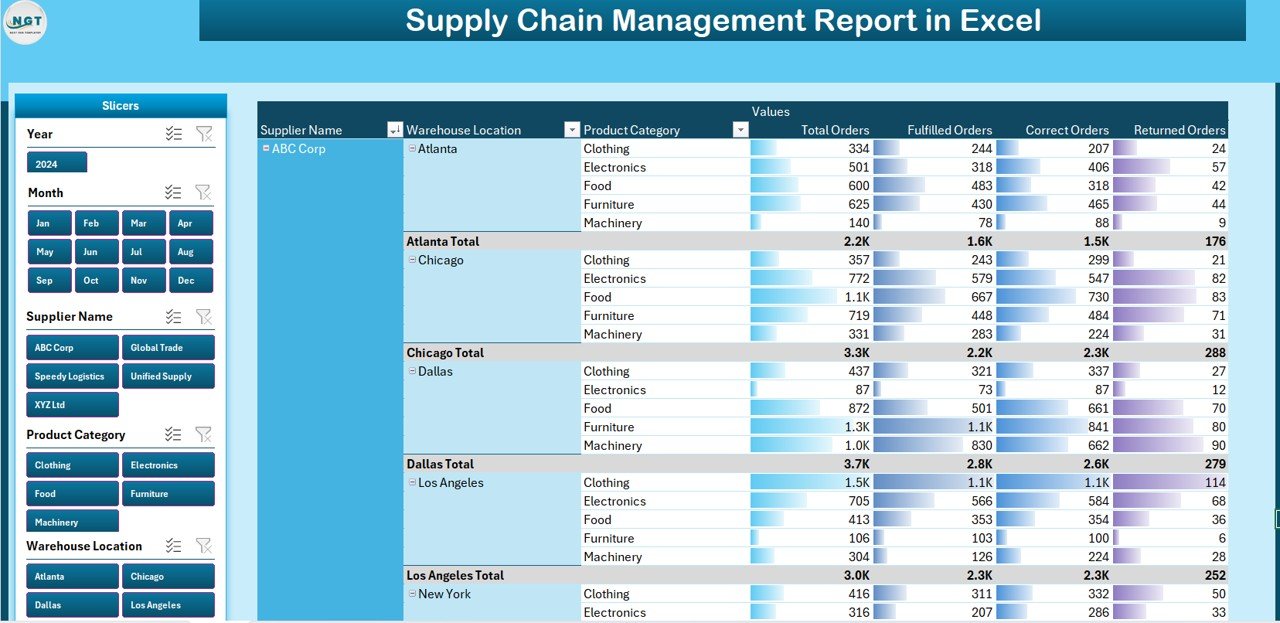
The Report Page is where users explore specific data points. It contains a left-side slicer panel for quick filtering and an information table displaying order-level data.
Here, users can:
-
View supplier-wise and product-wise performance.
-
Filter by delivery date, region, or order status.
-
Export filtered data for further analysis or audit purposes.
This page ensures data transparency and operational traceability — essential for performance reviews and audits.
3️⃣ Data Sheet — The Foundation
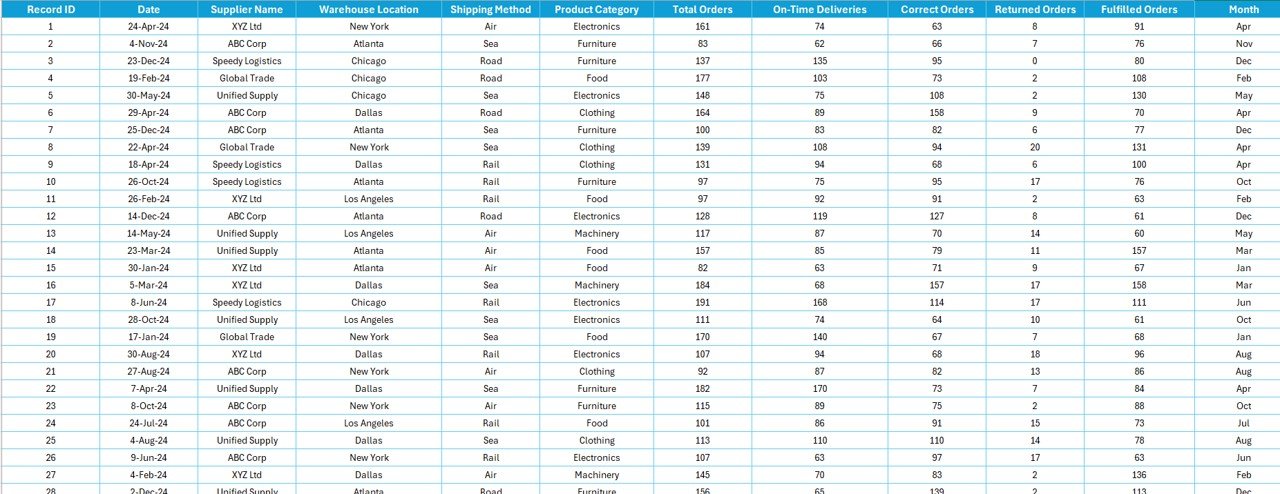
The Data Sheet is the engine behind the entire report. It holds the master dataset with columns such as Order ID, Supplier Name, Warehouse, Product Category, Order Date, Delivery Date, Quantity, Cost, Status, and Return Rate.
Since all charts and metrics reference this sheet, maintaining clean and accurate data here ensures reliable reporting.
Best practice tip: Keep your data table formatted as an Excel Table so that new entries automatically expand your report.
Click to Purchases Supply Chain Management Report in Excel
4️⃣ Support Sheet — Reference and Configurations
The Support Sheet contains supporting information like drop-down lists, KPI definitions, formulas, and lookup tables. It helps maintain structure and consistency across the workbook.
📈 How Does the Supply Chain Management Report Work?
When you open the report, all charts and metrics pull information directly from the Data Sheet. As soon as new data is added — for example, when a supplier updates a delivery — all visuals automatically update.
Users can select a month, warehouse, or product category from the slicer to filter the dashboard instantly. This interactive setup enables management teams to identify performance issues, compare trends, and make data-driven decisions.
Importance of Supply Chain Reporting
A well-designed supply chain report does more than visualize numbers. It provides a strategic lens for your business operations.
Key Benefits:
-
Identifies top-performing suppliers and warehouses.
-
Detects bottlenecks in delivery or production.
-
Monitors fulfillment accuracy and customer satisfaction.
-
Helps reduce waste and unnecessary costs.
-
Supports data-driven forecasting and decision-making.
In short, this Excel report helps transform raw operational data into actionable intelligence.
Advantages of Using Supply Chain Management Report in Excel
1. Centralized Data Management
All supply chain activities — from purchase orders to returns — appear in one location, minimizing errors and duplication.
2. Real-Time Visualization
Dynamic charts and slicers ensure that reports update automatically with new data, providing instant insights.
3. Performance Tracking
KPIs like On-Time Delivery %, Return Rate %, and Fulfillment Rate help track efficiency and quality across suppliers.
4. Decision Support
Management can instantly identify problem areas and make informed, strategic decisions.
5. Cost Efficiency
Since Excel is widely available, there is no additional cost for licensing or setup.
6. User-Friendly Interface
Even non-technical users can navigate, analyze, and interpret the data easily through simple buttons and slicers.
How to Create a Supply Chain Management Report in Excel
Building a professional-grade report in Excel is straightforward if you follow a structured approach.
Step 1: Define KPIs
Identify key metrics to measure — such as Fulfillment Rate, On-Time Delivery %, Returned Orders %, and Total Orders.
Step 2: Collect and Clean Data
Gather order, supplier, and logistics data from your ERP or inventory system. Remove duplicates and ensure data consistency.
Step 3: Organize Data Sheet
Use Excel Tables to structure your dataset. Assign column headers like:
-
Order ID
-
Supplier Name
-
Warehouse Location
-
Product Category
-
Order Date
-
Delivery Date
-
Quantity
-
Order Status
-
Return Percentage
Step 4: Build Pivot Tables
Create PivotTables to summarize KPIs by supplier, warehouse, or month.
Step 5: Design the Dashboard
Add pivot charts and cards. Use slicers for user interactivity and link them to multiple pivots.
Step 6: Apply Conditional Formatting
Use up-down arrows, color scales, or traffic-light icons to visually highlight performance.
Step 7: Test and Automate
Ensure that formulas and charts auto-update when new data is added. Save it as a template for future use.
Insights You Can Gain from This Report
By analyzing data within this Excel report, you can discover valuable patterns and insights such as:
-
Top suppliers contributing to the highest order fulfillment rates.
-
Warehouse locations with consistent delays or low performance.
-
Seasonal trends in total orders and returns.
-
Cost leakages due to poor supplier reliability.
-
Improvement opportunities in packaging, logistics, and scheduling.
These insights enable companies to streamline operations, negotiate better supplier terms, and enhance customer satisfaction.
Click to Purchases Supply Chain Management Report in Excel
🧮 Example Use Cases
Let’s consider how different teams benefit from this report:
-
Procurement Team: Track supplier performance and negotiate discounts for consistent fulfillment.
-
Logistics Team: Analyze delivery delays by location and plan efficient routing.
-
Production Team: Compare production output vs. order trends to balance inventory.
-
Finance Team: Evaluate cost efficiency, returns, and wastage trends for budgeting.
Thus, this Excel report becomes a multi-departmental decision support tool.
Best Practices for the Supply Chain Management Report in Excel
Following best practices ensures accuracy, efficiency, and long-term usability.
-
Keep Data Clean and Structured:
Always validate entries before uploading them into the data sheet. -
Use Dynamic Ranges:
Format datasets as Excel Tables so charts and pivots expand automatically. -
Define Clear KPI Formulas:
Use consistent calculation methods for accuracy across reports. -
Apply Conditional Formatting:
Use traffic lights, arrows, or icons for quick visual understanding. -
Create a User-Friendly Layout:
Place slicers, cards, and charts in a logical flow for easy navigation. -
Regularly Refresh Data:
Update your report weekly or monthly to maintain relevance. -
Secure the Workbook:
Protect sheets containing formulas or reference tables to prevent accidental edits. -
Automate Where Possible:
Use simple macros or Power Query to import and clean data automatically. -
Document Your KPIs:
Include a Support or Definition Sheet that explains all KPI logic. -
Test Before Sharing:
Verify slicer connections and formula accuracy before publishing the final version.
🏁 Conclusion
A Supply Chain Management Report in Excel is not just a spreadsheet — it’s a complete business intelligence tool. It empowers organizations to visualize performance, improve efficiency, and make informed decisions quickly.
By combining the flexibility of Excel with structured KPIs and visual analytics, businesses gain a 360-degree view of their supply chain. This helps reduce costs, improve service levels, and strengthen supplier relationships.
If you manage procurement, logistics, or warehouse operations, adopting this Excel report will help you stay proactive, data-driven, and competitive.
Frequently Asked Questions (FAQs)
1. What data should I include in a Supply Chain Management Report in Excel?
Include order details such as supplier name, warehouse location, product category, quantity, cost, delivery date, return rate, and order status. This ensures you can measure fulfillment, cost, and timeliness accurately.
2. Can I use this report for multiple suppliers and warehouses?
Yes. With slicers and pivot tables, you can filter and analyze data by supplier, product, or warehouse instantly.
3. How often should I update the report?
Ideally, you should refresh it weekly or monthly, depending on your business size and data volume.
4. Can Excel handle large supply chain data?
Excel handles up to a million rows efficiently. For larger datasets, connect it to Power Query or Power BI for automation.
5. How can I ensure accuracy in my report?
Keep your data structured, double-check formulas, and maintain a KPI definition sheet for reference.
6. What charts work best for supply chain reports?
Use bar charts for supplier performance, line charts for monthly trends, and pie charts for category-wise distribution.
Visit our YouTube channel to learn step-by-step video tutorials