Sustainable tourism keeps growing because travelers now care about nature, culture, and local communities. At the same time, tourism businesses must protect resources while still earning revenue. Therefore, you need a clear way to measure what you do, what you improve, and what you achieve.However, many tourism teams still track sustainability using scattered notes, long reports, or disconnected sheets. As a result, they lose time, miss insights, and struggle to show progress to stakeholders. That’s why a Sustainable Tourism KPI Scorecard in Excel becomes a practical solution.
This article explains what this scorecard is, how it works, what KPIs to track, and how to use it to improve your sustainability goals. Moreover, you will learn best practices, advantages, and FAQs, so you can build a strong KPI-driven tourism system.
Click to buy Sustainable Tourism KPI Scorecard In Excel
What Is a Sustainable Tourism KPI Scorecard in Excel?
A Sustainable Tourism KPI Scorecard in Excel is a structured performance tracking tool that helps you measure sustainability results using Key Performance Indicators (KPIs). Instead of managing data in multiple files, you track everything in one organized workbook.
Because Excel supports formulas, dropdowns, and charts, you can monitor performance without complex software. Also, you can share the file quickly with teams, managers, and partners.
Most importantly, this scorecard helps you answer critical questions like:
- Are we reducing environmental impact month by month?
- Are we supporting local communities and culture effectively?
- Are guests satisfied with our sustainability efforts?
- Are our targets realistic and improving over time?
Why Do Sustainable Tourism Businesses Need KPI Tracking?
Sustainable tourism involves many moving parts. For example, you manage energy, water, waste, guest experience, and local community impact. So, you need a measurement system that connects daily action with long-term goals.
Here’s why KPI tracking matters:
- Because you can’t improve what you don’t measure, KPIs create direction.
- Because sustainability reporting requires evidence, KPIs prove results.
- Because teams need clarity, KPIs convert goals into daily focus.
- Because budgets require justification, KPIs show ROI and efficiency.
- Because guests expect transparency, KPIs strengthen trust and branding.
So, when you use a scorecard, you measure performance consistently and act faster.
How Does the Sustainable Tourism KPI Scorecard Template Work?
This scorecard template comes as a ready-to-use Excel workbook and includes 4 worksheets designed for clean KPI management.
Below is the structure you shared, explained with improvements and practical usage.
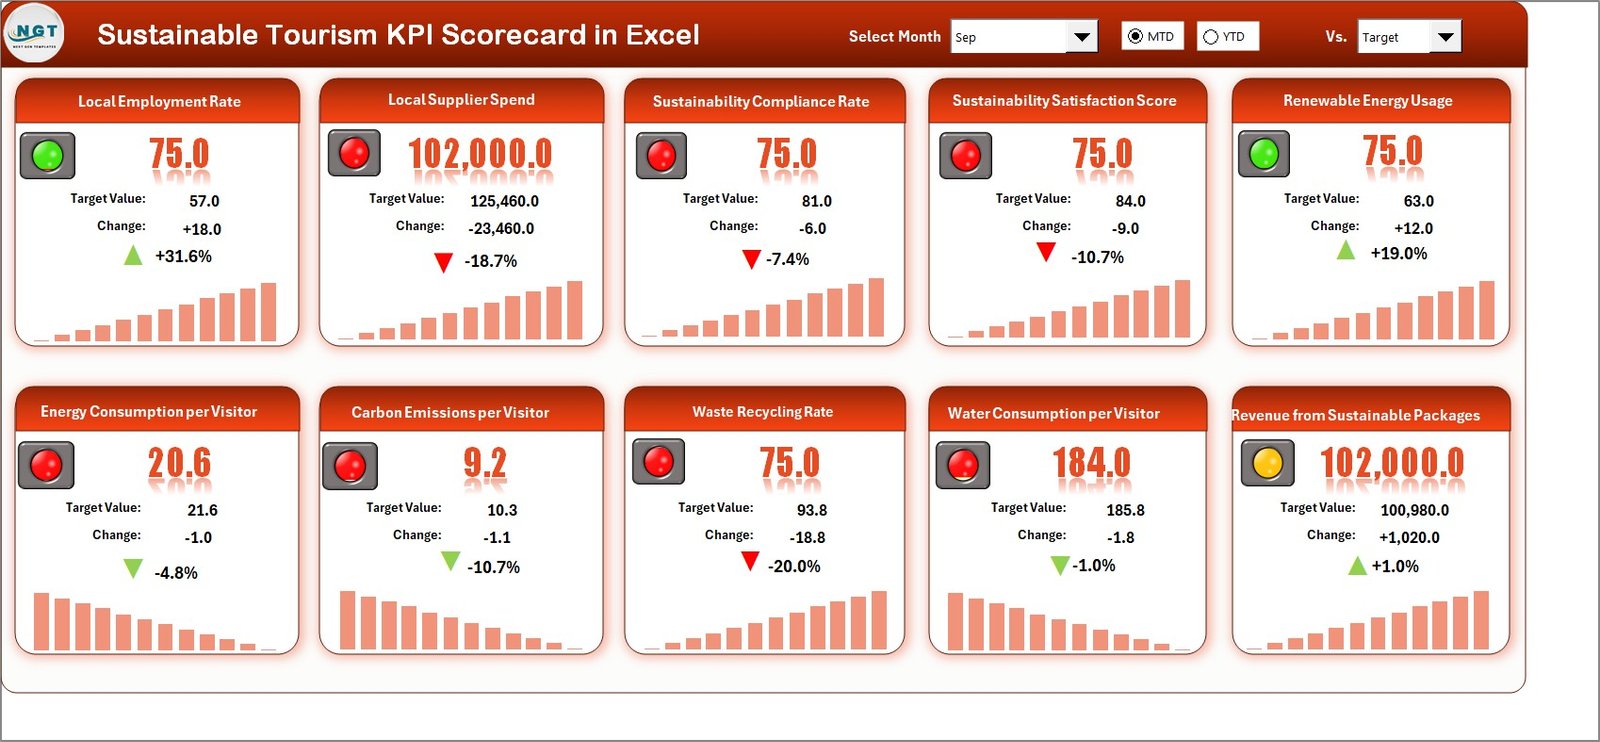
Scorecard Sheet: How Do You View KPI Performance in One Place?
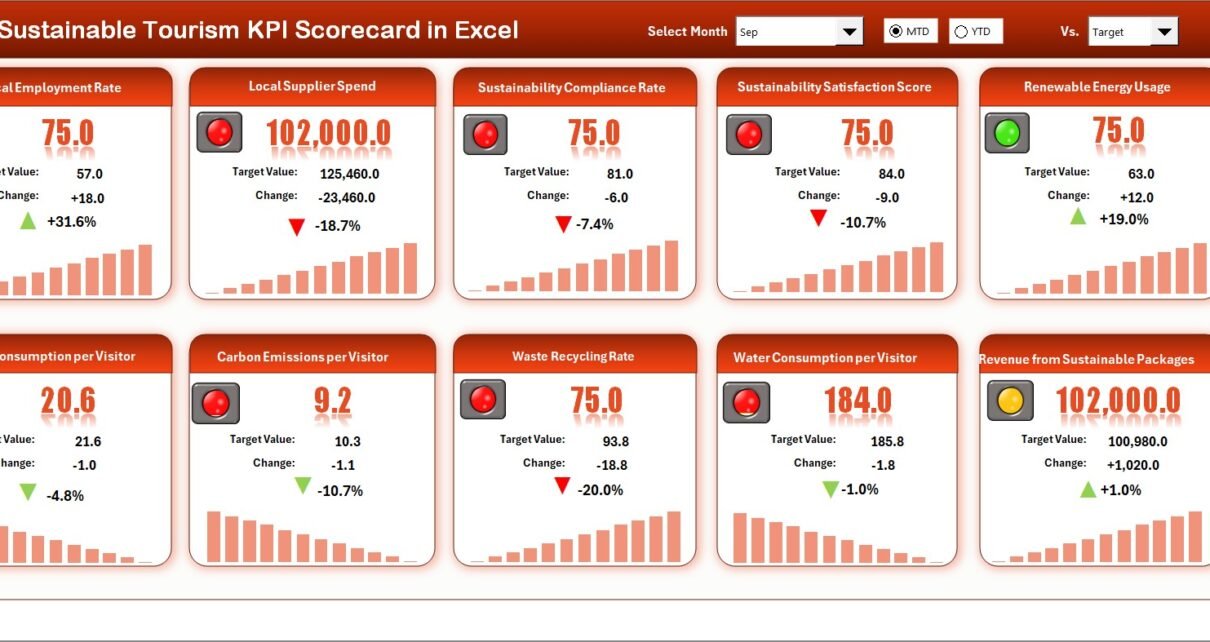
The Scorecard sheet works as the main dashboard and the primary interface for performance review.
Key features in the Scorecard Sheet
Dropdown menus for Month + MTD/YTD selection
You can select a month and choose whether you want to review:
- MTD (Month-to-Date) performance
- YTD (Year-to-Date) performance
As a result, you can review short-term progress and long-term progress without switching files.
Actual vs Target comparison
This section shows the KPI’s Actual value beside the Target value, so you can instantly identify gaps.
Visual indicators (conditional formatting)
You can quickly understand performance using color-coded signals such as:
- On track
- Needs attention
- Off track
Therefore, decision-making becomes faster and more confident.
Comprehensive KPI overview in one view
The scorecard shows all KPI details clearly including MTD and YTD comparisons.
KPIs visible in one view
This is highly useful because leaders want a quick snapshot instead of long reports.
Click to buy Sustainable Tourism KPI Scorecard In Excel
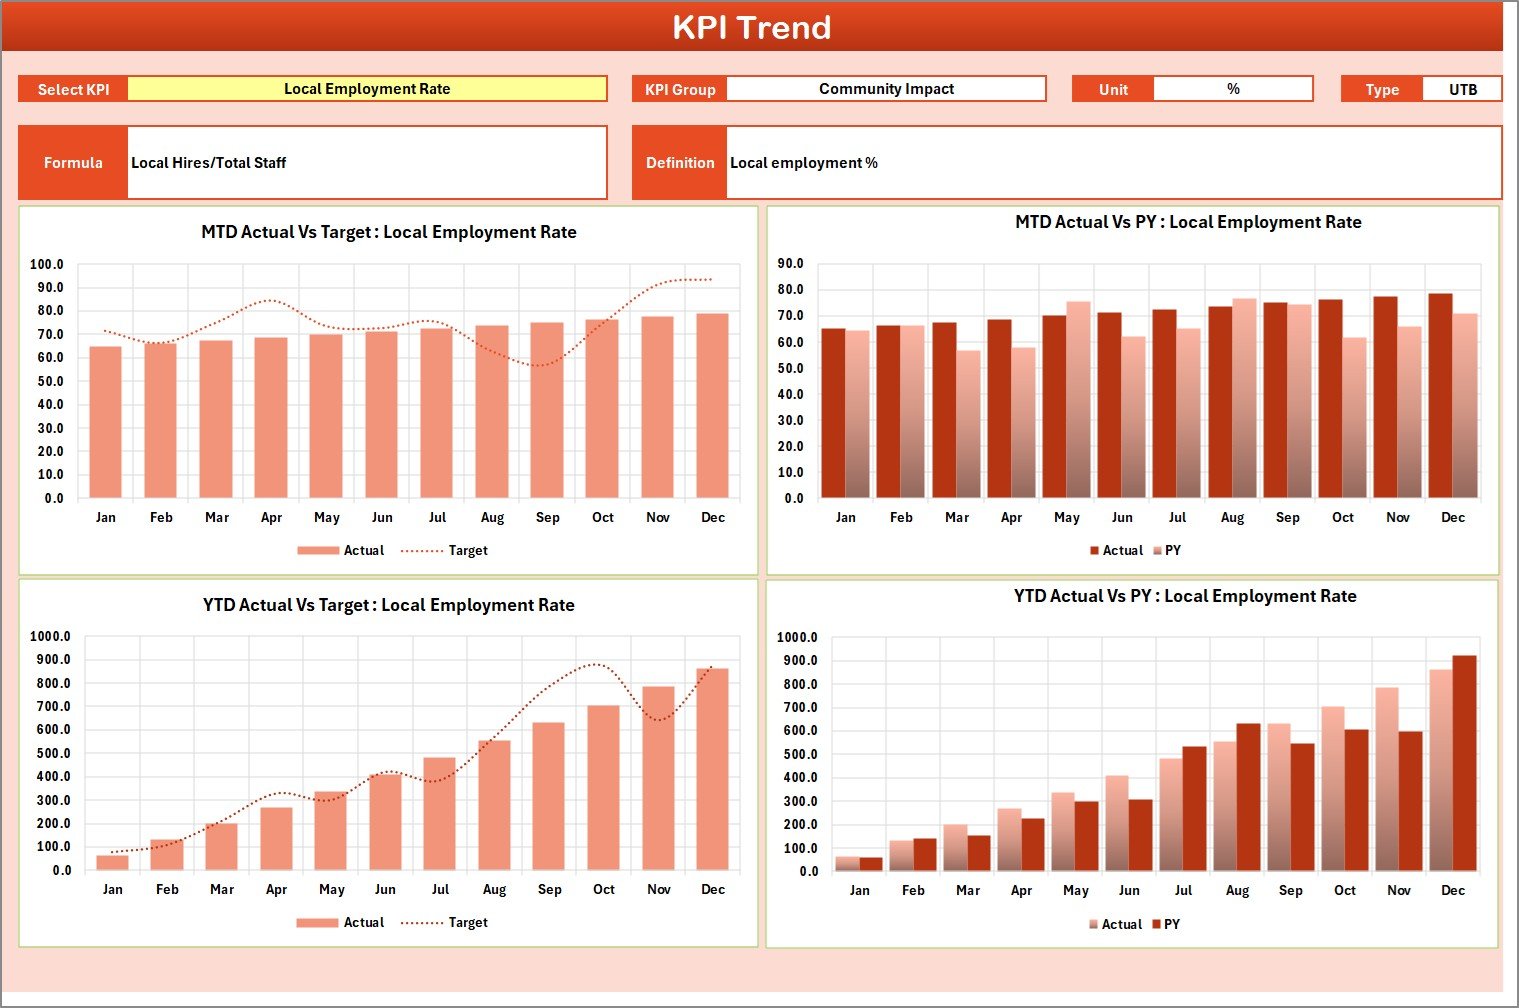
KPI Trend Sheet: How Can You Analyze KPI Trends Over Time?
The KPI Trend sheet helps you analyze one KPI deeply.
What you can do in the KPI Trend sheet
Select KPI from dropdown in C3
You choose the KPI name, and the sheet updates automatically.
KPI information displayed clearly
It shows:
- KPI Group
- KPI Unit
- KPI Type (Lower the Better / Upper the Better)
- KPI Formula
- KPI Definition
So, even new team members understand what the KPI means.
MTD and YTD trend charts
You see trend charts for:
- Actual
- Target
- PY (Previous Year)
Because you compare current vs target and current vs last year, you can spot improvement patterns quickly.
Click to buy Sustainable Tourism KPI Scorecard In Excel
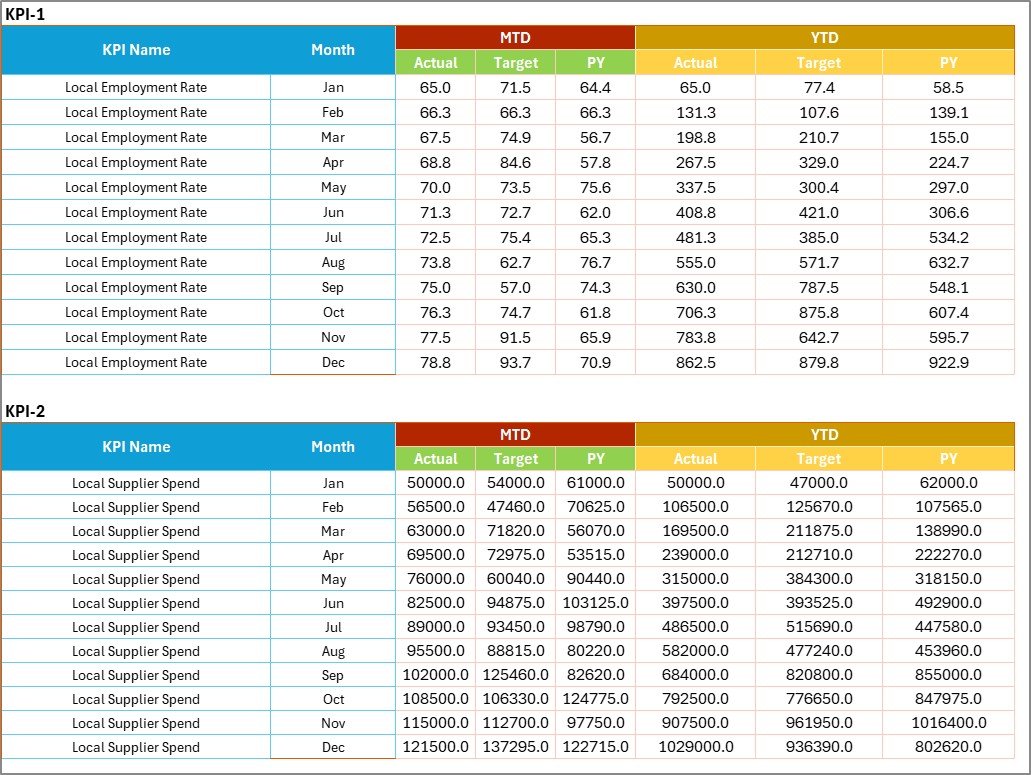
Input Data Sheet: Where Do You Enter Your KPI Data?
The Input Data sheet acts as the data engine of the workbook.
How it supports KPI management
Simple data entry
You enter:
- Actual results
- Target values
- supporting metrics (if needed)
Flexible updates
You can update data each month. Then the scorecard refreshes instantly.
Therefore, the scorecard stays current without reworking charts.
Click to buy Sustainable Tourism KPI Scorecard In Excel
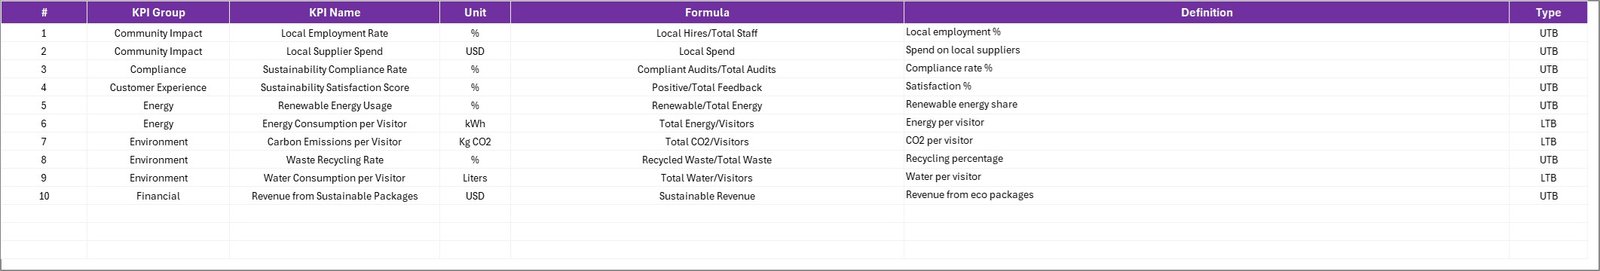
KPI Definition Sheet: How Do You Define KPIs Clearly?
The KPI Definition sheet keeps your KPI logic consistent.
You enter:
- KPI Name
- KPI Group
- Unit
- Formula
- KPI Definition
Because everything stays documented, you avoid confusion and reporting errors.
Click to buy Sustainable Tourism KPI Scorecard In Excel
What KPIs Should You Track for Sustainable Tourism?
Sustainable tourism touches environment, community, and operations. So, you should track KPIs across multiple groups.
Here are practical KPI categories and KPI examples you can include (and later add into your KPI Definition sheet).
Environmental Sustainability KPIs
- Energy consumption per guest-night (kWh)
- Renewable energy usage %
- Water usage per guest-night (liters)
- Waste generated per guest-night (kg)
- Waste diversion rate (recycling/composting %)
- Carbon footprint per guest-night (kg CO₂e)
Operations & Efficiency KPIs
- Maintenance response time (hours)
- Sustainable procurement rate (% local / eco-certified)
- Paperless operations rate (% digital processes)
- Eco-training completion rate (% staff trained)
Social & Community KPIs
- Local employment rate (% local staff)
- Local supplier spending (% of purchasing)
- Community investment value (₹ / $)
- Local culture engagement score (survey-based)
Guest Experience KPIs
- Guest satisfaction score (overall)
- Sustainability experience rating (survey)
- Repeat guest rate (%)
- Complaints related to sustainability (count)
Compliance & Governance KPIs
- Audit compliance rate (%)
- Sustainability reporting accuracy (%)
- Incident rate (environmental or safety)
You can start with 10 KPIs (as your scorecard shows) and expand as needed.
How Do You Set Targets for Sustainable Tourism KPIs?
Targets must stay realistic and measurable. So, follow this approach:
- Use baseline data first
Start with last year’s average. Then set improvement goals. - Set targets per season
Tourism performance changes by season. Therefore, targets should adapt for peak and off-season. - Use step targets
Instead of one large goal, set monthly steps. This keeps teams motivated. - Align targets with sustainability standards
If you follow any framework (like GSTC or local tourism policies), match targets with those priorities.
How Do You Use the Scorecard Step-by-Step?
Step 1: Define KPIs first (KPI Definition sheet)
Add KPI name, group, unit, and definitions. Keep formulas short and clear.
Step 2: Enter monthly data (Input Data sheet)
Record Actual, Target, and Previous Year values where applicable.
Step 3: Review performance (Scorecard sheet)
Select month + MTD/YTD and review KPI status.
Step 4: Analyze key KPIs (KPI Trend sheet)
Choose any KPI in dropdown C3 and review trend charts.
Step 5: Take action and document improvements
Use KPI gaps to create action tasks like reducing water usage or increasing waste diversion.
Advantages of Sustainable Tourism KPI Scorecard in Excel
Why does it improve decision-making?
Because the scorecard shows Actual vs Target clearly, you identify problem areas immediately and act faster.
Why does it save time and effort?
Because everything stays in one file with dropdowns and charts, you avoid manual reporting and repeated formatting.
Why does it support sustainability reporting?
Because you track MTD and YTD values consistently, you can prepare stakeholder reports easily.
Why does it increase team accountability?
Because KPIs remain visible, teams understand what matters, and ownership becomes stronger.
Why does it help you build a sustainability brand?
Because you measure, improve, and share progress, you build trust with eco-conscious travelers.
Best Practices for the Sustainable Tourism KPI Scorecard in Excel
- Keep KPI definitions simple and consistent
Use clear formulas and short descriptions so the whole team understands them. - Track fewer KPIs but track them well
Start with 10 strong KPIs. Then expand only when needed. - Update data on a fixed schedule
For example: update monthly on the 1st or 2nd day of each month. - Review MTD and YTD together
MTD shows immediate changes, while YTD shows the real trend. - Use Previous Year comparison
PY values help you prove improvement, not just performance. - Assign KPI owners
Give each KPI a responsible person or department, so progress becomes stable. - Use clear thresholds for indicators
Define what counts as green, yellow, and red. Then decisions become consistent. - Back up your workbook
Save monthly versions so you can track data history without risk.
Conclusion: Why Sustainable Tourism KPI Tracking Matters
Sustainable tourism requires more than good intentions. You must prove progress with real numbers. Therefore, a Sustainable Tourism KPI Scorecard in Excel gives you a practical and structured system to measure performance, compare actual vs target, and improve sustainability year after year.
Because this template includes a Scorecard, KPI Trend analysis, Input Data structure, and KPI Definition sheet, you can manage sustainability KPIs in one clean Excel file. Moreover, you can share it easily, update it quickly, and use it for reporting and planning.
If you want to improve sustainability results, increase transparency, and build a stronger tourism brand, then this KPI scorecard becomes a smart step forward.
Frequently Asked Questions (FAQs)
What is the purpose of a Sustainable Tourism KPI Scorecard in Excel?
The purpose is to track sustainability performance using measurable KPIs, so tourism businesses can monitor progress, compare actual vs target, and improve decisions.
Which KPIs should I include in a sustainable tourism scorecard?
You should include KPIs related to energy, water, waste, carbon footprint, local employment, community spending, guest satisfaction, and compliance.
How often should I update the KPI scorecard?
You should update it monthly. However, you can also update weekly if you track operational KPIs more frequently.
What is the difference between MTD and YTD in KPI tracking?
MTD shows results from the start of the month to today, while YTD shows results from the start of the year to today. Therefore, you can monitor both short-term and long-term progress.
Why should I compare KPI performance with Previous Year (PY)?
Because PY comparison shows improvement trends and helps you prove progress. Also, it supports better target-setting.
Can small hotels or tour operators use this scorecard?
Yes. Small businesses can use it easily because Excel works without complex tools. Also, you can track fewer KPIs while still improving sustainability.
How do I choose KPI targets?
Choose targets based on baseline data, seasonal patterns, and realistic improvement steps. Then review them quarterly to keep them relevant.
Does this scorecard replace sustainability certification tools?
No. However, it supports certification by providing data tracking, performance reporting, and consistent KPI measurement.
Visit our YouTube channel to learn step-by-step video tutorials
Watch the step-by-step video tutorial:
Click to buy Sustainable Tourism KPI Scorecard In Excel