Telecom networks generate massive amounts of operational data every day. Network availability, call quality, data speed, service reliability, and customer experience all depend on continuous monitoring of key performance indicators (KPIs). However, many telecom companies still manage network performance using scattered reports and multiple spreadsheets. As a result, managers often struggle to analyze network performance quickly and make informed decisions.
Therefore, organizations increasingly adopt structured KPI scorecards to monitor telecom network performance effectively. A well-designed scorecard allows teams to track operational metrics, compare actual performance with targets, and identify performance gaps instantly.
That is exactly where the Telecom Network KPI Scorecard in Excel becomes a powerful performance monitoring tool.
This ready-to-use Excel template helps telecom operators, network engineers, analysts, and management teams monitor critical KPIs in a structured and interactive format. Instead of reviewing multiple reports, users can analyze telecom network performance through a single dashboard-like scorecard.
In this comprehensive guide, you will learn:
- What a Telecom Network KPI Scorecard in Excel is
- Why telecom companies need KPI scorecards
- Key features of the Excel template
- Important telecom KPIs you should track
- Advantages of using the scorecard
- Best practices for implementation
- Frequently asked questions about telecom KPI monitoring
Click to buy Telecom Network KPI Scorecard in Excel
What is a Telecom Network KPI Scorecard in Excel?
A Telecom Network KPI Scorecard in Excel is a structured performance tracking system built in Microsoft Excel that helps telecom companies monitor important network metrics.
The scorecard consolidates operational data into one central interface. As a result, telecom teams can quickly compare actual results against targets and evaluate network performance.
Instead of manually reviewing separate reports for network availability, call drop rates, and data speed, the Excel scorecard provides a unified view of performance.
The scorecard typically tracks KPIs such as:
- Network availability
- Call drop rate
- Data throughput
- Latency
- Packet loss
- Customer complaint rate
- Service downtime
- Network congestion
Because the scorecard organizes data in a structured format, telecom teams can easily identify issues, analyze trends, and take corrective actions.
Moreover, Excel provides powerful tools such as formulas, conditional formatting, charts, and dropdown filters. Consequently, the scorecard becomes an interactive analytics tool rather than a simple spreadsheet.
Why Do Telecom Companies Need KPI Scorecards?
Telecommunication networks operate 24/7. Therefore, network operators must monitor performance continuously to maintain service quality.
However, telecom infrastructure involves multiple technologies including mobile networks, fiber networks, switching systems, and internet services. Each system generates performance data that must be monitored carefully.
Without a structured monitoring system, teams face several challenges.
Common Challenges Without KPI Monitoring
- Data scattered across multiple systems
- Delayed identification of network issues
- Difficulty tracking performance trends
- Lack of centralized reporting
- Limited visibility for management
Because of these challenges, telecom organizations require a centralized performance monitoring solution.
A KPI scorecard solves these problems by providing:
- Real-time performance monitoring
- Structured KPI tracking
- Visual performance indicators
- Data-driven decision making
As a result, telecom companies improve network reliability, reduce service disruptions, and enhance customer satisfaction.
Key Features of the Telecom Network KPI Scorecard in Excel
The Telecom Network KPI Scorecard in Excel is a ready-to-use template designed to track and analyze telecom performance metrics efficiently.
In this template, we have four worksheets that manage the complete KPI monitoring process.
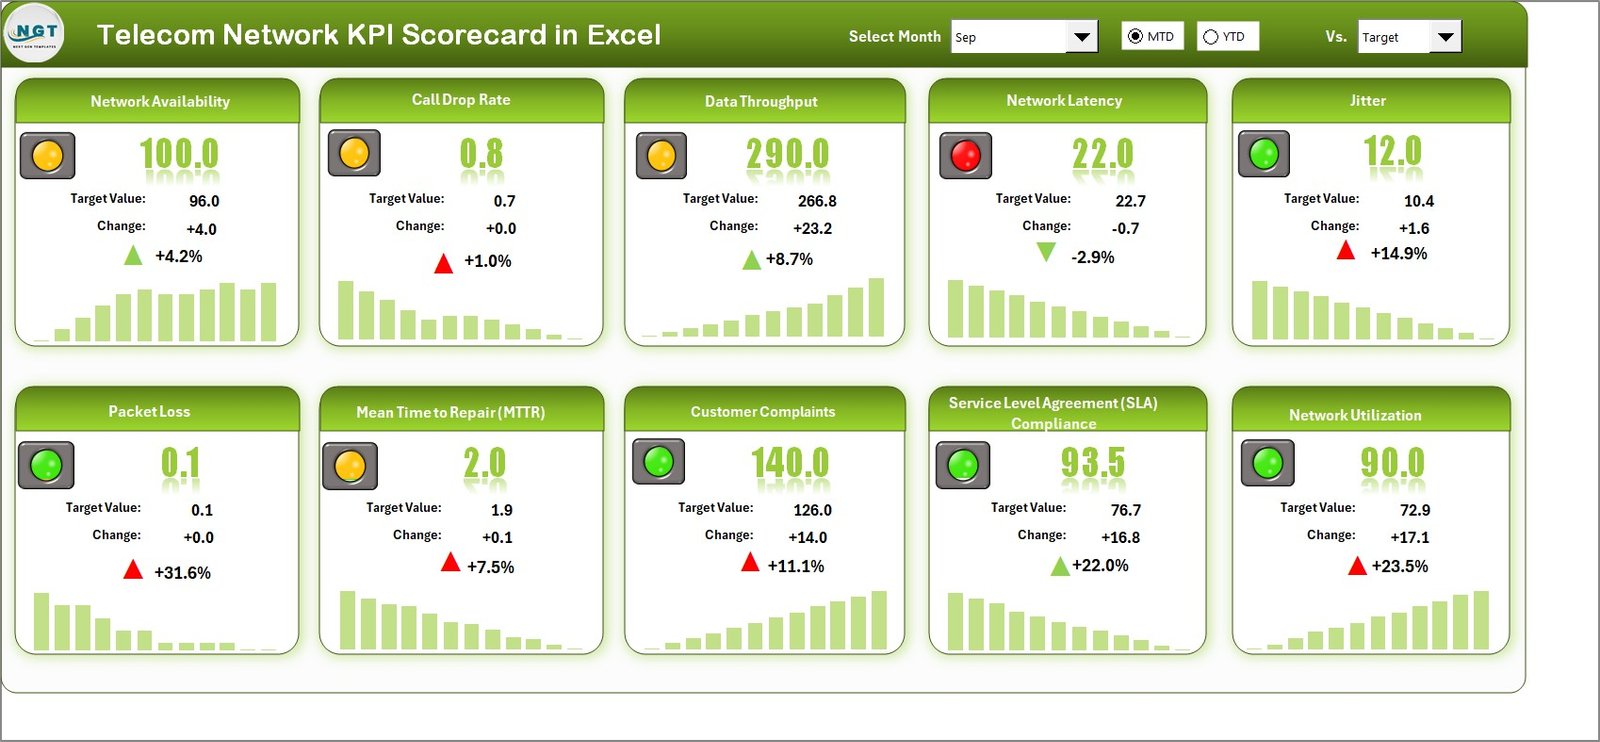
Scorecard Sheet – The Main Performance Dashboard
The Scorecard Sheet acts as the primary interface where users can monitor telecom network KPIs.
This sheet provides a consolidated overview of all important metrics. Therefore, managers can quickly evaluate network performance.
Key Features of the Scorecard Sheet
Dropdown Filters
Users can select the following options:
- Month selection
- MTD (Month-to-Date) analysis
- YTD (Year-to-Date) analysis
Because of these filters, users can instantly change the time period and analyze performance accordingly.
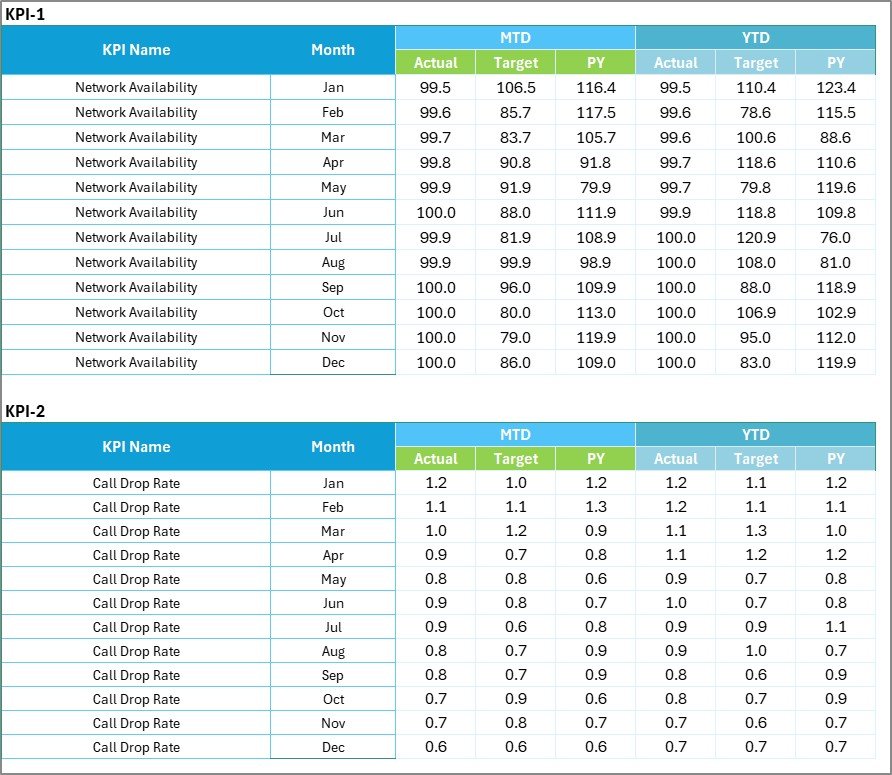
Actual vs Target Comparison
The scorecard displays both actual values and target values for every KPI.
Therefore, telecom teams can immediately see whether performance meets expectations.
For example:
- Actual Network Availability vs Target Availability
- Actual Call Drop Rate vs Target Drop Rate
- Actual Data Throughput vs Target Throughput
This comparison helps teams identify underperforming metrics quickly.
Visual Performance Indicators
The template uses color-coded indicators and conditional formatting to highlight performance.
For example:
- Green indicates KPI achieved
- Yellow indicates moderate performance
- Red indicates target missed
These visual cues allow managers to identify issues instantly without reading detailed reports.
Comprehensive KPI Overview
The scorecard displays detailed KPI information including:
- KPI Name
- KPI Group
- KPI Unit
- Target values
- Actual values
- MTD performance
- YTD performance
Therefore, users receive a complete view of telecom network performance.
KPIs in a Single View
The scorecard allows users to track 10 KPIs in one screen.
Because of this structure, telecom managers can monitor multiple metrics simultaneously without switching between sheets.
Click to buy Telecom Network KPI Scorecard in Excel
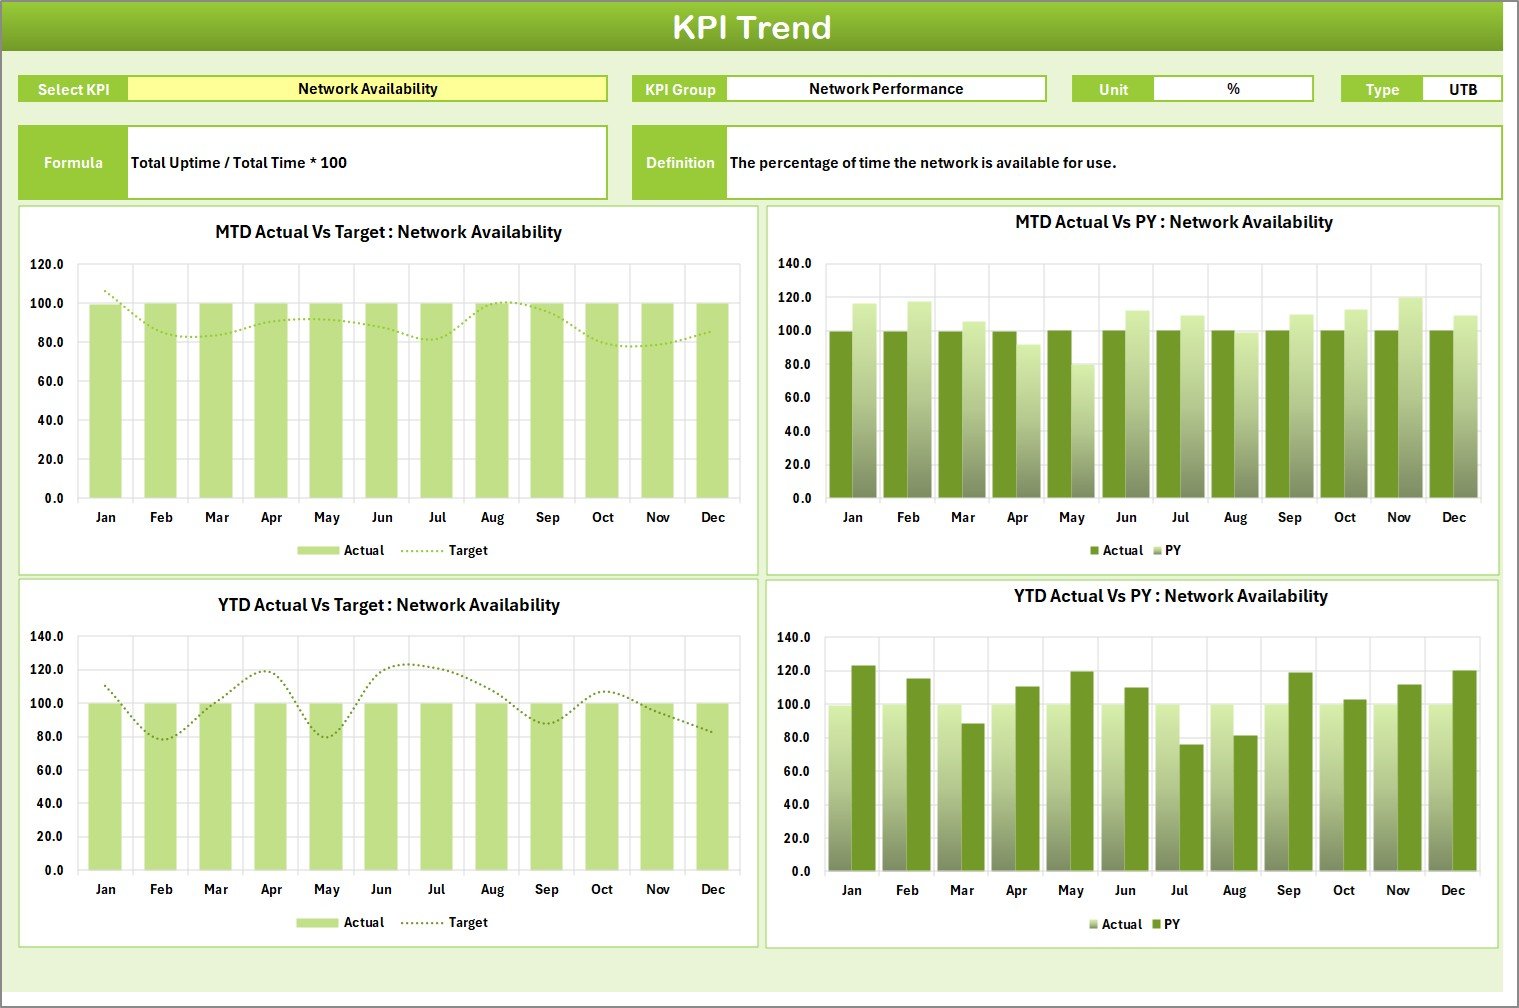
KPI Trend Sheet – Performance Trend Analysis
The KPI Trend Sheet helps users analyze the historical performance of a selected KPI.
Users can select a KPI from the dropdown list available in Cell C3.
Once selected, the sheet displays complete KPI information.
KPI Details Displayed
- KPI Group
- KPI Unit
- KPI Type (Lower the Better / Upper the Better)
- KPI Formula
- KPI Definition
Therefore, users can clearly understand how the KPI is calculated and what it represents.
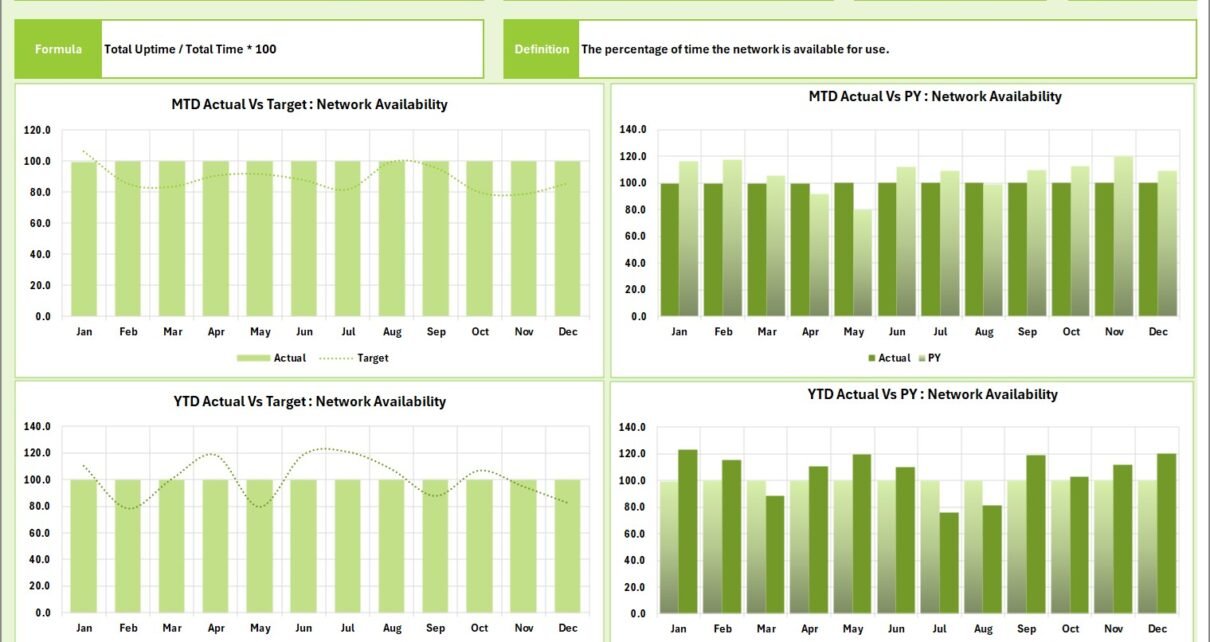
KPI Trend Charts
The sheet also includes trend charts that display:
- Actual values
- Target values
- Previous Year (PY) values
The charts show both:
- MTD trend
- YTD trend
Because of these visual charts, users can easily identify performance patterns and trends.
For example:
- Increasing network latency
- Improvement in data throughput
- Decline in call drop rates
These insights help telecom teams make strategic decisions.
Click to buy Telecom Network KPI Scorecard in Excel
Input Data Sheet – Centralized Data Entry
The Input Data Sheet serves as the data entry section of the template.
Users record all KPI values in this sheet.
Key Features
Simple Data Entry
Users can easily enter:
- Actual KPI values
- Target values
- Previous year values
- Monthly performance data
Flexible Data Updates
As new performance results become available, users can update the sheet quickly.
Therefore, the scorecard automatically reflects the latest network performance.
Centralized Data Storage
All KPI information remains stored in one structured dataset.
Consequently, the scorecard becomes easier to maintain and update.
Click to buy Telecom Network KPI Scorecard in Excel
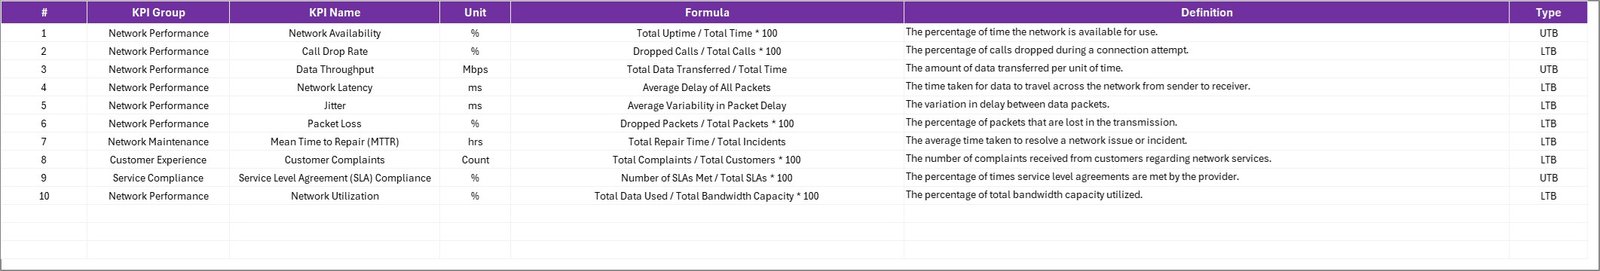
KPI Definition Sheet – KPI Documentation
The KPI Definition Sheet helps organizations maintain proper documentation for every KPI.
This sheet contains essential KPI information.
Fields Included in KPI Definition Sheet
- KPI Name
- KPI Group
- KPI Unit
- KPI Formula
- KPI Definition
Because of this structure, teams can standardize KPI definitions across the organization.
Moreover, new employees and analysts can easily understand KPI calculations.
Click to buy Telecom Network KPI Scorecard in Excel
What Important Telecom KPIs Can You Track?
Telecom companies track multiple KPIs to evaluate network performance.
Some commonly used telecom KPIs include:
Network Performance KPIs
- Network Availability (%)
- Network Downtime
- Latency (ms)
- Packet Loss (%)
- Network Congestion Rate
Voice Service KPIs
- Call Drop Rate
- Call Setup Success Rate
- Voice Quality Score
- Call Completion Rate
Data Network KPIs
- Data Throughput (Mbps)
- Data Speed
- Bandwidth Utilization
- Data Session Success Rate
Customer Experience KPIs
- Customer Complaint Rate
- Service Restoration Time
- Customer Satisfaction Score
By tracking these KPIs, telecom companies can monitor service quality and improve operational efficiency.
Advantages of Telecom Network KPI Scorecard in Excel
A structured KPI scorecard offers several advantages for telecom organizations.
- Centralized Performance Monitoring
The scorecard consolidates all telecom KPIs into one dashboard.
Therefore, managers can monitor network performance without reviewing multiple reports.
- Faster Decision Making
Visual indicators and charts help managers identify issues quickly.
As a result, teams can take corrective actions before problems escalate.
- Improved Network Reliability
By monitoring KPIs continuously, telecom teams can detect network issues early.
Consequently, they can minimize service disruptions.
- Better Operational Efficiency
The scorecard helps teams track performance trends and optimize network operations.
Therefore, telecom operators can improve productivity and reduce operational costs.
- Data-Driven Management
Instead of relying on assumptions, telecom managers can use data insights to guide decisions.
As a result, strategic planning becomes more accurate.
Best Practices for Using the Telecom Network KPI Scorecard in Excel
Organizations must follow certain best practices to maximize the benefits of the scorecard.
Define KPIs Clearly
Always define each KPI properly.
Include:
- Formula
- Unit of measurement
- Performance target
- KPI objective
Clear definitions prevent confusion and ensure consistent reporting.
Update Data Regularly
Always update KPI data frequently.
Daily or weekly updates ensure that performance monitoring remains accurate.
Use Consistent Data Sources
Collect data from reliable telecom monitoring systems.
Consistency improves data accuracy and reporting reliability.
Monitor KPI Trends
Instead of analyzing only current results, review historical trends.
Trend analysis helps identify long-term performance patterns.
Focus on Actionable KPIs
Track KPIs that influence operational decisions.
Avoid tracking too many metrics that do not provide actionable insights.
How Can Telecom Teams Use This Scorecard?
Different teams within a telecom organization can use the KPI scorecard for various purposes.
Network Operations Team
- Monitor network availability
- Track service disruptions
- Analyze network performance trends
Management Teams
- Review overall telecom performance
- Identify operational risks
- Monitor KPI achievement levels
Data Analysts
- Perform trend analysis
- Generate performance reports
- Support strategic planning
Customer Experience Teams
- Monitor service quality KPIs
- Identify network issues affecting customers
- Improve service performance
Conclusion
Telecommunication networks require continuous monitoring to maintain service quality, reliability, and operational efficiency. However, manual reporting and scattered data often create challenges for telecom teams.
The Telecom Network KPI Scorecard in Excel provides a structured solution for monitoring telecom performance metrics. This ready-to-use template consolidates KPI data into one centralized scorecard, allowing teams to compare actual results with targets, analyze trends, and identify performance gaps quickly.
With features such as dropdown filters, visual indicators, KPI trend charts, and centralized data entry, the template becomes a powerful performance monitoring tool.
As telecom networks continue to grow in complexity, organizations must adopt structured analytics tools like KPI scorecards. Therefore, implementing this Excel scorecard helps telecom companies improve network performance, enhance service reliability, and make data-driven decisions.
Frequently Asked Questions (FAQs)
What is a telecom KPI?
A telecom KPI is a measurable performance indicator used to evaluate telecom network operations, service quality, and customer experience.
Examples include call drop rate, network availability, and data throughput.
Why is KPI monitoring important in telecom?
KPI monitoring helps telecom companies track network performance, detect operational issues early, and maintain service reliability.
Without KPI monitoring, organizations may struggle to identify performance problems.
Can Excel handle telecom KPI analysis?
Yes. Excel provides powerful tools such as formulas, charts, conditional formatting, and pivot tables.
Therefore, organizations can easily build KPI scorecards and performance dashboards in Excel.
What is the difference between MTD and YTD analysis?
MTD (Month-to-Date) analysis evaluates performance from the beginning of the month to the current date.
YTD (Year-to-Date) analysis evaluates performance from the beginning of the year to the current date.
Who should use a telecom KPI scorecard?
Several professionals can benefit from the scorecard, including:
- Telecom network engineers
- Operations managers
- Data analysts
- Service quality teams
- Telecom executives
Visit our YouTube channel to learn step-by-step video tutorials
Watch the step-by-step video tutorial:
Click to buy Telecom Network KPI Scorecard in Excel