In today’s digital healthcare era, telemedicine platforms are growing rapidly. However, managing performance across patients, consultations, response times, and service quality becomes challenging. Many healthcare organizations still rely on scattered spreadsheets and manual reporting.
Because of that, they struggle to track KPIs, measure performance, and improve service quality. Therefore, businesses now adopt advanced analytics tools to simplify decision-making.
That’s exactly where the Telemedicine Platforms KPI Dashboard in Power BI becomes a powerful solution.
In this comprehensive guide, you will learn everything about this dashboard. Moreover, you will understand its structure, features, advantages, best practices, and how it helps improve healthcare operations.
📊 What is a Telemedicine Platforms KPI Dashboard in Power BI?
A Telemedicine Platforms KPI Dashboard in Power BI is an interactive reporting tool that helps healthcare organizations monitor, analyze, and improve telehealth performance.
It tracks important metrics such as:
-
Patient consultations
-
Appointment success rate
-
Response time
-
KPI targets vs actuals
-
Monthly and yearly performance
-
Growth trends
Instead of using multiple reports, you can view all KPIs in one centralized dashboard. As a result, you gain better visibility and control over telemedicine operations.
Why Do Telemedicine Platforms Need KPI Dashboards?
Click to Buy Telemedicine Platforms KPI Dashboard in Power BI
Telemedicine platforms handle large volumes of data daily. However, without proper tracking, organizations cannot measure performance effectively.
Therefore, a KPI dashboard helps you:
-
Monitor healthcare performance in real time
-
Identify gaps in service delivery
-
Improve patient satisfaction
-
Track targets and achievements
-
Make faster and smarter decisions
Moreover, it reduces manual work and improves efficiency.
Key Features of Telemedicine Platforms KPI Dashboard in Power BI
This dashboard includes 3 interactive and powerful pages, each designed to provide deep insights.
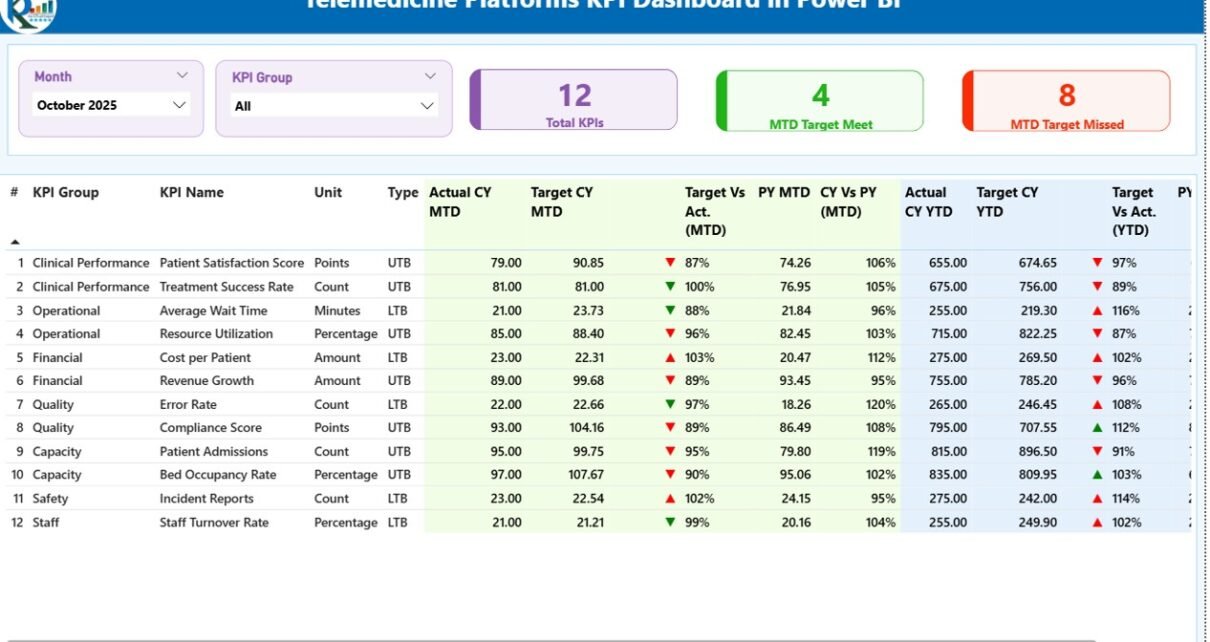
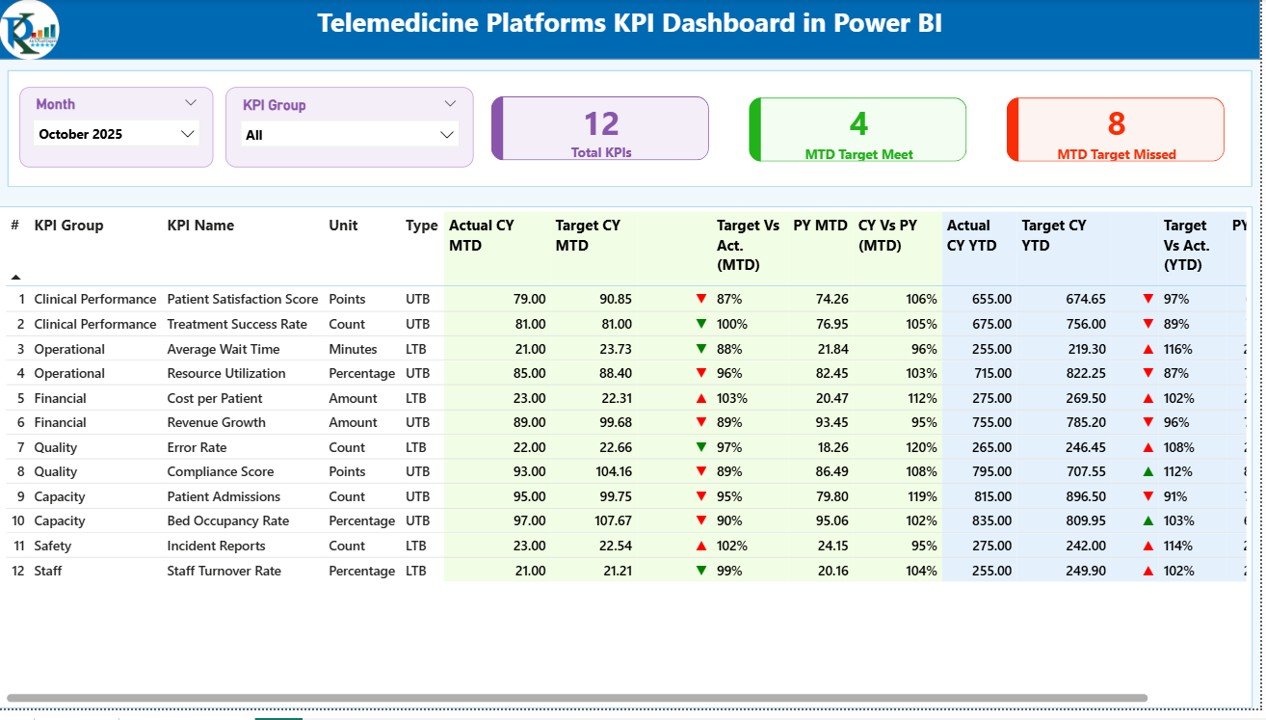
📌 1. Summary Page – Get Complete KPI Overview
The Summary Page acts as the main control center of the dashboard.
🔹 Top Section:
-
Month slicer
-
KPI Group slicer
📊 KPI Cards:
-
Total KPIs Count
-
MTD Target Met Count
-
MTD Target Missed Count
📋 Detailed KPI Table Includes:
-
KPI Number
-
KPI Group
-
KPI Name
-
Unit
-
KPI Type (LTB or UTB)
📈 Performance Metrics:
-
Actual CY MTD
-
Target CY MTD
-
MTD Status Icons (▲ ▼ with color indicators)
-
Target vs Actual (MTD %)
-
Previous Year MTD
-
CY vs PY (MTD %)
📊 YTD Metrics:
-
Actual CY YTD
-
Target CY YTD
-
YTD Status Icons
-
Target vs Actual (YTD %)
-
Previous Year YTD
-
CY vs PY (YTD %)
🎯 Why It Matters:
Because this page provides a complete KPI snapshot, users can quickly evaluate performance and take action.
Click to Buy Telemedicine Platforms KPI Dashboard in Power BI
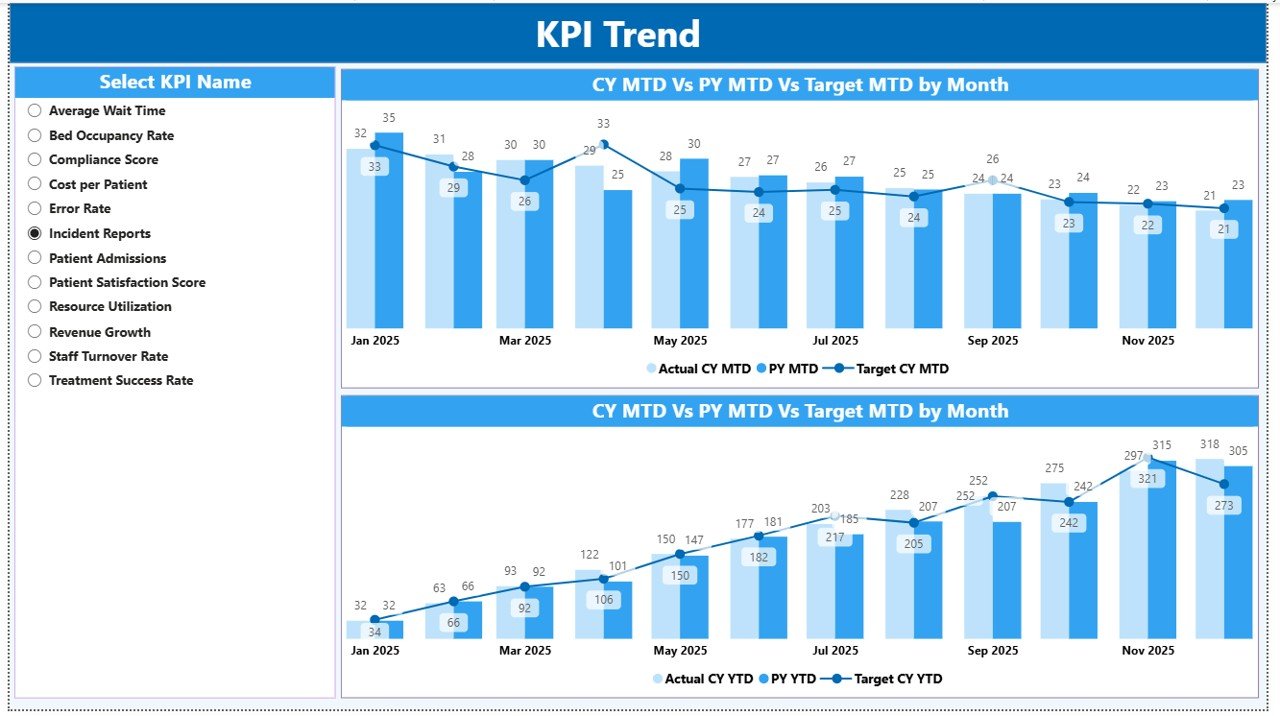
📈 2. KPI Trend Page – Analyze Performance Over Time
This page focuses on trend analysis.
📊 Key Features:
-
Two combo charts for MTD and YTD
-
Comparison of:
-
Current Year Actual
-
Previous Year Actual
-
Target values
-
🎛️ Filter Option:
-
KPI Name slicer for detailed analysis
🔍 Insights You Can Get:
-
KPI performance trends over time
-
Target achievement patterns
-
Year-over-year comparison
🚀 Why It Matters:
Because trends reveal patterns, this page helps predict future performance and improve planning.
Click to Buy Telemedicine Platforms KPI Dashboard in Power BI
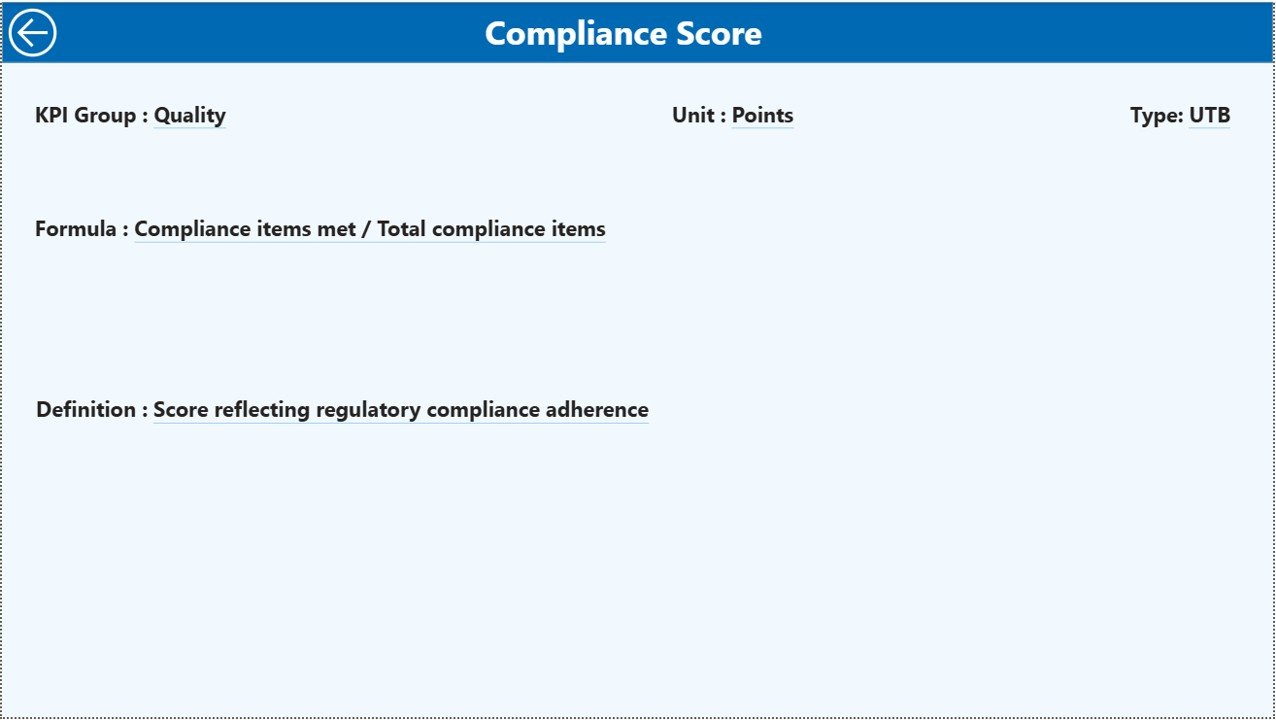
📘 3. KPI Definition Page – Deep Dive into KPIs
This is a drill-through hidden page.
📊 Key Details:
-
KPI Formula
-
KPI Definition
-
KPI Type
🔄 Navigation:
-
Drill-through from Summary Page
-
Back button to return
🎯 Why It Matters:
Because understanding KPIs is critical, this page provides complete clarity on calculations and definitions.
Click to Buy Telemedicine Platforms KPI Dashboard in Power BI
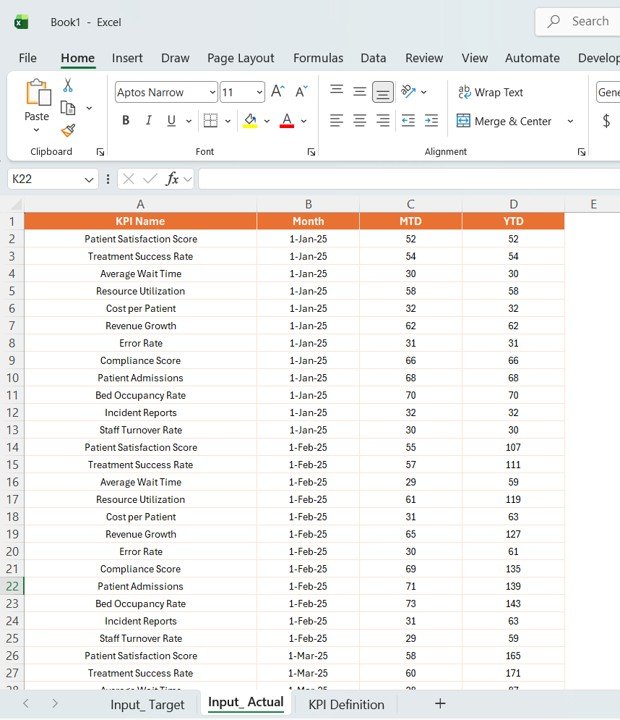
Excel Data Structure Used in the Dashboard
This dashboard uses an Excel file as the data source.
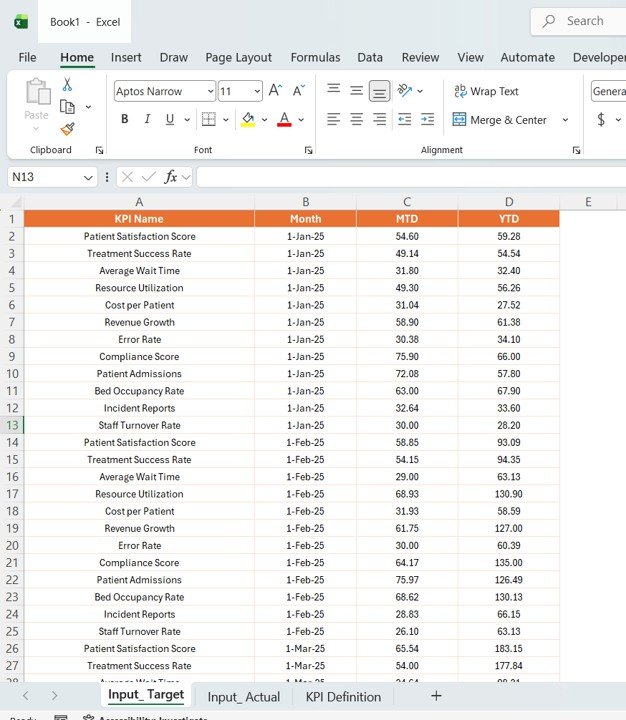
📊 1. Input_Actual Sheet
Here, you enter:
-
KPI Name
-
Month (first date of the month)
-
MTD values
-
YTD values
Click to Buy Telemedicine Platforms KPI Dashboard in Power BI
🎯 2. Input_Target Sheet
Here, you input:
-
KPI Name
-
Month
-
Target MTD values
-
Target YTD values
Click to Buy Telemedicine Platforms KPI Dashboard in Power BI
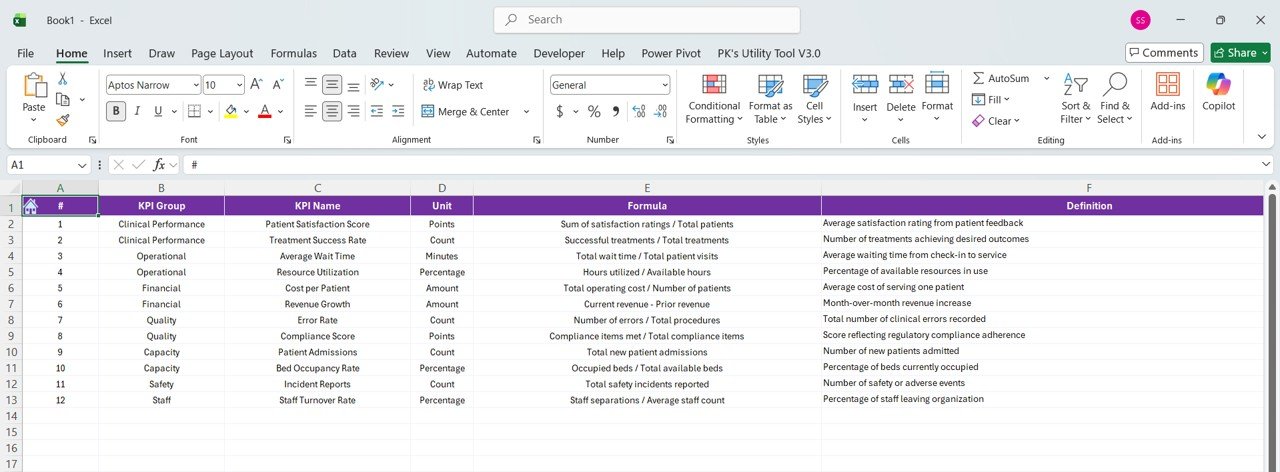
📘 3. KPI Definition Sheet
This sheet includes:
-
KPI Number
-
KPI Group
-
KPI Name
-
Unit
-
Formula
-
Definition
-
Type (LTB or UTB)
Click to Buy Telemedicine Platforms KPI Dashboard in Power BI
Advantages of Telemedicine Platforms KPI Dashboard in Power BI
Using this dashboard provides multiple benefits.
Key Advantages:
-
📊 Centralized KPI Tracking
You can monitor all healthcare KPIs in one place. -
⚡ Real-Time Performance Monitoring
You can track performance instantly. -
📉 Better Decision-Making
You can rely on data instead of assumptions. -
📈 Improved Target Tracking
You can easily compare targets vs actuals. -
🧠 Enhanced Operational Efficiency
You can reduce manual reporting efforts. -
🏥 Better Patient Outcomes
You can improve service quality and response time.
Opportunities for Improvement
Although the dashboard is powerful, you can enhance it further.
💡 Suggested Improvements:
-
Add patient satisfaction KPIs
-
Integrate live hospital systems
-
Include predictive analytics
-
Add doctor performance metrics
-
Enable mobile dashboard access
As a result, you can increase the dashboard’s value.
Best Practices for the Telemedicine KPI Dashboard
Click to Buy Telemedicine Platforms KPI Dashboard in Power BI
To get the best results, you should follow these best practices.
✅ Best Practices:
-
📊 Use Accurate Data
Always ensure data accuracy. -
🔄 Update Data Regularly
Keep your dashboard up to date. -
🎯 Focus on Important KPIs
Avoid unnecessary metrics. -
📌 Use Clear Visuals
Keep charts simple and meaningful. -
⚡ Optimize Performance
Avoid heavy calculations. -
🔍 Use Drill-Through Features
Enable deeper analysis. -
🎨 Maintain Consistent Design
Use uniform colors and layout.
Conclusion
Click to Buy Telemedicine Platforms KPI Dashboard in Power BI
The Telemedicine Platforms KPI Dashboard in Power BI is a powerful tool for healthcare analytics. It transforms complex data into actionable insights.
Moreover, it helps organizations track KPIs, improve performance, and make smarter decisions. As a result, healthcare providers can deliver better patient care and optimize operations.
If you want to improve telemedicine performance, this dashboard is a must-have solution.
Visit our YouTube channel to learn step-by-step video tutorials
Click to Buy Telemedicine Platforms KPI Dashboard in Power BI