Managing a theme park involves hundreds of moving parts every single day. From visitor footfall and ride availability to revenue, safety, and customer satisfaction, everything needs close monitoring. However, when teams rely on scattered spreadsheets and manual reports, decision-making becomes slow and risky. That is exactly why a Theme Parks KPI Dashboard in Excel plays a critical role.
In this detailed guide, you will learn what a Theme Parks KPI Dashboard in Excel is, why it matters, how it works, and how you can use it to monitor performance clearly and confidently. Moreover, you will explore its key features, advantages, best practices, and frequently asked questions.
If you manage a theme park, water park, amusement park, or entertainment facility, this article will help you take full control of your KPIs using Excel.
Click to buy Theme Parks KPI Dashboard in Excel
What Is a Theme Parks KPI Dashboard in Excel?
A Theme Parks KPI Dashboard in Excel is a centralized reporting and analysis tool that tracks key performance indicators related to theme park operations. It transforms raw operational data into meaningful visuals, trends, and performance indicators.
Instead of opening multiple files or preparing manual reports, you can view all critical KPIs on a single dashboard. As a result, you gain instant clarity about what works well and what needs attention.
Because Excel supports formulas, conditional formatting, charts, and dropdowns, this dashboard remains both powerful and flexible. Moreover, teams can update data easily without technical expertise.
Why Do Theme Parks Need a KPI Dashboard?
Theme parks operate in a fast-paced environment where real-time insights matter. When visitor expectations rise and operational costs increase, managers must make quick and informed decisions.
Here is why a KPI dashboard becomes essential:
- It helps track performance across multiple KPIs at once
- It improves visibility into monthly and yearly performance
- It reduces reporting time significantly
- It supports data-driven decision-making
- It ensures accountability across departments
Because everything stays in one Excel file, teams collaborate better and act faster.
How Does a Theme Parks KPI Dashboard in Excel Work?
A Theme Parks KPI Dashboard in Excel works by separating data input, definitions, and analysis into structured worksheets. Each sheet serves a clear purpose. Together, they create a seamless flow from raw data to actionable insights.
You simply enter actual values, targets, and previous year numbers. Then, the dashboard automatically calculates performance metrics and updates visuals. As you change the month or KPI selection, all related numbers refresh instantly.
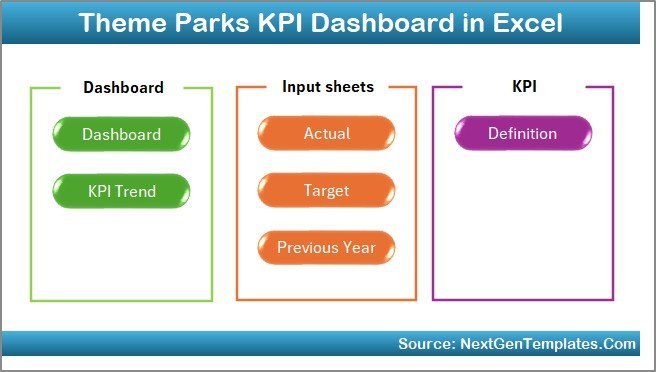
Overview of Worksheets in the Theme Parks KPI Dashboard in Excel
This dashboard includes seven well-designed worksheets, each created to serve a specific analytical purpose.
What Is the Purpose of the Summary Page?
Summary Page (Index Sheet)
The Summary Page acts as the navigation hub of the entire dashboard.
Key highlights of this sheet include:
- Six interactive buttons
- One-click navigation to all major sheets
- Clean and user-friendly layout
Because of this index-style design, users move between analysis pages quickly. As a result, even non-technical users feel comfortable using the dashboard.
Click to buy Theme Parks KPI Dashboard in Excel
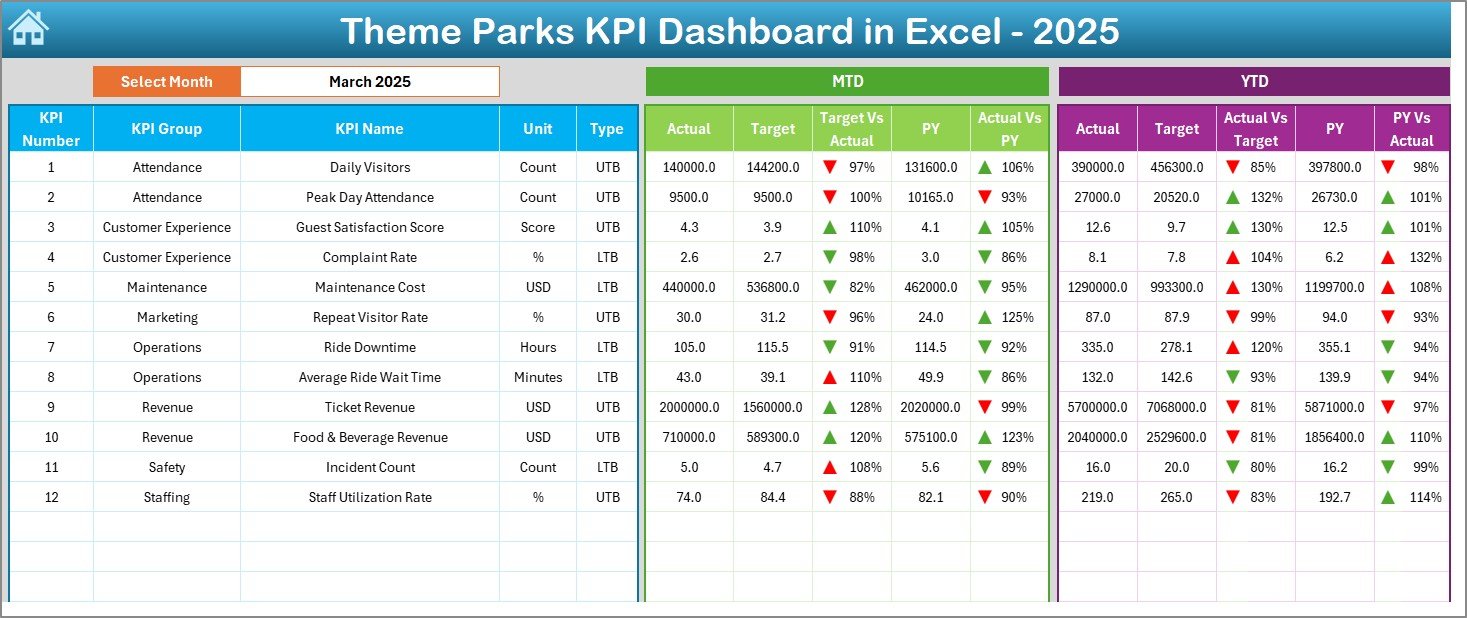
What Information Does the Dashboard Sheet Show?
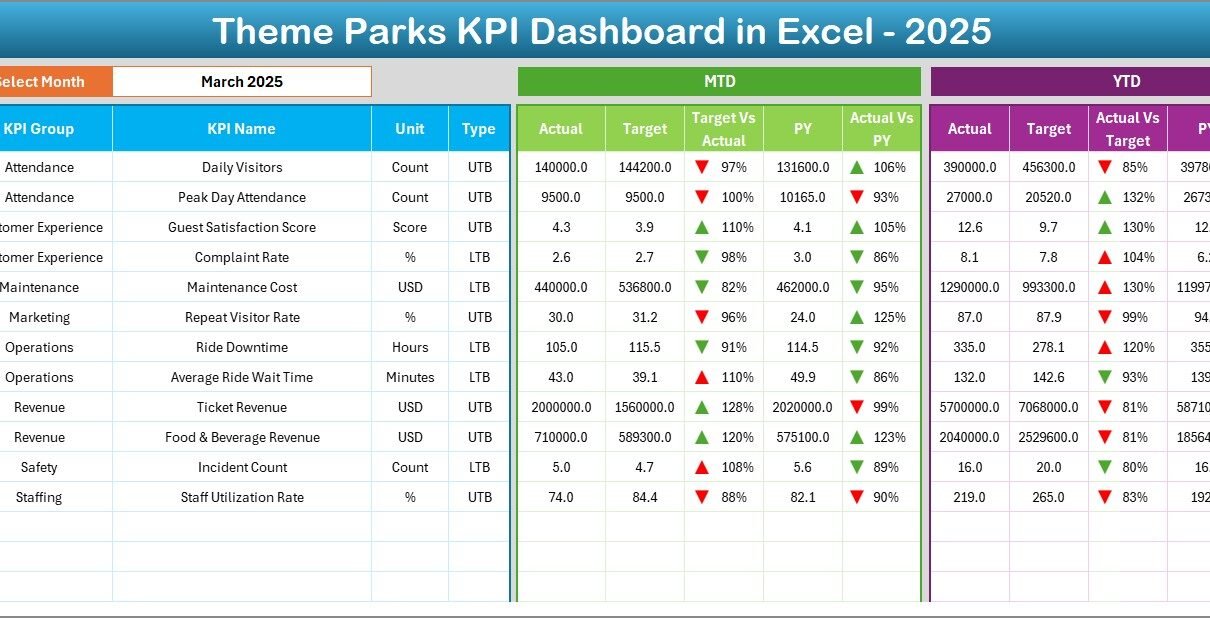
Dashboard Sheet
The Dashboard Sheet serves as the heart of the Theme Parks KPI Dashboard in Excel. This is where you see the complete performance snapshot.
Key features of this sheet include:
- Month selector available in cell D3
- Automatic update of all KPI values based on selected month
- Clear comparison between actuals, targets, and previous year data
What Metrics Does the Dashboard Display?
The dashboard shows both MTD (Month-to-Date) and YTD (Year-to-Date) metrics:
MTD Section Includes:
- Actual values
- Target values
- Previous Year values
- Target vs Actual variance
- Previous Year vs Actual variance
YTD Section Includes:
- Actual values
- Target values
- Previous Year values
- Target vs Actual variance
- Previous Year vs Actual variance
Moreover, conditional formatting with up and down arrows instantly highlights performance trends. Therefore, managers can identify positive and negative movements at a glance.
Click to buy Theme Parks KPI Dashboard in Excel
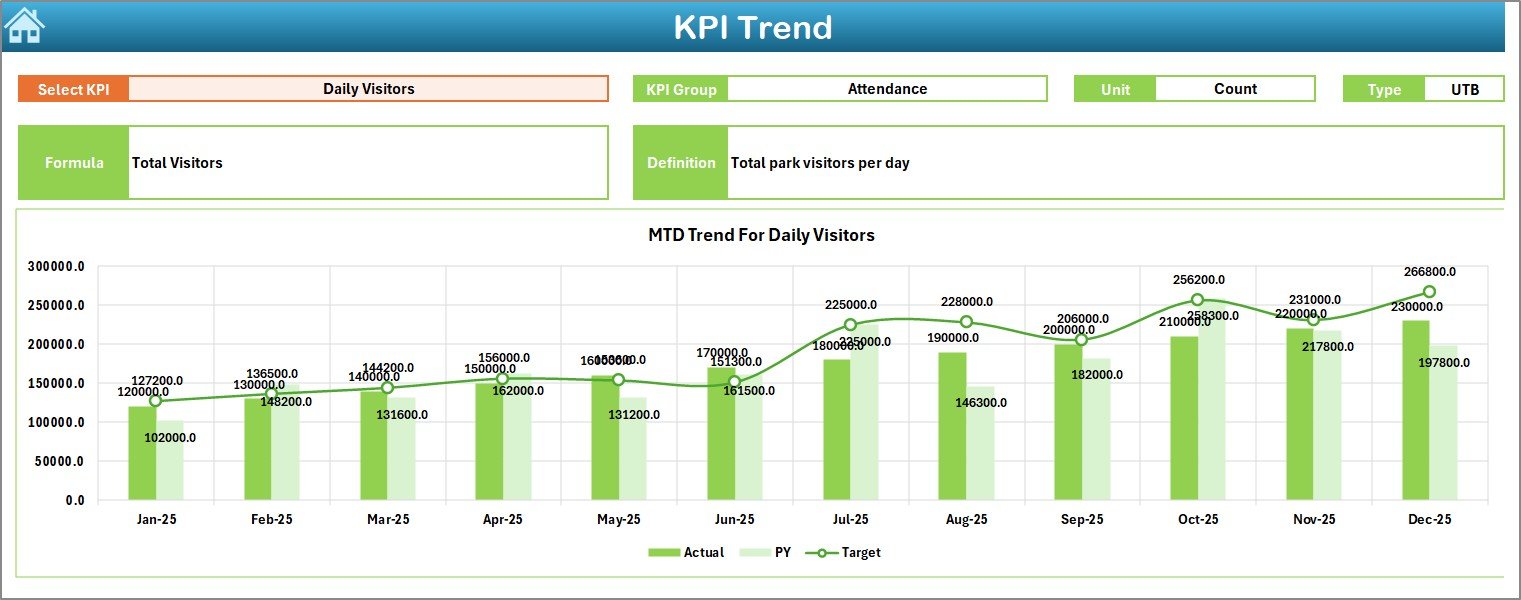
How Does the Trend Sheet Help in KPI Analysis?
Trend Sheet
The Trend Sheet focuses on deep-dive KPI analysis. Instead of viewing all KPIs at once, you analyze one KPI in detail.
Here, you select a KPI name from the dropdown in cell C3.
Once selected, the sheet displays:
- KPI Group
- Unit of KPI
- KPI Type (Lower the Better or Upper the Better)
- KPI Formula
- KPI Definition
What Charts Are Available in the Trend Sheet?
The Trend Sheet includes:
- MTD trend chart for Actual, Target, and Previous Year
- YTD trend chart for Actual, Target, and Previous Year
Because trends appear visually, decision-makers quickly understand performance direction. Additionally, this sheet supports strategic planning and forecasting.
Click to buy Theme Parks KPI Dashboard in Excel
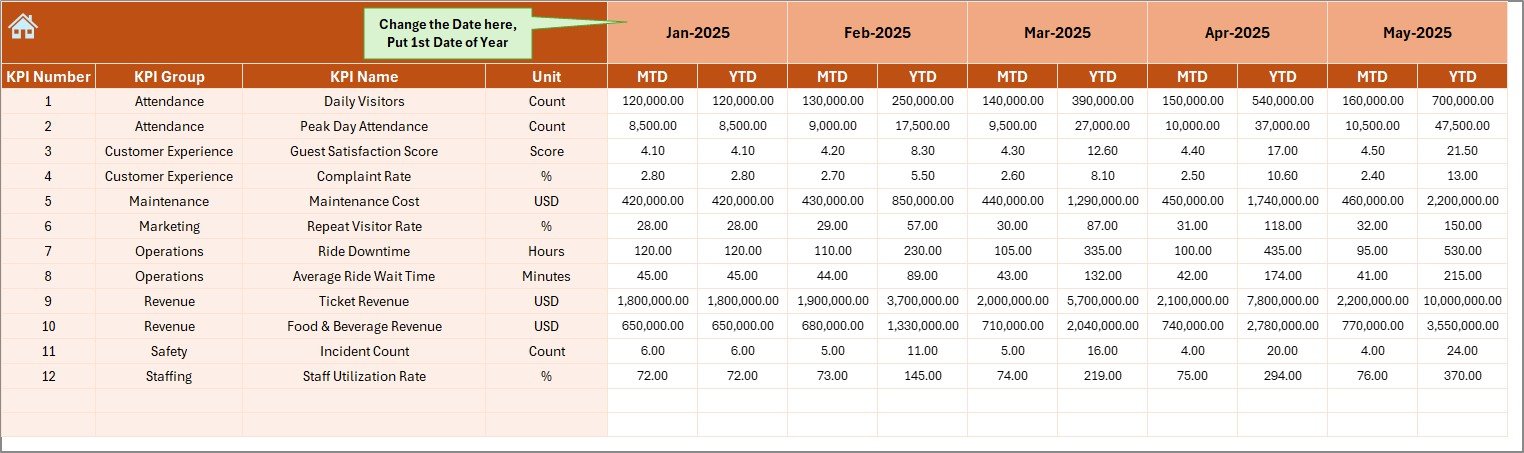
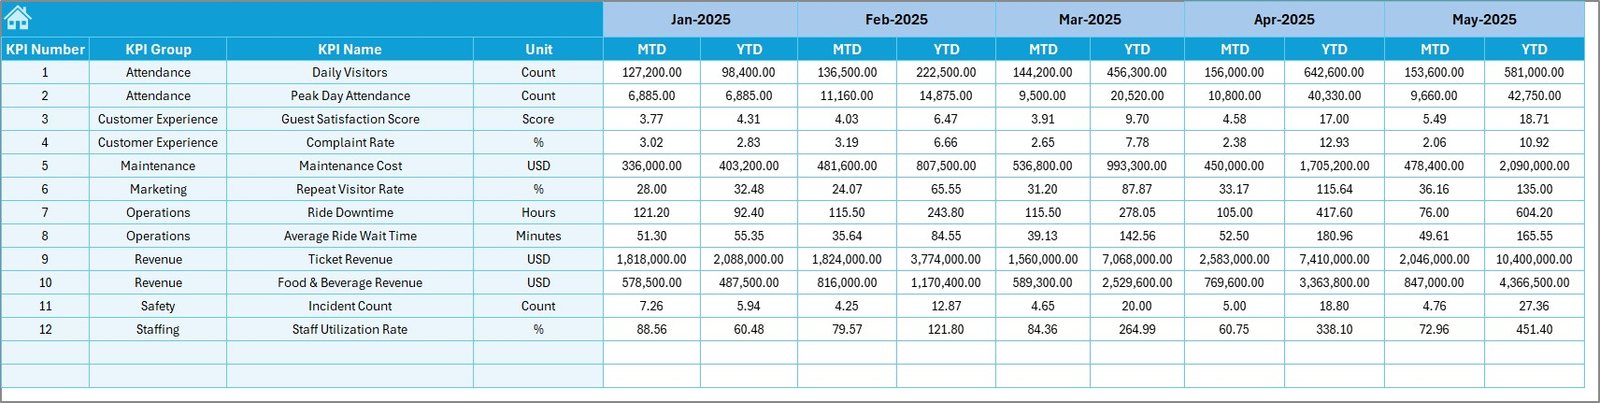
How Do You Enter Actual Numbers in the Dashboard?
Actual Numbers Input Sheet
The Actual Numbers Input Sheet allows users to enter real performance data.
Important features include:
- Month control available in cell E1
- Input fields for both MTD and YTD actual values
- Flexible month selection for the entire year
You only need to enter the first month of the year once. After that, the dashboard adjusts calculations automatically. As a result, data entry remains fast and accurate.
Click to buy Theme Parks KPI Dashboard in Excel
How Are Targets Managed in the Dashboard?
Target Sheet
The Target Sheet stores target values for each KPI.
In this sheet, you enter:
- Monthly target values (MTD)
- Year-to-date target values (YTD)
Because targets remain separate from actuals, the dashboard maintains clarity and accuracy. Moreover, this structure allows easy updates when business goals change.
Click to buy Theme Parks KPI Dashboard in Excel
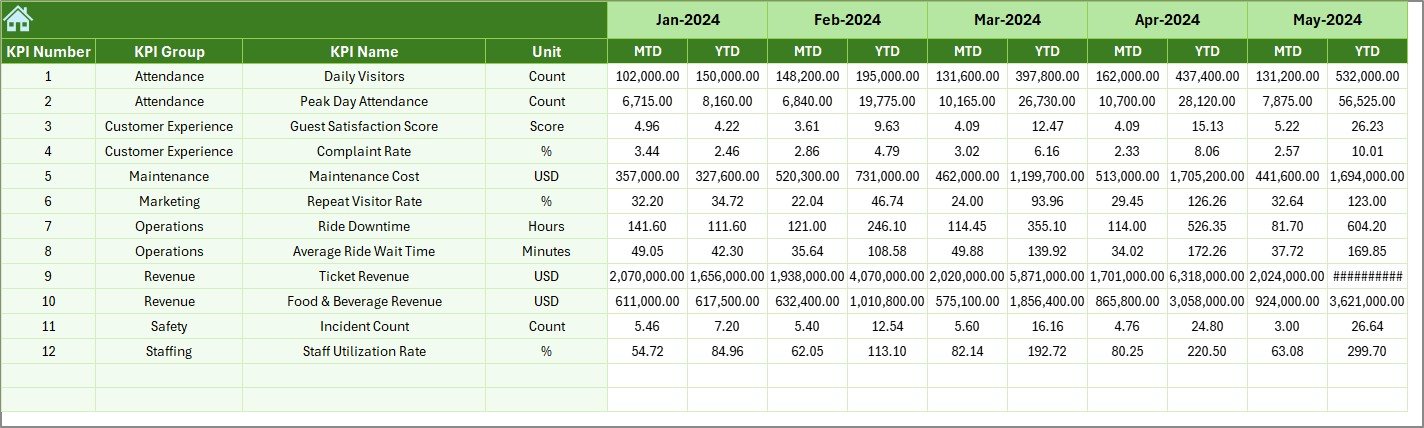
Why Is Previous Year Data Important?
Previous Year Numbers Sheet
The Previous Year Numbers Sheet captures historical performance data.
You enter values in the same format as current year data. This consistency ensures accurate year-over-year comparison.
With this data, the dashboard automatically calculates:
- PY vs Actual variance
- Growth or decline indicators
Therefore, managers quickly understand whether performance improves or declines compared to last year.
Click to buy Theme Parks KPI Dashboard in Excel
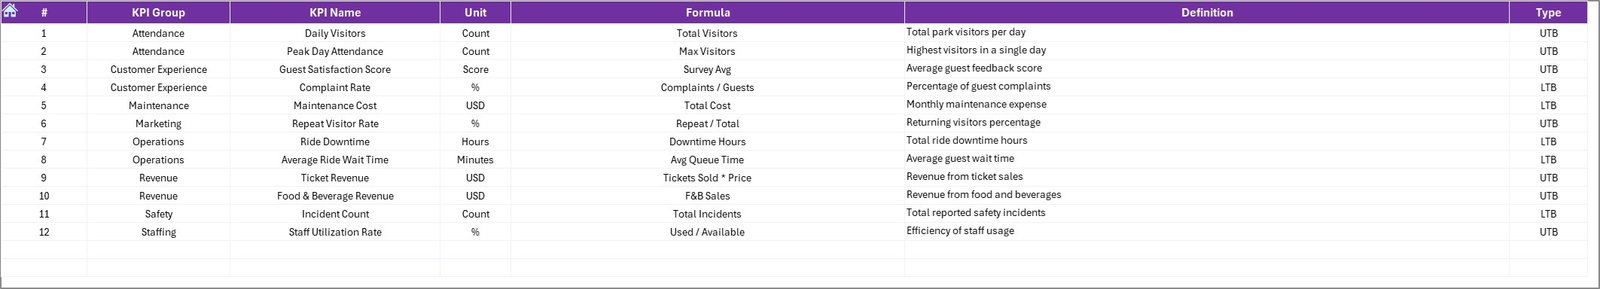
What Is the Role of the KPI Definition Sheet?
KPI Definition Sheet
The KPI Definition Sheet ensures clarity and standardization across the organization.
In this sheet, you define:
- KPI Name
- KPI Group
- Unit of Measurement
- KPI Formula
- KPI Definition
Because definitions remain documented, teams avoid confusion and misinterpretation. Additionally, new users understand KPIs without external documentation.
Click to buy Theme Parks KPI Dashboard in Excel
Advantages of Theme Parks KPI Dashboard in Excel
A Theme Parks KPI Dashboard in Excel delivers several practical benefits for operations and leadership teams.
Key Advantages Include:
- Centralized KPI monitoring in one file
- Easy data entry without technical skills
- Instant month and KPI selection
- Clear MTD and YTD visibility
- Automated variance calculations
- Visual performance indicators using arrows
- Strong support for trend analysis
- Improved accountability and transparency
Because Excel remains widely used, organizations can implement this dashboard without additional software costs.
How Does This Dashboard Improve Decision-Making?
This dashboard transforms raw numbers into actionable insights. Managers no longer rely on gut feelings. Instead, they use data to guide decisions.
It helps leaders:
- Identify underperforming KPIs quickly
- Track seasonal trends in visitor and revenue metrics
- Compare current performance with past results
- Align teams with business goals
- Respond faster to operational issues
As a result, theme parks operate more efficiently and profitably.
Best Practices for the Theme Parks KPI Dashboard in Excel
To get maximum value from your dashboard, follow these best practices.
- Define KPIs Clearly
Always document KPI definitions, formulas, and units. This avoids confusion and ensures consistency.
- Update Data Regularly
Enter actuals, targets, and previous year numbers on time. Accurate data drives accurate insights.
- Use Consistent Units
Ensure all KPIs use consistent units such as percentages, counts, or currency.
- Review Trends Monthly
Analyze trend charts every month. This habit helps detect issues early.
- Avoid Overloading KPIs
Track only meaningful KPIs. Too many metrics reduce focus.
- Train Users Briefly
A short walkthrough helps teams use the dashboard confidently and correctly.
Who Should Use a Theme Parks KPI Dashboard in Excel?
This dashboard suits multiple roles within a theme park organization:
- Operations Managers
- Finance Teams
- Park Directors
- Strategy Teams
- Senior Leadership
Because it remains easy to use, both technical and non-technical users benefit equally.
How Does This Dashboard Support Business Growth?
When teams measure the right KPIs consistently, they improve performance naturally. This dashboard helps align daily operations with long-term goals.
It supports growth by:
- Highlighting revenue opportunities
- Reducing inefficiencies
- Improving guest experience metrics
- Strengthening performance accountability
Over time, data-driven culture becomes part of everyday decision-making.
Conclusion: Why Should You Use a Theme Parks KPI Dashboard in Excel?
A Theme Parks KPI Dashboard in Excel simplifies performance tracking while delivering powerful insights. It combines structured data input, smart calculations, and visual clarity in one easy-to-use file.
By using this dashboard, theme park teams gain control, confidence, and clarity. They spend less time creating reports and more time improving results. Ultimately, this dashboard turns data into decisions that drive success.
Frequently Asked Questions (FAQs)
What KPIs can I track in a Theme Parks KPI Dashboard in Excel?
You can track visitor numbers, revenue, operational efficiency, safety metrics, customer satisfaction, ride uptime, and more.
Can I customize the KPIs in this dashboard?
Yes, you can fully customize KPIs by updating the KPI Definition Sheet and related input sheets.
Does this dashboard support monthly and yearly analysis?
Yes, it supports both MTD and YTD analysis along with previous year comparisons.
Is technical knowledge required to use this dashboard?
No, basic Excel knowledge is enough to operate and update this dashboard.
Can I use this dashboard for multiple theme parks?
Yes, you can adapt the dashboard for multiple parks by adjusting KPIs and data inputs.
Why should I use Excel instead of other BI tools?
Excel offers flexibility, familiarity, and cost-effectiveness without sacrificing analytical power.
Visit our YouTube channel to learn step-by-step video tutorials
Watch the step-by-step video tutorial:
Click to buy Theme Parks KPI Dashboard in Excel