In today’s fast-moving supply chain world, logistics companies must track shipments, freight costs, fuel surcharges, and customer satisfaction in real time. However, many 3PL providers still rely on scattered spreadsheets and manual reports. As a result, they struggle to control costs, monitor delivery performance, and maintain high client satisfaction.
Therefore, businesses need a centralized, interactive, and easy-to-use reporting solution. The Third-Party Logistics (3PL) Dashboard in Excel provides exactly that. It transforms raw logistics data into meaningful visual insights. Moreover, it helps logistics managers, warehouse heads, and supply chain leaders track performance, improve efficiency, and increase profitability.
Click to Purchases Third-Party Logistics (3PL) Dashboard in Excel
In this detailed guide, you will learn:
-
What a 3PL Dashboard in Excel is
-
Why 3PL companies need it
-
Detailed explanation of all 5 dashboard pages
-
Key metrics tracked in the dashboard
-
Advantages of the 3PL Dashboard
-
Best practices for using the dashboard
-
Frequently Asked Questions with answers
Let’s explore everything step by step.
What Is a Third-Party Logistics (3PL) Dashboard in Excel?
A Third-Party Logistics (3PL) Dashboard in Excel is an interactive performance monitoring tool built inside Microsoft Excel. It helps logistics companies track shipment performance, freight costs, fuel surcharges, warehouse usage, and customer ratings in one place.
Instead of checking multiple sheets manually, managers can:
-
Track In-Transit Delivery %
-
Monitor Total Shipments by Warehouse
-
Analyze Freight Cost by Industry and Region
-
Compare Revenue by Transport Mode
-
Evaluate Customer Ratings by Client
As a result, decision-makers gain full visibility into operational and financial performance.
Why Do 3PL Companies Need a Dashboard?
Logistics operations involve multiple moving parts. You manage warehouses, transport modes, industries, clients, and regions simultaneously. Without structured reporting, confusion increases quickly.
However, when you use a structured dashboard:
-
You identify cost-heavy industries immediately
-
You detect delivery performance gaps quickly
-
You monitor customer satisfaction regularly
-
You improve revenue planning with clear monthly insights
Therefore, a 3PL dashboard does not just display numbers. Instead, it supports smarter decisions.
Key Features of the Third-Party Logistics (3PL) Dashboard in Excel
This ready-to-use Excel dashboard includes 5 analytical pages, along with a Support Sheet and Data Sheet.
Additionally, a Page Navigator on the left side allows easy navigation across all pages. On the right side, interactive slicers help filter data by different categories.
Let’s explore each page in detail.
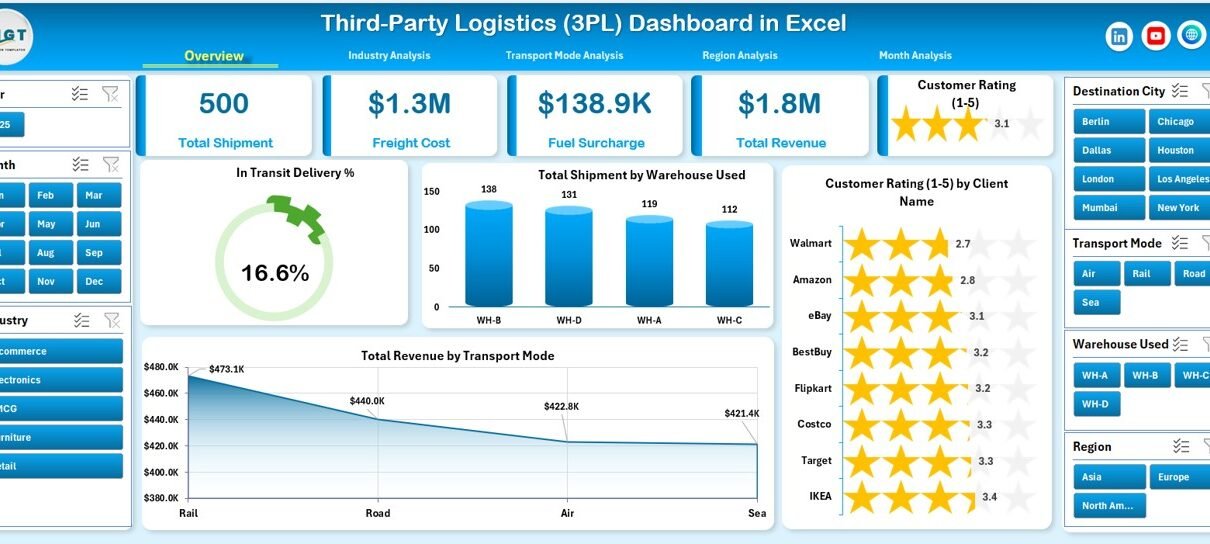
1️⃣ Overview Page – Complete Performance Snapshot
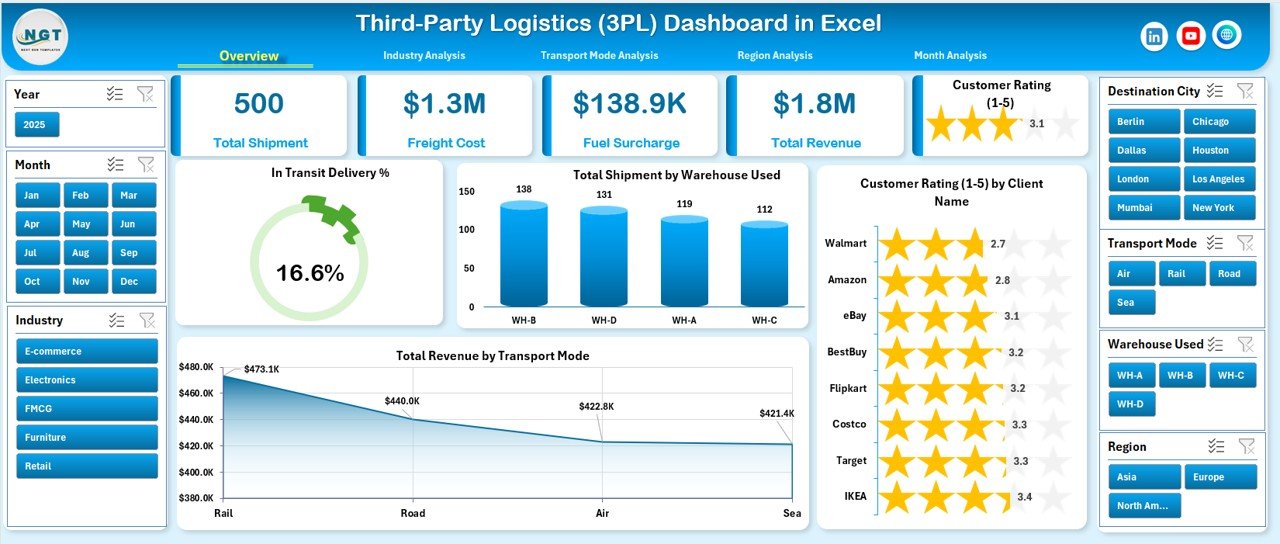
The Overview Page acts as the control center of the dashboard.
KPI Cards Included:
-
In-Transit Delivery %
-
Total Shipments by Warehouse Used
-
Customer Rating by Client Name
-
Total Revenue by Transport Mode
Charts Included:
-
In-Transit Delivery %
-
Total Shipment by Warehouse Used
-
Customer Rating by Client Name
-
Total Revenue by Transport Mode
With this page, you immediately understand:
-
How well shipments perform
-
Which warehouse handles the most shipments
-
Which clients provide higher ratings
-
Which transport mode generates higher revenue
As a result, you get instant operational clarity.
Click to Purchases Third-Party Logistics (3PL) Dashboard in Excel
2️⃣ Industry Analysis – Industry-Wise Performance Insights
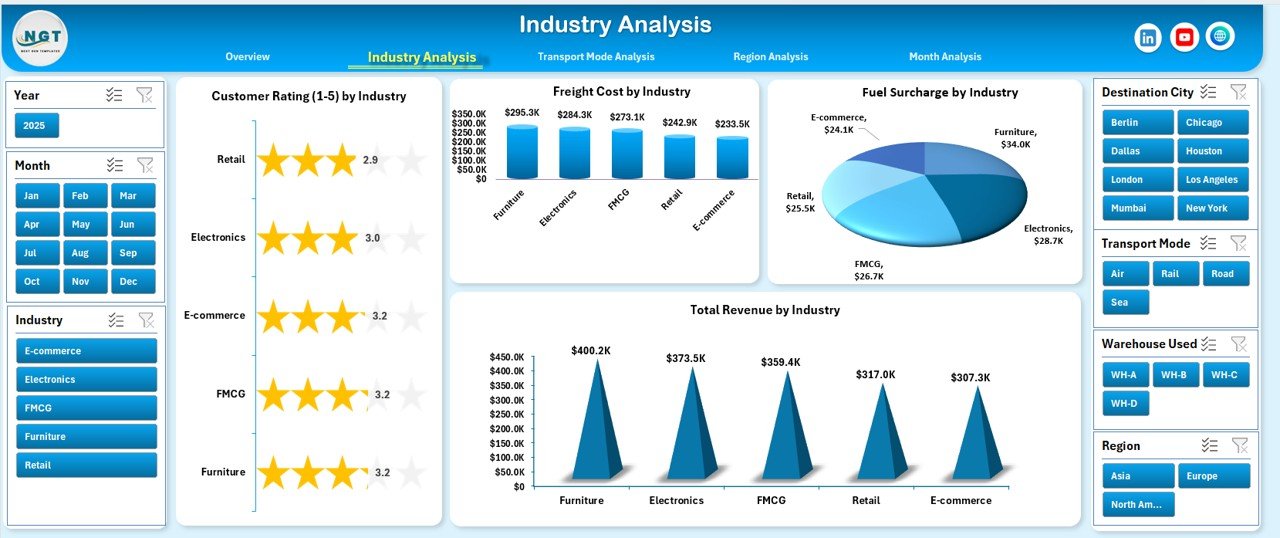
Different industries generate different freight volumes and costs. Therefore, this page helps analyze logistics performance by industry.
Charts Included:
-
Customer Rating by Industry
-
Freight Cost by Industry
-
Fuel Surcharge by Industry
-
Total Revenue by Industry
With this analysis, managers can:
-
Identify high-revenue industries
-
Detect industries with high freight costs
-
Monitor fuel surcharge impact
-
Improve pricing strategy by industry
Consequently, you optimize profitability across sectors.
3️⃣ Transport Mode Analysis – Compare Road, Air, Sea & Rail
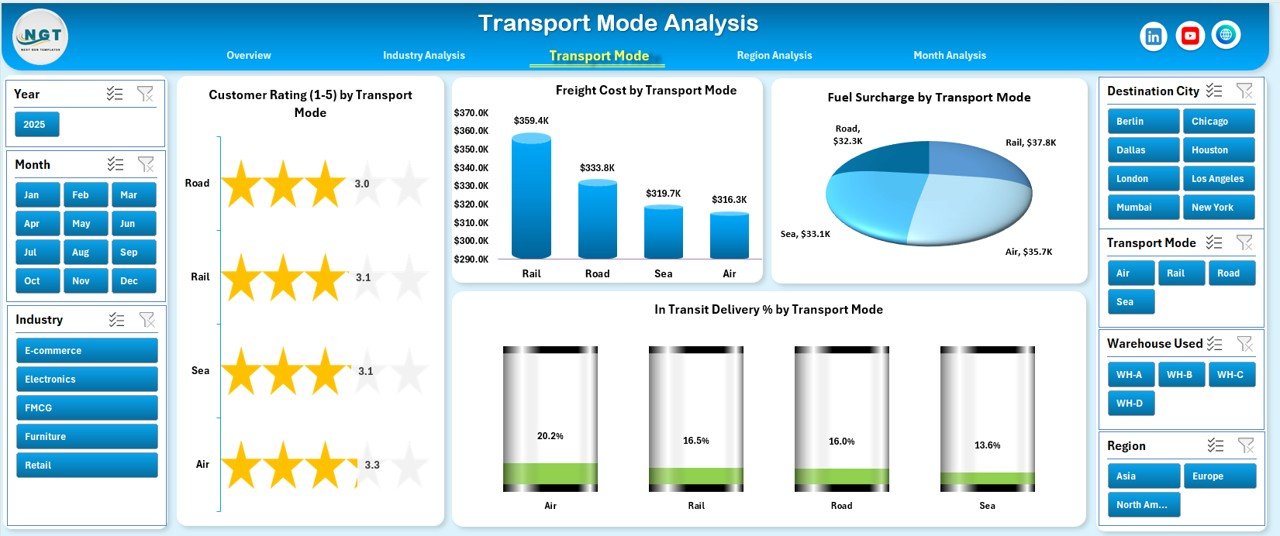
Transport mode significantly impacts cost and delivery time. Therefore, this page focuses on performance by transport type.
Charts Included:
-
Customer Rating by Transport Mode
-
Freight Cost by Transport Mode
-
Fuel Surcharge by Transport Mode
-
In-Transit Delivery % by Transport Mode
This page helps you:
-
Compare delivery performance across modes
-
Detect expensive transport methods
-
Improve mode selection strategy
-
Increase delivery reliability
As a result, you balance cost and performance effectively.
Click to Purchases Third-Party Logistics (3PL) Dashboard in Excel
4️⃣ Region Analysis – Geographic Performance Tracking
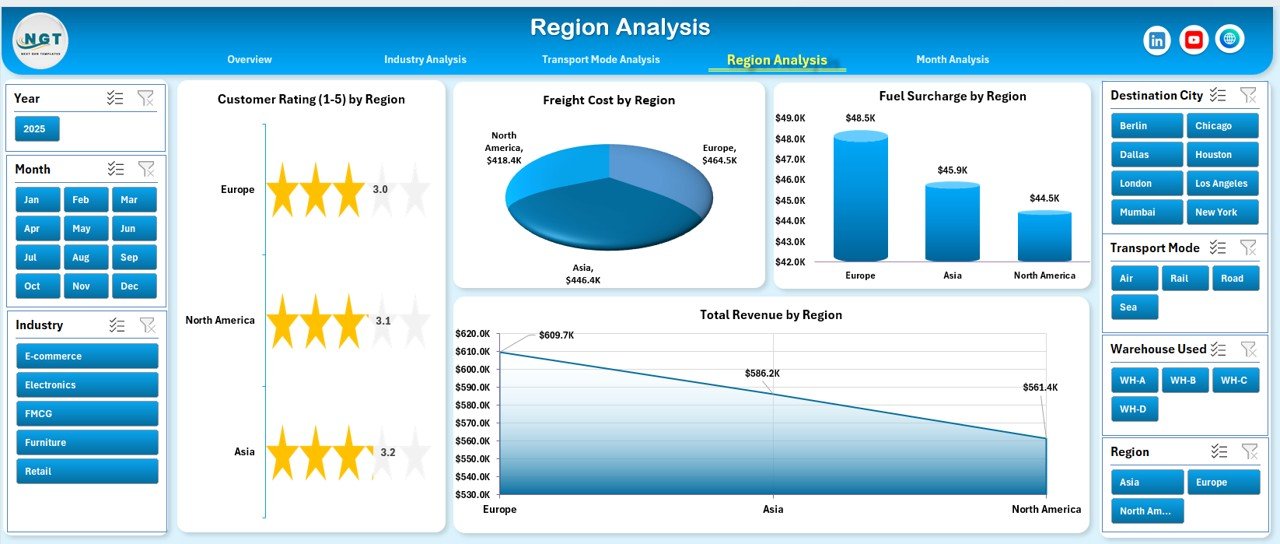
Regional performance varies due to infrastructure, fuel pricing, and demand. Therefore, this page highlights region-wise analytics.
Charts Included:
-
Customer Rating by Region
-
Freight Cost by Region
-
Fuel Surcharge by Region
-
Total Revenue by Region
With this page, managers can:
-
Identify top-performing regions
-
Control high-cost zones
-
Optimize regional pricing
-
Improve service quality geographically
Thus, you strengthen your regional strategy.
5️⃣ Month Analysis – Monthly Trend Monitoring
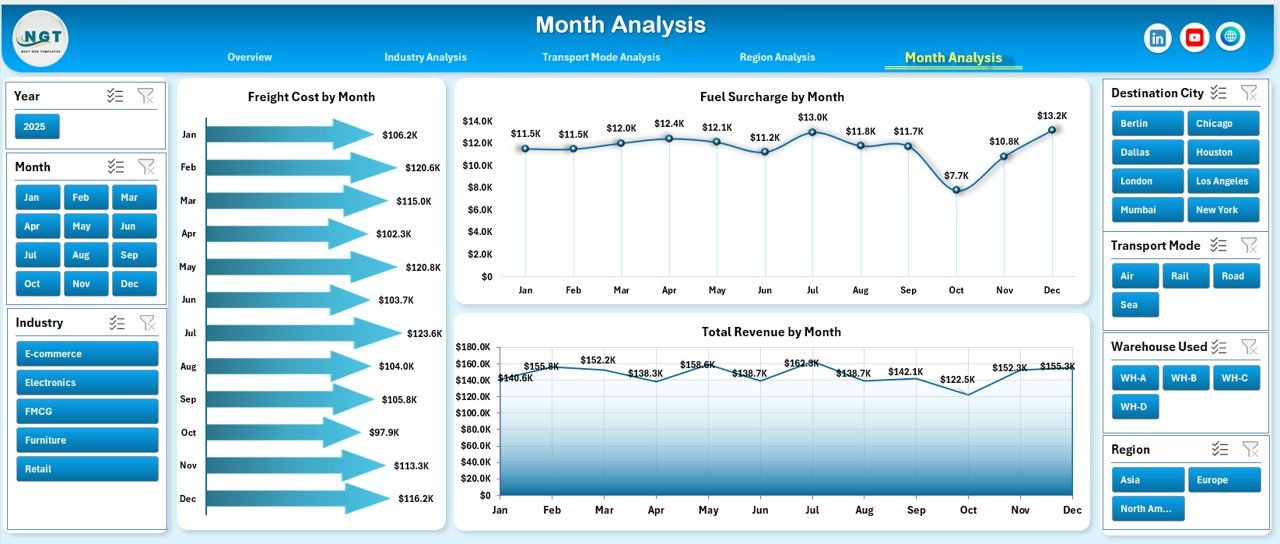
Monthly tracking helps forecast revenue and manage seasonal demand.
Charts Included:
-
Freight Cost by Month
-
Fuel Surcharge by Month
-
Total Revenue by Month
This page enables you to:
-
Monitor monthly cost trends
-
Identify seasonal spikes
-
Improve financial forecasting
-
Track revenue growth patterns
Therefore, you gain better financial planning control.
What Data Does the Dashboard Use?
Click to Purchases Third-Party Logistics (3PL) Dashboard in Excel
The dashboard includes:
Data Sheet:
This sheet stores raw logistics data such as:
-
Shipment ID
-
Warehouse
-
Industry
-
Region
-
Transport Mode
-
Freight Cost
-
Fuel Surcharge
-
Revenue
-
Customer Rating
-
Delivery Status
-
Month
Support Sheet:
This sheet supports dropdown lists, validations, and calculation references.
As a result, the dashboard remains dynamic and interactive.
Key Metrics Tracked in the 3PL Dashboard
The dashboard monitors essential KPIs such as:
-
In-Transit Delivery %
-
Total Shipments
-
Freight Cost
-
Fuel Surcharge
-
Total Revenue
-
Customer Rating
-
Warehouse Utilization
Because these KPIs directly affect profitability, managers can act quickly.
Advantages of Third-Party Logistics (3PL) Dashboard in Excel
Click to Purchases Third-Party Logistics (3PL) Dashboard in Excel
Using this dashboard provides multiple benefits.
1️⃣ Improved Operational Visibility
You see shipment status, warehouse usage, and transport performance instantly. Therefore, you avoid guesswork.
2️⃣ Better Cost Control
You monitor freight cost and fuel surcharge across industries and regions. As a result, you identify high-cost areas quickly.
3️⃣ Increased Customer Satisfaction
You track customer ratings by client, industry, and region. Consequently, you improve service quality proactively.
4️⃣ Smarter Revenue Planning
You analyze revenue by transport mode, industry, and month. Therefore, you improve forecasting accuracy.
5️⃣ Easy Implementation
Since Excel supports this dashboard, you do not need expensive software. Moreover, your team can customize it easily.
How Does the 3PL Dashboard Improve Decision-Making?
The dashboard supports decision-making because:
-
It centralizes all logistics data
-
It highlights trends visually
-
It allows real-time filtering
-
It simplifies comparison
Therefore, managers spend less time analyzing and more time improving operations.
Best Practices for the Third-Party Logistics (3PL) Dashboard in Excel
To maximize results, follow these best practices.
1️⃣ Update Data Regularly
Always update shipment data weekly or monthly. Otherwise, insights lose accuracy.
2️⃣ Use Consistent Data Format
Maintain consistent naming for industries, regions, and transport modes. This ensures accurate reporting.
3️⃣ Monitor KPIs Frequently
Review delivery %, freight cost, and revenue every month. As a result, you detect problems early.
4️⃣ Analyze Trends, Not Just Numbers
Focus on trends over time instead of single-month data. This improves long-term strategy.
5️⃣ Share Insights with Your Team
Use dashboard screenshots during meetings. Consequently, your team aligns with performance goals.
Who Can Benefit from This Dashboard?
This dashboard benefits:
-
3PL Companies
-
Freight Forwarders
-
Warehouse Managers
-
Supply Chain Managers
-
Logistics Consultants
-
Transport Companies
Therefore, any logistics-focused business can improve performance using this tool.
How to Implement the 3PL Dashboard Successfully?
Follow these steps:
-
Collect structured shipment data
-
Clean and validate data
-
Upload data into the Data Sheet
-
Review KPI calculations
-
Use slicers for dynamic filtering
-
Monitor results monthly
As a result, you ensure smooth implementation.
Common Challenges in 3PL Reporting (And How This Dashboard Solves Them)
Challenge 1: Scattered Reports
Solution: Centralized Excel dashboard.
Challenge 2: High Freight Costs
Solution: Industry and region cost breakdown.
Challenge 3: Poor Delivery Performance
Solution: In-Transit Delivery % tracking.
Challenge 4: Low Customer Ratings
Solution: Client and industry rating analysis.
Thus, this dashboard directly addresses real operational issues.
Conclusion
The Third-Party Logistics (3PL) Dashboard in Excel provides a powerful, structured, and interactive solution for logistics performance tracking. Instead of managing multiple spreadsheets, you gain centralized insights into freight costs, fuel surcharges, customer ratings, regional performance, and revenue trends.
Moreover, the dashboard simplifies complex logistics data into clear visuals. As a result, managers improve operational efficiency, control costs, and increase profitability.
If you want stronger supply chain control and smarter logistics decisions, this dashboard delivers exactly what you need.
Frequently Asked Questions (FAQs)
Click to Purchases Third-Party Logistics (3PL) Dashboard in Excel
1. What is a 3PL Dashboard in Excel?
A 3PL Dashboard in Excel is an interactive reporting tool that tracks logistics performance such as freight cost, revenue, and delivery percentage.
2. Can I customize the 3PL Dashboard?
Yes, you can customize KPIs, charts, and filters according to your business needs.
3. Does this dashboard require advanced Excel skills?
No. Basic Excel knowledge allows you to use and update the dashboard easily.
4. How often should I update the data?
You should update data weekly or monthly for accurate insights.
5. Can small logistics companies use this dashboard?
Yes. Small and medium 3PL companies can use this dashboard effectively.
6. What makes this dashboard better than manual reports?
This dashboard provides visual insights, automatic calculations, and interactive filtering. Therefore, it saves time and reduces errors.
Visit our YouTube channel to learn step-by-step video tutorials