Managing third-party logistics operations without structured analytics creates confusion, delays, and rising costs. Many logistics managers still depend on scattered spreadsheets. As a result, they struggle to track shipments, control transportation costs, monitor warehouse performance, and improve customer service levels.
However, modern logistics demands real-time visibility. Therefore, businesses need a centralized, interactive, and intelligent reporting solution. The Third-Party Logistics (3PL) Dashboard in Power BI solves this challenge completely. It converts raw logistics data into clear, visual, and actionable insights.
Click to Purchases Third-Party Logistics (3PL) Dashboard in Power BI
In this detailed guide, you will learn:
-
What a 3PL Dashboard in Power BI is
-
Why logistics companies need it
-
Detailed explanation of all 5 dashboard pages
-
Key KPIs tracked in the dashboard
-
Advantages of the 3PL Dashboard
-
Best practices for implementation
-
Frequently Asked Questions
Let’s explore everything step by step.
What Is a Third-Party Logistics (3PL) Dashboard in Power BI?
A Third-Party Logistics (3PL) Dashboard in Power BI is an interactive analytics solution built inside Microsoft Power BI. It helps logistics providers monitor transportation, warehousing, subscription-based logistics services, revenue, and operational performance.
Instead of manually reviewing reports, managers can:
-
Track total subscriptions by platform
-
Monitor active subscription percentage
-
Analyze revenue by region
-
Compare performance by device type
-
Review monthly trends
-
Identify growth opportunities
As a result, decision-makers gain full control over logistics performance.
Why Do 3PL Companies Need a Power BI Dashboard?
Today’s logistics environment moves fast. Customers expect real-time updates. Meanwhile, companies aim to reduce costs and improve margins. Therefore, without data-driven insights, companies fall behind.
Here’s why a 3PL dashboard becomes essential:
-
It centralizes all logistics data in one place
-
It improves decision-making speed
-
It reduces reporting errors
-
It increases transparency
-
It helps identify revenue gaps
-
It improves customer satisfaction
Moreover, Power BI allows interactive filtering through slicers. Consequently, managers analyze performance by region, platform, device, or month instantly.
What Are the Key Features of the Third-Party Logistics (3PL) Dashboard in Power BI?
This dashboard includes 5 powerful analytical pages, each designed to provide deep operational insights.
Let’s explore each page in detail.
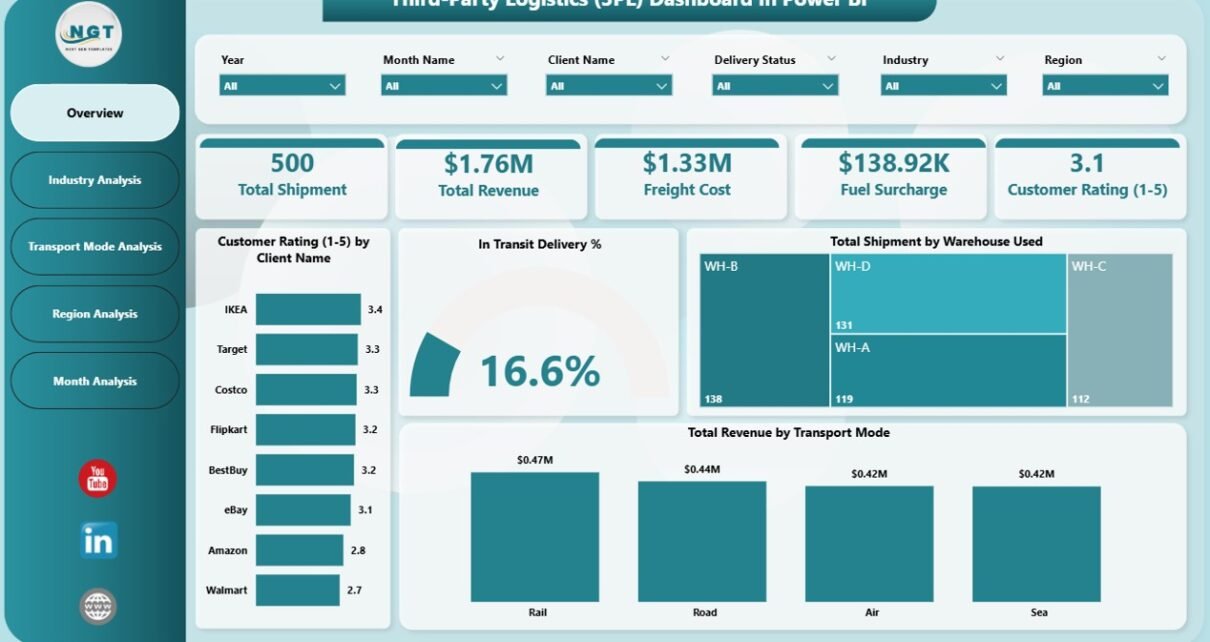
1️⃣ Overview Page – What Does It Show?

The Overview Page acts as the main control center of the dashboard.
Key KPI Cards
On this page, you will find 5 important KPI cards:
-
Total Subscription by Platform Name
-
Active Subscription %
-
Total Subscription by Subscription Type
-
Monthly Fee by Region
-
Overall Revenue Summary
These KPI cards provide an instant snapshot of business performance. Therefore, managers understand the overall health of operations in seconds.
Interactive Slicers
The overview page includes slicers that allow filtering by:
-
Platform Name
-
Subscription Type
-
Region
-
Month
Because of these slicers, users can instantly drill down into specific segments.
2️⃣ Platform Name Analysis – Which Platform Performs Best?
The Platform Name Analysis Page focuses on platform-level performance.
Charts Included
This page includes 3 powerful charts:
-
Total Revenue by Platform Name
-
Total Subscription by Platform Name
-
Monthly Fee by Platform Name
With these visuals, managers can:
-
Identify top-performing platforms
-
Compare revenue contribution
-
Detect underperforming platforms
-
Adjust pricing strategies
For example, if one platform generates high subscriptions but low revenue, managers can revise its pricing model.
3️⃣ Device Type Analysis – How Do Devices Impact Revenue?
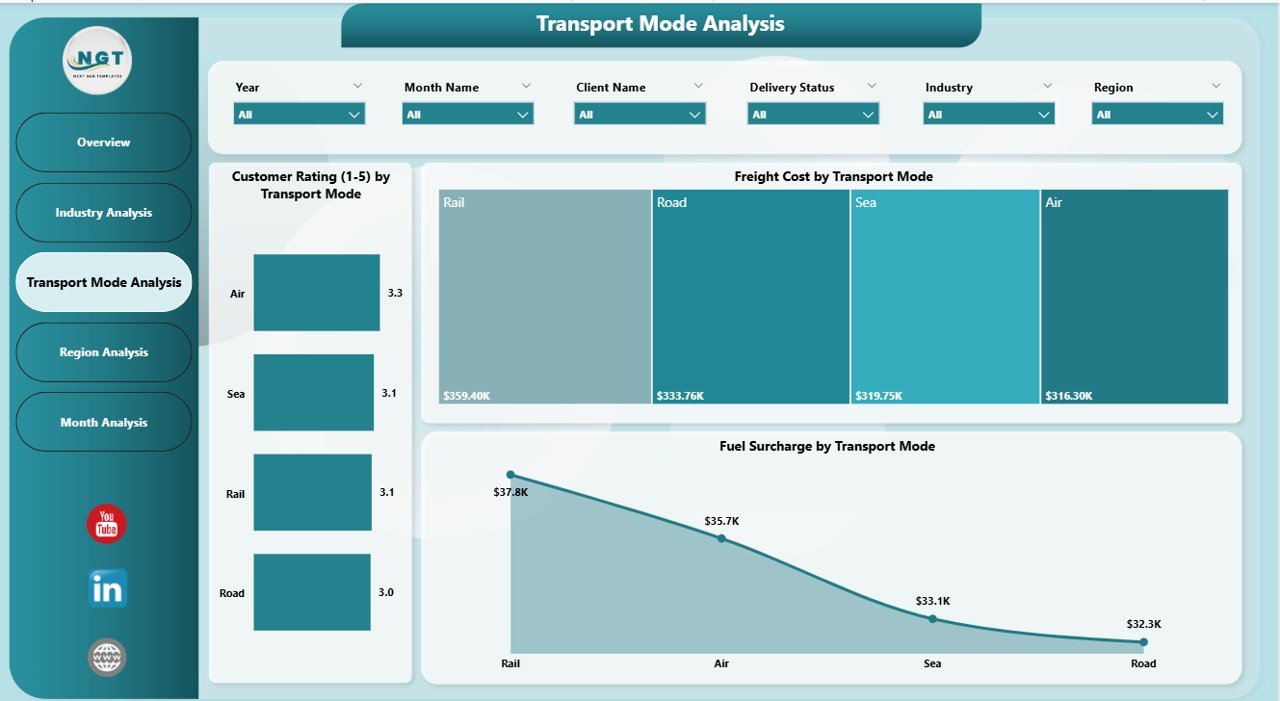
The Device Type Analysis Page provides insights into performance across different devices.
Charts on This Page
-
Total Revenue by Device Type
-
Monthly Fee by Device Type
-
Total Subscription by Device Type
This analysis helps companies understand:
-
Which device generates higher revenue
-
Customer behavior by device
-
Device-based subscription trends
As a result, companies can optimize platform compatibility and marketing strategies.
Click to Purchases Third-Party Logistics (3PL) Dashboard in Power BI
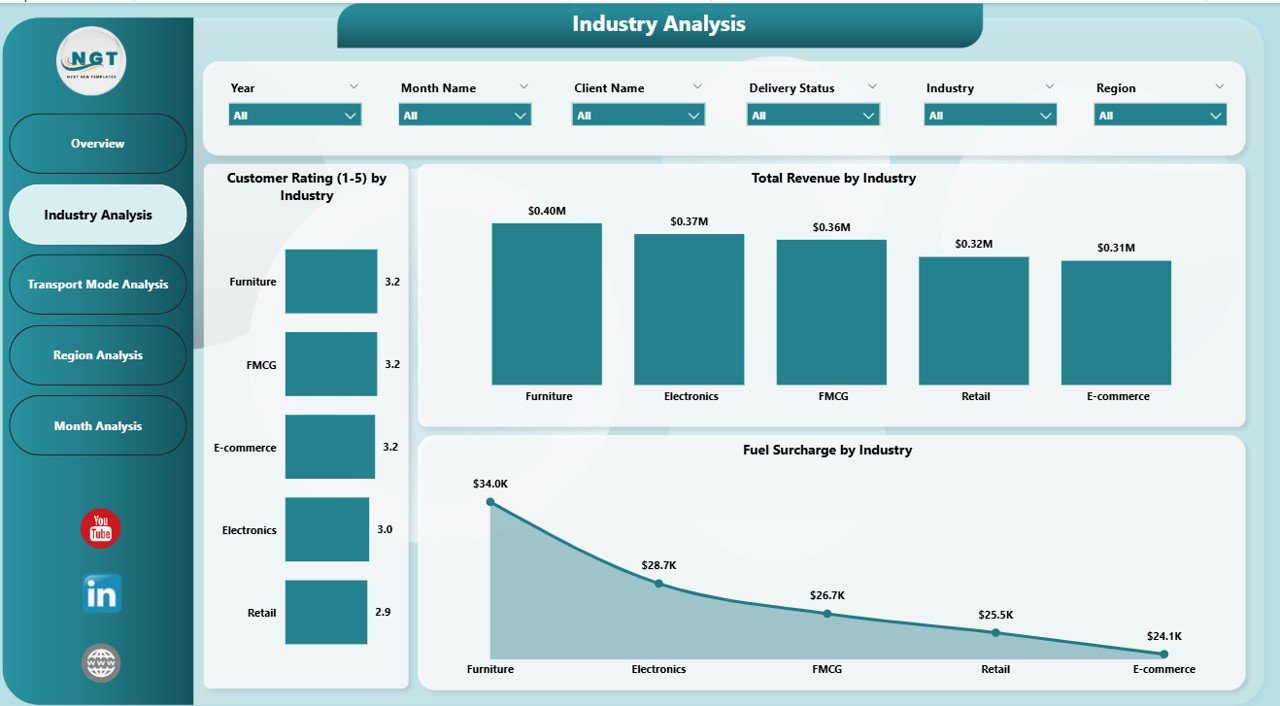
4️⃣ Region Analysis – Which Region Drives Growth?
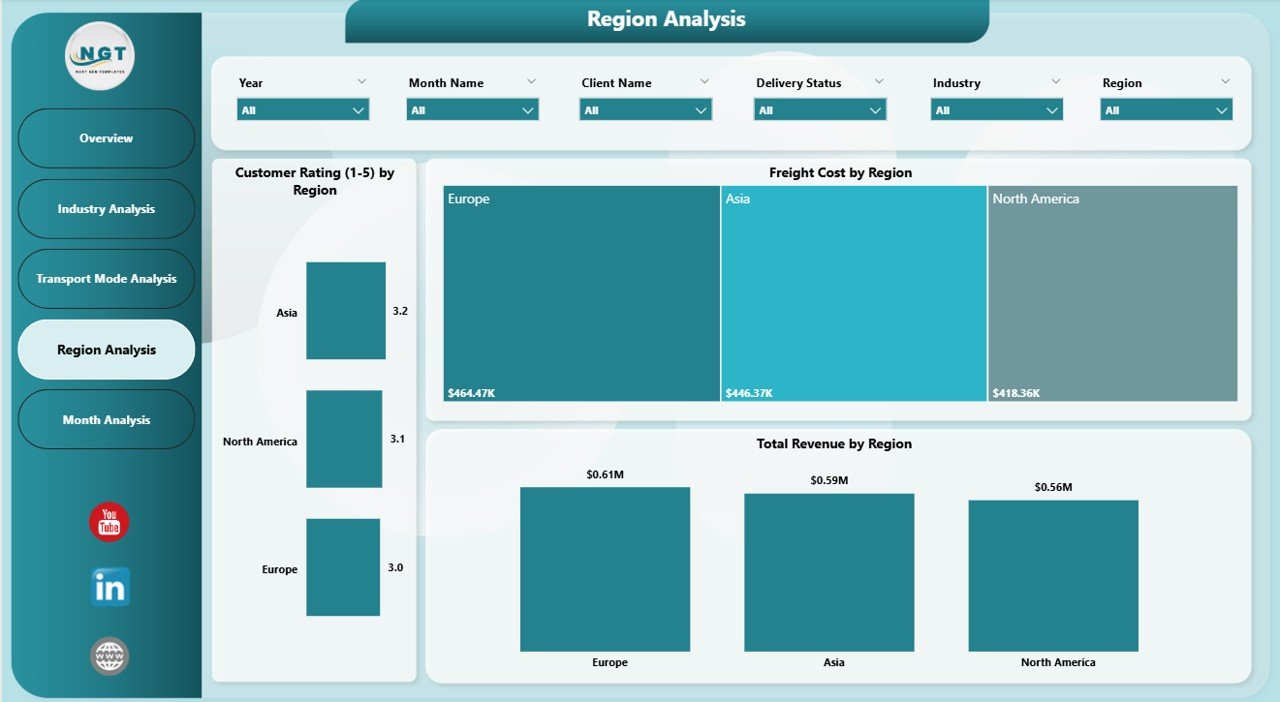
The Region Analysis Page provides geographical performance insights.
Included Charts
-
Total Revenue by Region
-
Monthly Fee by Region
-
Total Subscription by Region
With these visuals, managers can:
-
Identify high-growth regions
-
Detect low-performing markets
-
Allocate resources strategically
-
Optimize regional pricing
For instance, if one region shows high subscription growth but low revenue, the team can review pricing or service quality.
5️⃣ Month Analysis – How Does Revenue Change Over Time?
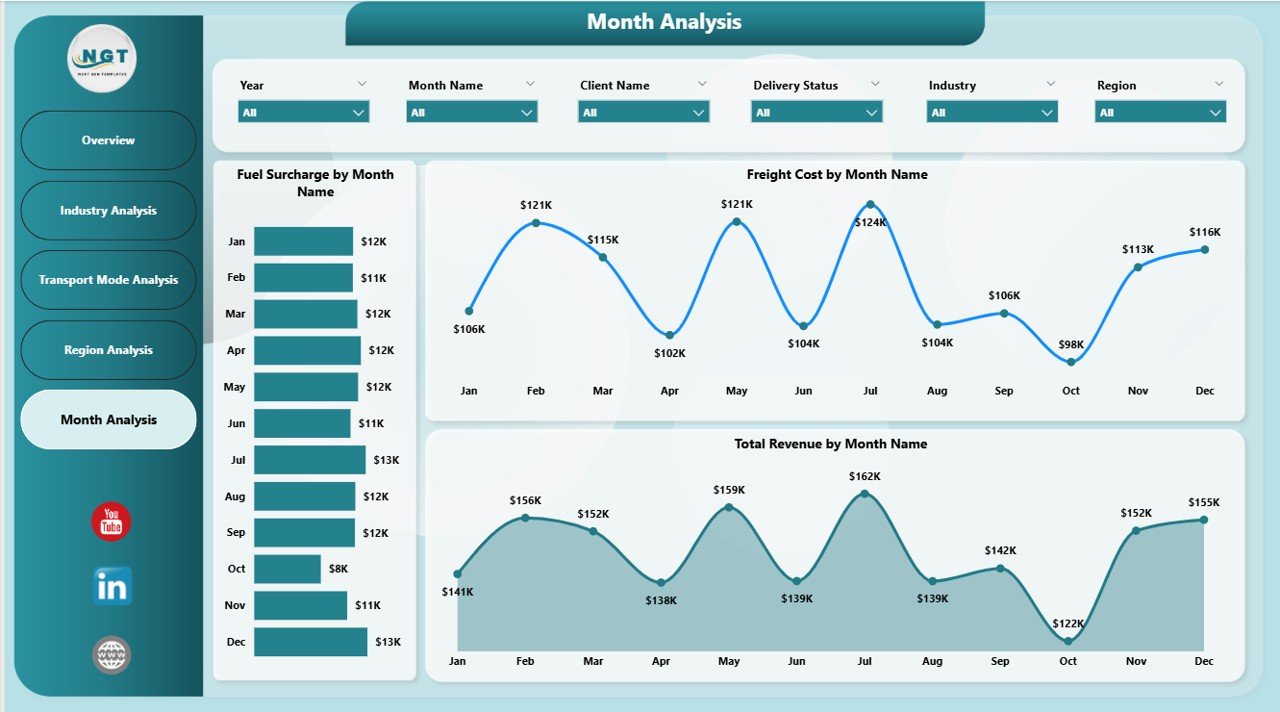
The Month Analysis Page helps track trends over time.
Charts on This Page
-
Total Revenue by Month
-
Monthly Fee by Month
-
Total Subscription by Month
This page allows managers to:
-
Identify seasonal patterns
-
Track revenue growth
-
Forecast future performance
-
Plan marketing campaigns
Therefore, businesses can make proactive decisions instead of reactive ones.
What Key KPIs Does the 3PL Dashboard Track?
A powerful dashboard always tracks meaningful KPIs. This 3PL Dashboard monitors:
-
Total Subscriptions
-
Active Subscription Percentage
-
Monthly Revenue
-
Subscription Growth Rate
-
Platform Performance
-
Device Contribution
-
Regional Revenue
-
Monthly Trends
Because these KPIs align with logistics performance goals, they support strategic planning.
How Does the 3PL Dashboard Improve Business Performance?
Click to Purchases Third-Party Logistics (3PL) Dashboard in Power BI
A well-designed dashboard transforms operations.
First, it reduces manual reporting work.
Second, it improves accuracy.
Third, it speeds up decision-making.
Finally, it increases profitability.
Moreover, Power BI provides real-time refresh capability. Therefore, managers always work with updated data.
Advantages of Third-Party Logistics (3PL) Dashboard in Power BI
Below are the major advantages of implementing this dashboard:
✅ Centralized Data Management
You can monitor all logistics performance metrics in one place. As a result, you avoid confusion caused by multiple spreadsheets.
✅ Real-Time Insights
You get instant performance updates. Therefore, you make faster decisions.
✅ Improved Revenue Tracking
The dashboard clearly shows revenue by platform, device, region, and month. Consequently, you identify profitable segments easily.
✅ Better Strategic Planning
Because you can see monthly trends, you can plan campaigns and expansions effectively.
✅ Easy Performance Comparison
You can compare platform performance side by side. Hence, you detect growth opportunities quickly.
✅ Interactive User Experience
Slicers allow easy filtering. Therefore, anyone can analyze data without technical skills.
✅ Scalable and Flexible
You can connect Power BI with Excel, ERP systems, or cloud databases. As a result, the dashboard grows with your business.
Best Practices for the Third-Party Logistics (3PL) Dashboard in Power BI
To maximize benefits, follow these best practices:
1️⃣ Keep Data Clean and Structured
Ensure your raw data contains consistent naming conventions. Clean data improves dashboard accuracy.
2️⃣ Update Data Regularly
Schedule automatic refresh in Power BI. Therefore, stakeholders always see updated information.
3️⃣ Focus on Meaningful KPIs
Avoid adding too many metrics. Instead, track KPIs that directly impact revenue and operations.
4️⃣ Use Clear Naming for Visuals
Label charts clearly. As a result, users understand insights instantly.
5️⃣ Enable Role-Based Access
Restrict data access based on roles. This approach improves data security.
6️⃣ Review Performance Monthly
Conduct monthly review meetings using the dashboard. Therefore, you identify trends early.
7️⃣ Train Your Team
Provide basic Power BI training. Consequently, employees use the dashboard effectively.
How to Implement the 3PL Dashboard in Power BI?
Implementing the dashboard involves simple steps:
-
Collect logistics and subscription data
-
Clean and format the dataset
-
Import data into Power BI
-
Create relationships between tables
-
Build DAX measures for KPIs
-
Design visual pages
-
Add slicers for filtering
-
Publish to Power BI Service
Once implemented, share it with stakeholders for collaboration.
Who Can Benefit from the 3PL Dashboard?
This dashboard benefits:
-
Third-party logistics providers
-
Supply chain managers
-
Operations managers
-
Finance teams
-
Business analysts
-
Subscription-based logistics platforms
Therefore, any organization involved in logistics management can use this solution.
Conclusion: Why Should You Use a Third-Party Logistics (3PL) Dashboard in Power BI?
In today’s competitive logistics industry, data drives success. Without structured reporting, companies lose visibility and profits.
However, the Third-Party Logistics (3PL) Dashboard in Power BI transforms raw data into actionable insights. It centralizes information, improves accuracy, and supports faster decision-making. Moreover, it helps companies identify growth opportunities and improve operational efficiency.
Therefore, if you want to improve logistics performance, increase revenue, and enhance strategic planning, this dashboard offers the perfect solution.
Now is the time to move from manual reporting to intelligent analytics.
Frequently Asked Questions (FAQs)
Click to Purchases Third-Party Logistics (3PL) Dashboard in Power BI
1. What is a 3PL Dashboard in Power BI?
A 3PL Dashboard in Power BI is an interactive reporting tool that tracks logistics performance, revenue, subscriptions, and regional trends.
2. Why should logistics companies use Power BI?
Power BI provides real-time analytics, interactive visuals, and automated reporting. Therefore, companies make faster and smarter decisions.
3. Can this dashboard integrate with Excel?
Yes. Power BI connects easily with Excel files, databases, ERP systems, and cloud platforms.
4. How often should I update the dashboard?
You should refresh data daily or weekly depending on business needs.
5. Does this dashboard require technical expertise?
Basic Power BI knowledge helps. However, the interactive design allows non-technical users to analyze performance easily.
6. Can I customize this 3PL Dashboard?
Yes. You can add new KPIs, modify visuals, and connect additional data sources.
Visit our YouTube channel to learn step-by-step video tutorials