In today’s fast-paced business environment, logistics is more than just a function—it’s the backbone of any successful transportation system. Effective transportation and logistics management requires real-time insights into multiple variables such as shipment status, routes, carriers, and costs. This is where Power BI comes in. With its powerful data visualization and reporting capabilities, Power BI can help companies in the transportation and logistics industry stay ahead of the curve. A Transportation and Logistics Dashboard in Power BI provides a centralized platform to track and analyze key metrics, making it easier to make data-driven decisions and optimize performance.
Click to Purchases Transportation & Logistics Dashboard in Power BI
Key Features of the Transportation & Logistics Dashboard in Power BI
A Transportation & Logistics Dashboard in Power BI is more than just a visualization tool; it’s a comprehensive solution that covers all major aspects of transportation operations. From shipment tracking to cost analysis, this dashboard simplifies complex data into easy-to-understand visuals. Let’s dive into the five primary pages that make up this dynamic dashboard.
Overview Page
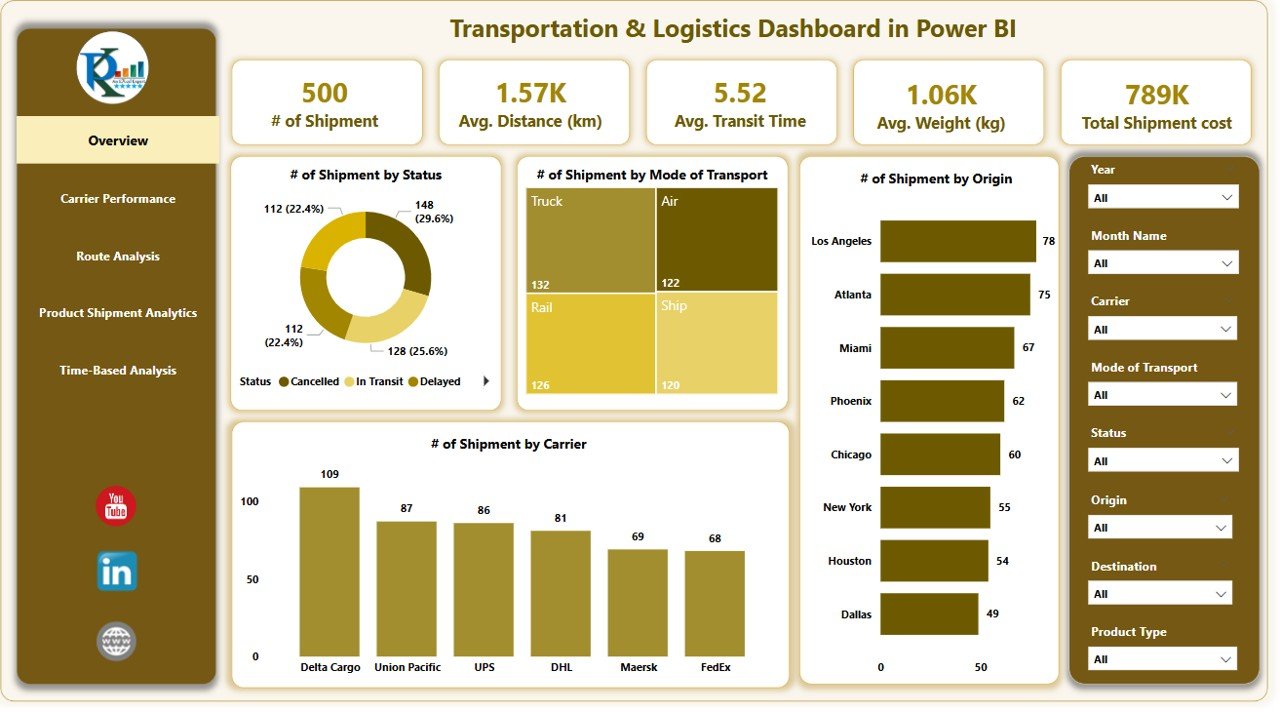
The Overview Page serves as the dashboard’s main page, providing a snapshot of key metrics across the logistics operations. This page includes:
8 Silencers to filter data by specific parameters.
5 Cards for quick insights into essential metrics.
4 Charts showcasing:
- Number of Shipments by Status – Gain insights into the current status of all shipments (e.g., in transit, delivered, delayed).
- Number of Shipments by Mode of Transport – Analyze which transportation modes (air, sea, road, rail) are being used most.
- Number of Shipments by Origin – View shipments from various origins to identify top shipping locations.
- Number of Shipments by Carrier – Understand the performance of each carrier and their contribution to the overall shipment count.
These visuals help businesses monitor shipment statuses and optimize their transportation processes, ensuring smooth operations.
Carrier Performance Page
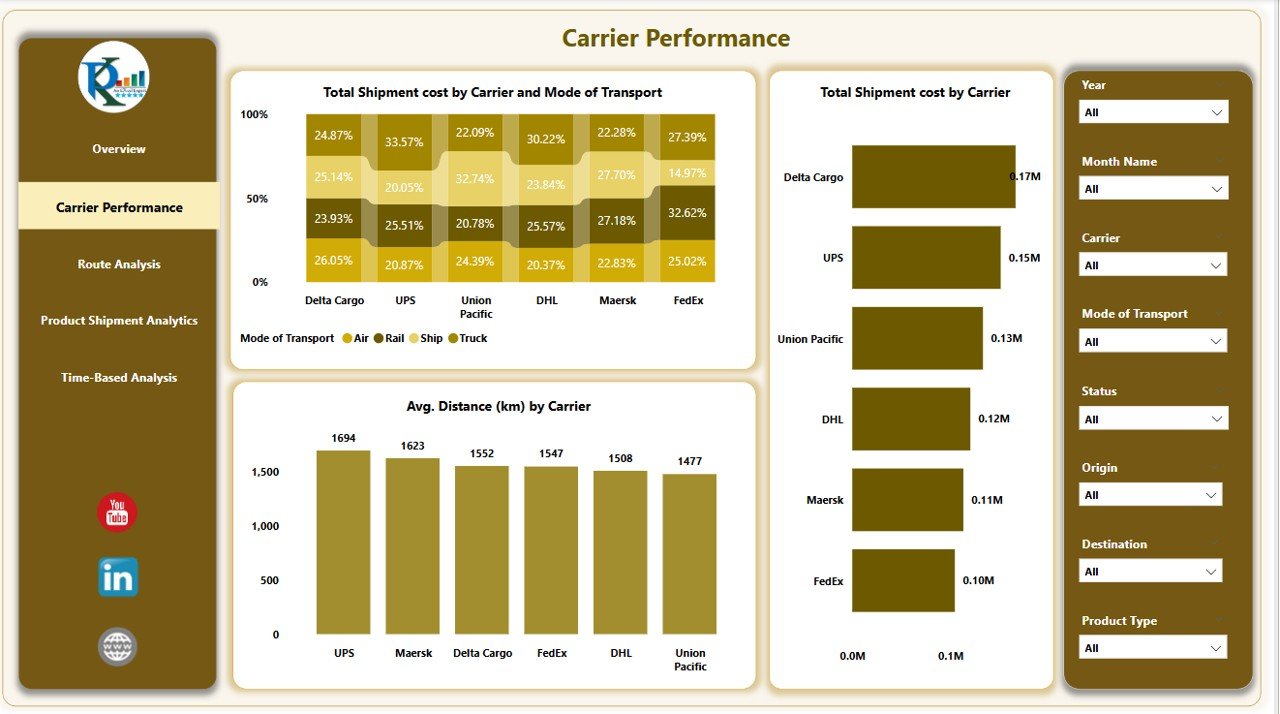
The Carrier Performance Page focuses on evaluating the performance of carriers. It helps logistics managers assess the efficiency and cost-effectiveness of their chosen carriers. The page features:
8 Silencers for further data filtering.
3 Charts to measure key performance indicators:
- Total Shipment Cost by Carrier and Mode of Transport – This chart compares the costs associated with different carriers and transportation modes.
- Total Shipment Cost by Carrier – A breakdown of shipment costs per carrier to evaluate performance.
- Average Distance (km) by Carrier – Analyzes the average distance covered by each carrier for better route planning and cost estimation.
This page helps businesses identify cost-effective carriers and improve their transportation strategies.
Click to Purchases Transportation & Logistics Dashboard in Power BI
Route Analysis Page
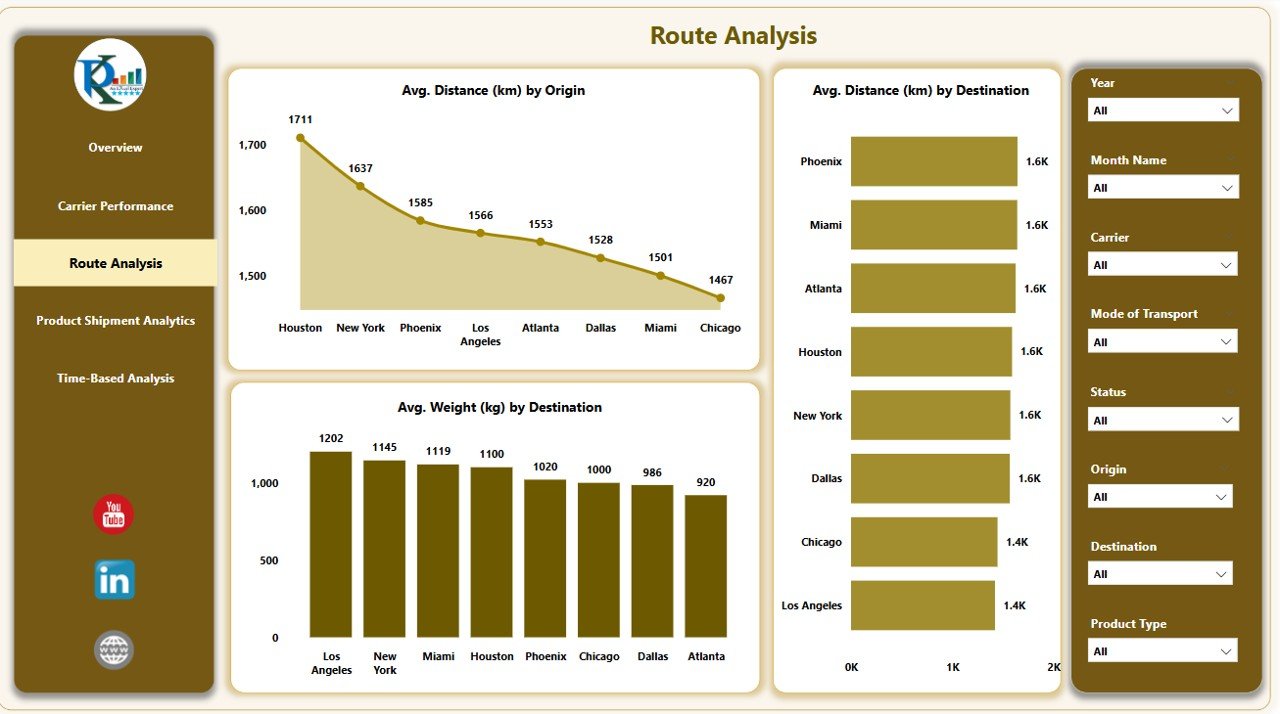
Optimizing routes is a crucial aspect of reducing costs and improving delivery times. The Route Analysis Page in the Transportation & Logistics Dashboard provides in-depth insights into route performance with the following features:
8 Silencers for customizing the data.
3 Charts to visualize route-based metrics:
- Average Distance (km) by Origin – Understand the average distance shipments travel from specific origins.
- Average Distance (km) by Destination – Gain insights into how far shipments are traveling to various destinations.
- Average Distance (km) by Destination – A detailed look at distances covered by shipments going to specific destinations.
These metrics help businesses streamline their routing decisions, ensuring that shipments are both cost-effective and timely.
Click to Purchases Transportation & Logistics Dashboard in Power BI
Product Shipment Analytics Page
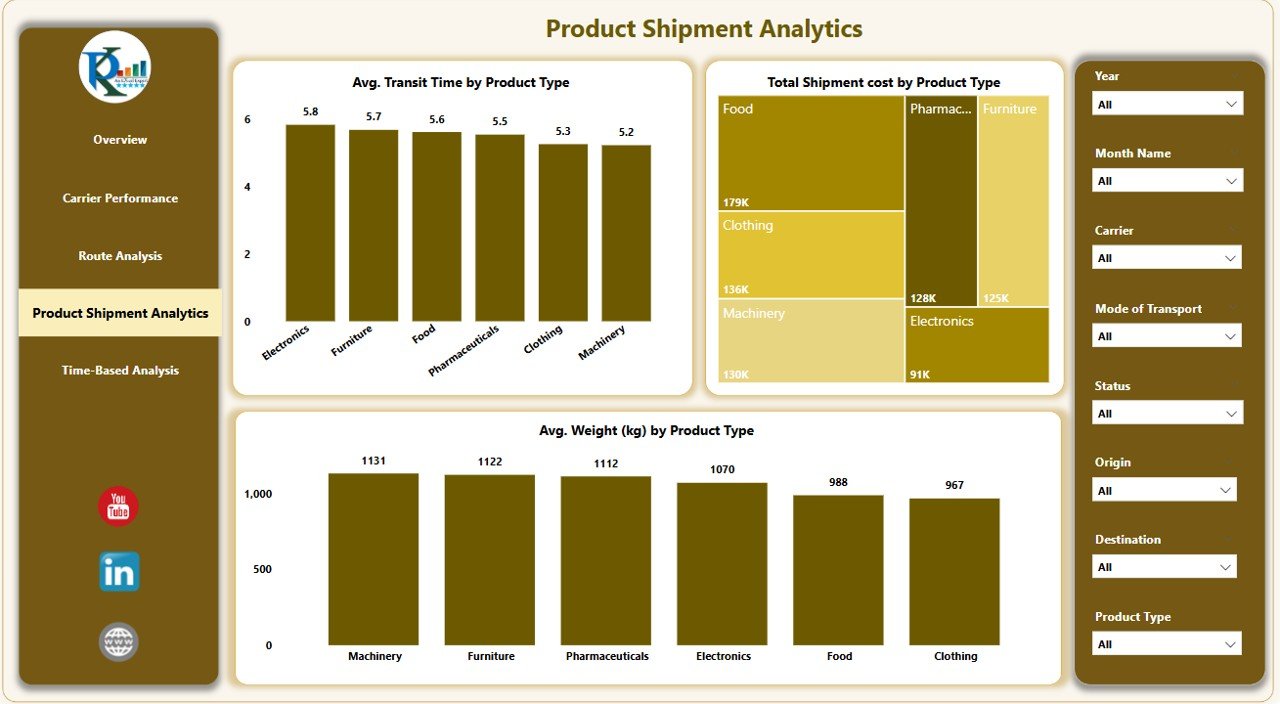
The Product Shipment Analytics Page allows businesses to track shipments based on product categories. This page is designed to help logistics teams understand how different products are impacting transportation costs and transit times. The page includes:
8 Silencers to filter product-related data.
3 Charts for better analysis:
- Average Transit Time by Product Type – This chart shows the average time taken to ship different types of products.
- Total Shipment Cost by Product Type – Understand the shipment costs associated with different product categories.
- Average Weight (kg) by Product Type – Get insights into the average weight of products being shipped, which helps in optimizing transportation modes.
This page is essential for businesses that need to evaluate the logistics of different product types and optimize their shipment strategies accordingly.
Time-Based Analysis Page
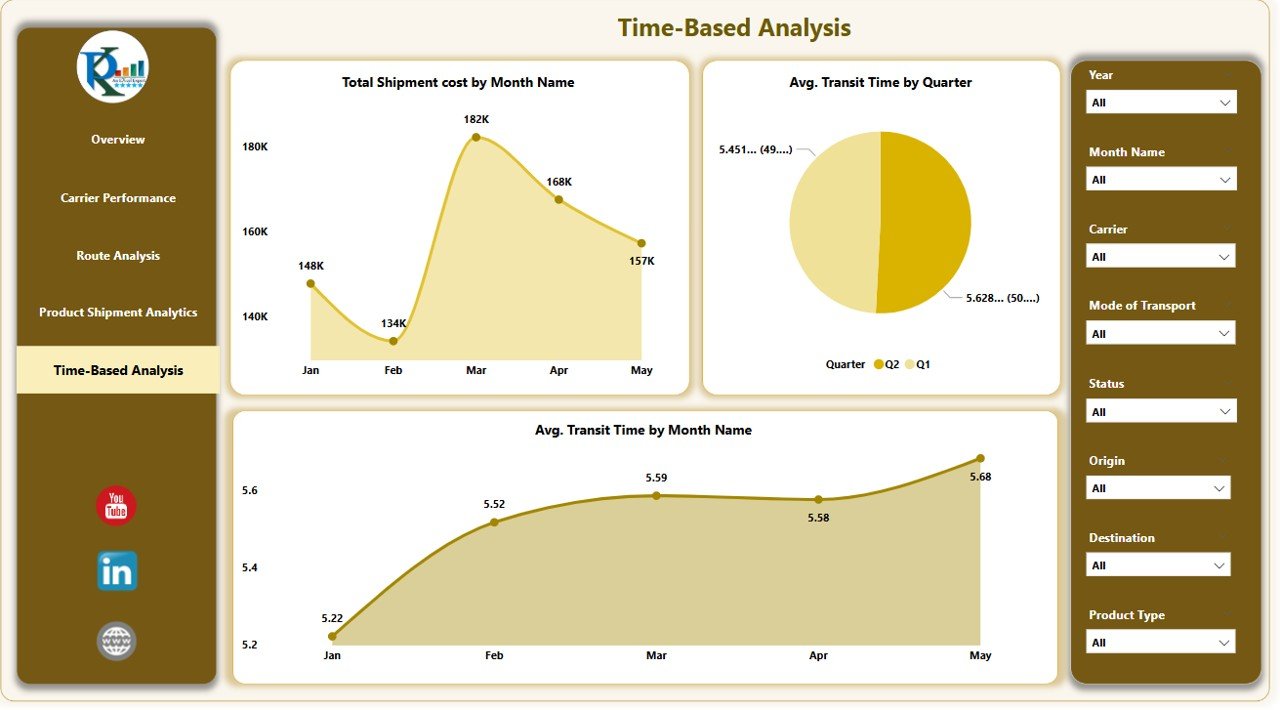
The Time-Based Analysis Page focuses on analyzing shipment data over different time periods. This page is essential for tracking trends and understanding how logistics performance changes over time. Features include:
8 Silencers to customize the time period.
2 Charts for time-based analysis:
- Total Shipment Cost by Month – Track shipment costs on a monthly basis to identify trends and seasonal fluctuations.
- Average Transit Time by Quarter – Analyze transit times across different quarters to improve efficiency and reduce delays.
- Average Transit Time by Month – A detailed look at transit times on a monthly basis, helping businesses pinpoint areas for improvement.
This page enables businesses to track the evolution of logistics costs and transit times, giving them a better understanding of how their operations are evolving over time.
Advantages of the Transportation & Logistics Dashboard in Power BI
Implementing a Transportation & Logistics Dashboard in Power BI brings several benefits to organizations, including:
-
Real-time Data Insights – The dashboard provides live data, allowing businesses to track shipments and costs in real time.
-
Enhanced Decision Making – With easy-to-understand charts and visuals, decision-makers can quickly analyze key metrics and make informed choices.
-
Cost Optimization – By analyzing shipment costs, carrier performance, and product categories, businesses can identify areas where cost savings can be achieved.
-
Improved Route Planning – Route analysis helps optimize travel distances and delivery times, which can lead to lower transportation costs and faster deliveries.
-
Productivity and Efficiency Gains – By streamlining logistics operations, companies can reduce delays, improve transit times, and enhance overall efficiency.
-
Scalability – Power BI dashboards can scale as the business grows, allowing companies to handle larger volumes of shipments with ease.
Best Practices for Using the Transportation Dashboard
To maximize the benefits of the Transportation Dashboard in Power BI, follow these best practices:
-
Regularly Update Data – Ensure that the data feeding into the dashboard is regularly updated to reflect the most accurate and up-to-date information.
-
Set Up Alerts – Configure alerts for key metrics such as shipment delays, cost overruns, or underperformance by carriers to act swiftly.
-
Customize Dashboards Based on Roles – Tailor the dashboard views for different roles within the organization. For example, operations managers may focus on route optimization, while finance teams might focus on cost analysis.
-
Use Predictive Analytics – Leverage Power BI’s predictive capabilities to forecast shipment delays, costs, and other key metrics.
-
Collaborate with Team Members – Share insights and collaborate with team members in real time using Power BI’s sharing and collaboration features.
Frequently Asked Questions (FAQs)
1. What is the Transportation in Power BI?
The Transportation Dashboard in Power BI is a ready-to-use tool designed to help businesses track, analyze, and optimize their transportation operations. It consolidates key metrics such as shipment status, carrier performance, route analysis, and product shipment analytics into a single, easy-to-use dashboard.
2. How can the Transportation improve my business?
The dashboard provides real-time insights into key metrics, allowing businesses to make data-driven decisions that optimize costs, improve transit times, and streamline logistics operations. It helps businesses identify inefficiencies and make informed decisions to improve their overall performance.
3. Can I customize the dashboard?
Yes, Power BI allows for extensive customization. You can tailor the dashboard’s visuals, data, and filters to meet your business’s specific needs. It also enables you to set up custom alerts for key metrics, so you can act promptly when needed.
4. How do I integrate Power BI with my logistics data?
Integrating Power BI with your logistics data is straightforward. You can connect Power BI to a variety of data sources, such as Excel, SQL Server, and cloud-based systems. Once connected, Power BI will automatically pull in your data for analysis and visualization.
Conclusion
A Transportation in Power BI is an essential tool for businesses looking to optimize their logistics operations. By offering a comprehensive view of key metrics such as shipment status, carrier performance, and route analysis, this dashboard helps organizations make informed decisions that improve efficiency, reduce costs, and streamline their operations. By following best practices and leveraging the power of Power BI, businesses can gain a competitive edge and stay ahead in the dynamic world of transportation and logistics.
Visit our YouTube channel to learn step-by-step video tutorials