Treasury operations play a critical role in every organization. Companies manage cash, liquidity, debt, investments, and financial risk on a daily basis. However, many treasury teams still rely on static Excel files, manual reconciliations, and delayed reports. As a result, decision-making becomes slow and reactive.
That is exactly why a Treasury Operations Dashboard in Power BI has become essential for modern finance teams.
This in-depth, SEO-friendly guide explains what a Treasury Operations Dashboard in Power BI is, why it matters, how it works, and how each dashboard page supports better treasury decisions. Moreover, you will explore its advantages, best practices, use cases, and frequently asked questions. By the end of this article, you will clearly understand how this dashboard transforms raw treasury data into real-time financial intelligence.
Click to Purchases Treasury Operations Dashboard in Power BI
What Is a Treasury Operations Dashboard in Power BI?
A Treasury Operations Dashboard in Power BI is an interactive analytics solution that helps treasury teams monitor cash flow, liquidity, interest income, interest expenses, and balances from a centralized platform.
Instead of reviewing multiple spreadsheets for entities, regions, counterparties, and months, this dashboard consolidates all treasury-related data into a single Power BI report. Consequently, treasury managers gain faster visibility and better control.
Moreover, Power BI enables real-time data refresh, dynamic slicers, and interactive charts. As a result, users can analyze treasury performance instantly without waiting for manual reports.
Why Do Treasury Teams Need a Treasury Operations Dashboard?
Treasury teams face constant pressure. They must ensure liquidity, optimize interest income, manage counterparty risk, and control borrowing costs. However, manual processes slow everything down.
Therefore, treasury teams need a smarter solution.
Common Challenges Without a Dashboard
-
Data scattered across multiple systems
-
Manual reconciliation errors
-
Delayed visibility into cash positions
-
Limited insights into interest income and expenses
-
Difficulty comparing entities, regions, and counterparties
A Treasury Operations Dashboard in Power BI solves these issues by providing a single source of truth.
How Does a Treasury Operations Dashboard in Power BI Work?
A Treasury Operations Dashboard pulls data from treasury systems, ERP platforms, or Excel files. Then, Power BI transforms the data into structured models. After that, the dashboard presents insights through interactive visuals.
Users can apply slicers to filter by:
-
Entity
-
Region
-
Counterparty
-
Transaction type
-
Time period
As a result, treasury professionals can drill down into details and identify trends quickly.
Key Features of the Treasury Operations Dashboard in Power BI
This dashboard includes five powerful pages, each designed to address a specific treasury analysis requirement. Let us explore each page in detail.
1. Overview Page: How Does It Support Treasury Decisions?
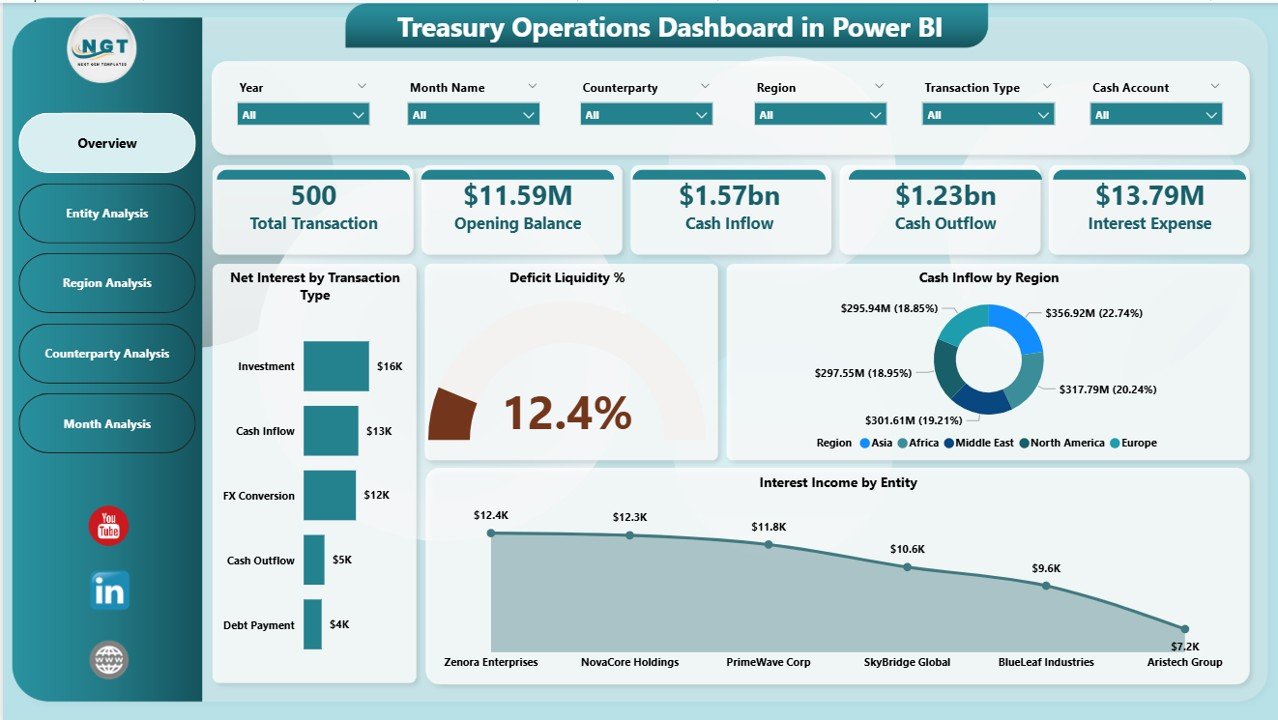
The Overview Page acts as the executive summary of the treasury dashboard. It provides a high-level snapshot of treasury performance at a glance.
Key Elements of the Overview Page
-
Interactive slicers for quick filtering
-
Four KPI cards for instant metrics
-
Four charts for trend and comparison analysis
Metrics and Visuals Included
-
Net Interest by Transaction Type
-
Deficit Liquidity Percentage
-
Cash Inflow by Region
-
Interest Income by Entity
Because everything appears on one screen, treasury leaders can immediately understand the organization’s financial position. Moreover, they can spot liquidity gaps before they become serious issues.
2. Entity Analysis Page: Why Is Entity-Level Visibility Important?
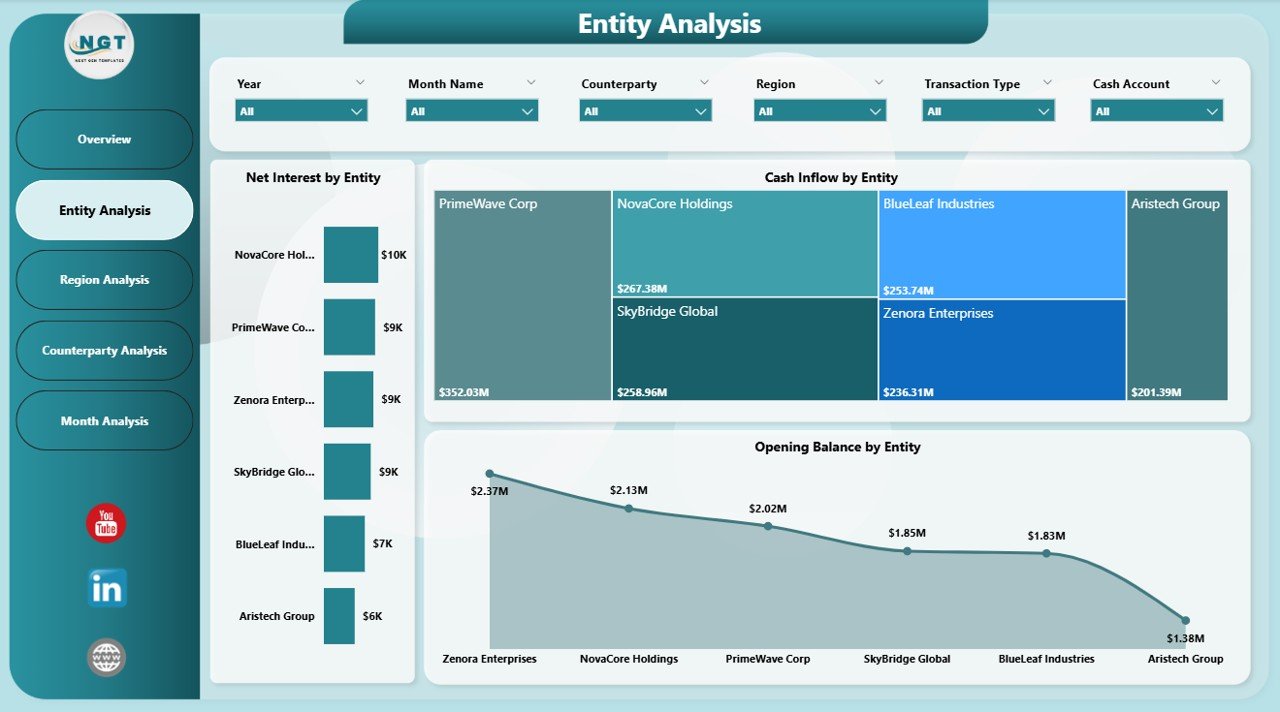
Large organizations operate across multiple legal entities. Therefore, entity-level treasury analysis becomes crucial.
The Entity Analysis Page focuses on performance by entity. It allows treasury teams to compare cash flow and interest metrics across business units.
Key Charts on the Entity Analysis Page
-
Net Interest by Entity
-
Cash Inflow by Entity
-
Opening Balance by Entity
As a result, treasury managers can identify which entities generate higher interest income and which ones consume liquidity. Consequently, they can reallocate funds more efficiently.
3. Region Analysis Page: How Does Regional Analysis Improve Treasury Control?
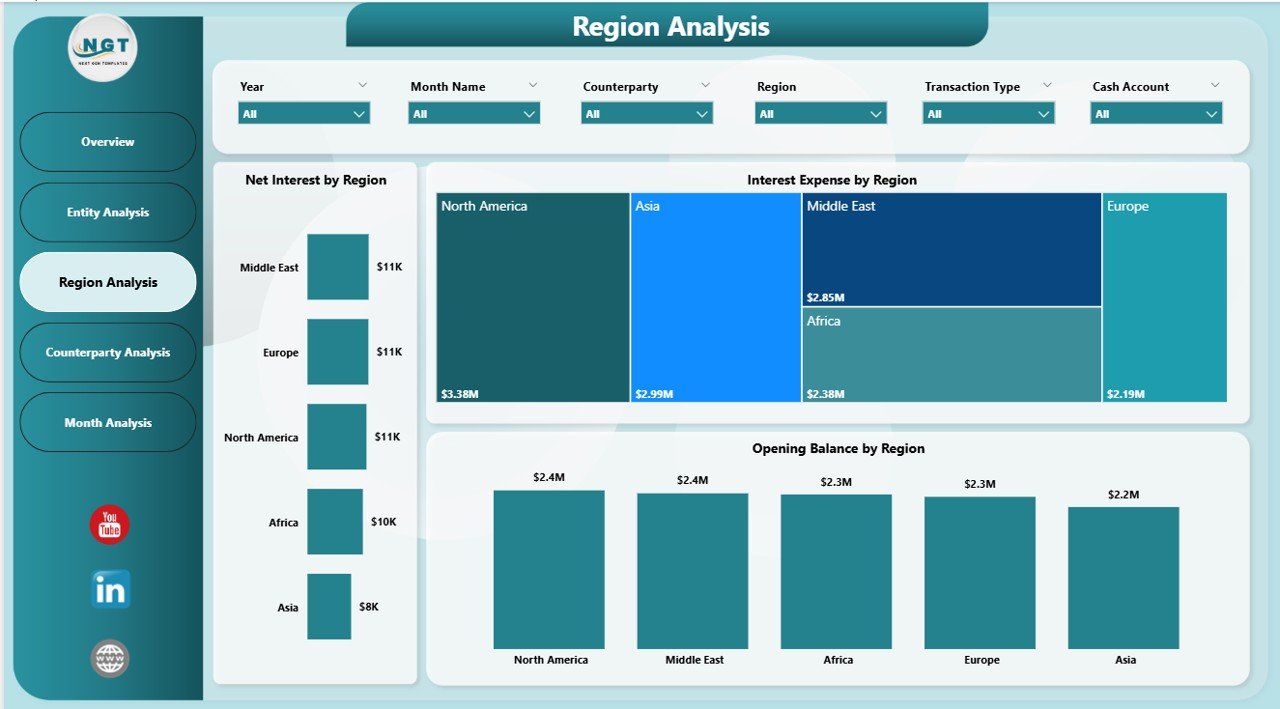
Geographic diversification adds complexity to treasury operations. Different regions face different interest rates, currencies, and regulations.
The Region Analysis Page helps treasury teams monitor regional performance clearly.
Key Charts on the Region Analysis Page
-
Net Interest by Region
-
Interest Expenses by Region
-
Opening Balance by Region
Because this page breaks down data by region, teams can easily compare financial performance across markets. Furthermore, they can manage regional liquidity more proactively.
Click to Purchases Treasury Operations Dashboard in Power BI
4. Counterparty Analysis Page: How Does It Reduce Financial Risk?
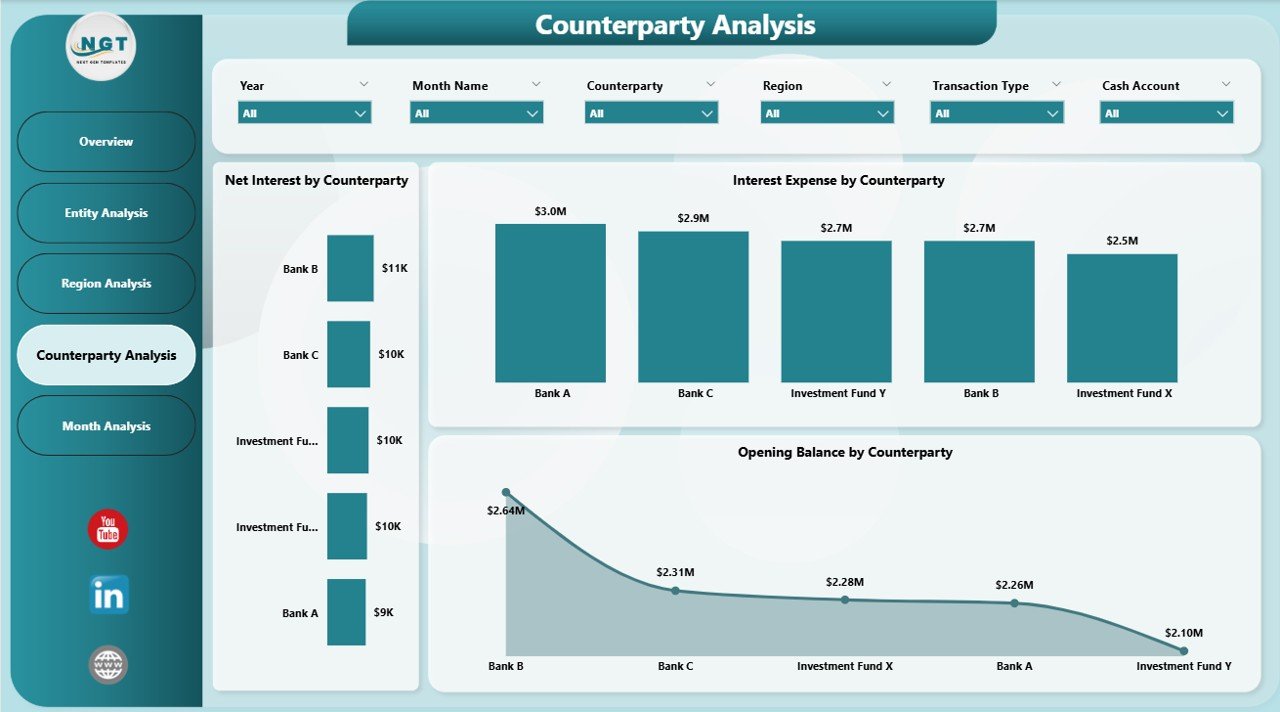
Counterparty risk remains a major concern in treasury operations. Organizations must monitor exposure to banks, lenders, and financial institutions carefully.
The Counterparty Analysis Page focuses on this critical area.
Key Charts on the Counterparty Analysis Page
-
Net Interest by Counterparty
-
Interest Expenses by Counterparty
-
Opening Balance by Counterparty
With this view, treasury teams can avoid overexposure to a single counterparty. Moreover, they can negotiate better terms based on actual performance data.
5. Monthly Trends Page: Why Are Trends Important in Treasury Management?
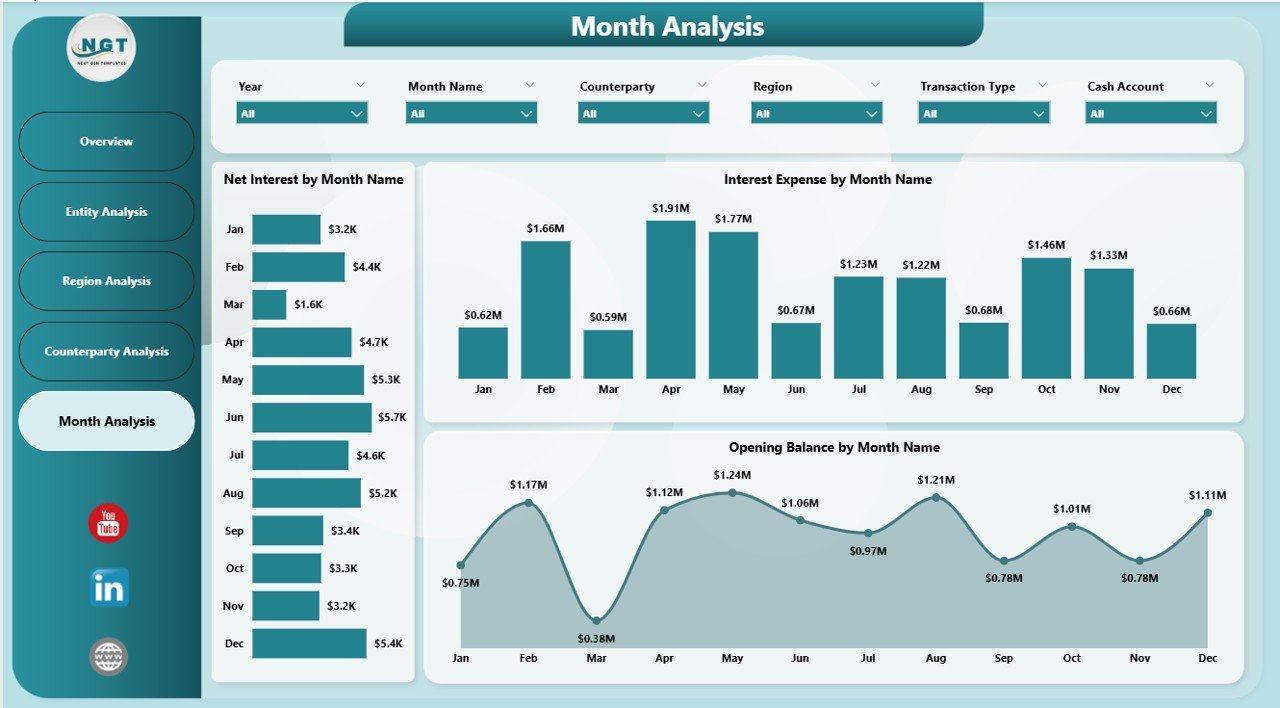
Treasury performance changes over time. Therefore, trend analysis becomes essential.
The Monthly Trends Page provides time-based insights into treasury metrics.
Key Charts on the Monthly Trends Page
-
Net Interest by Month
-
Interest Expenses by Month
-
Opening Balance by Month
Because this page highlights trends, treasury teams can forecast future cash needs and plan funding strategies effectively.
What KPIs Can You Track Using a Treasury Operations Dashboard?
A Treasury Operations Dashboard in Power BI supports a wide range of treasury KPIs, including:
-
Net Interest Income
-
Interest Expenses
-
Cash Inflow
-
Opening and Closing Balances
-
Liquidity Deficit Percentage
-
Regional Cash Distribution
-
Counterparty Exposure
Moreover, teams can customize KPIs based on business needs.
Advantages of a Treasury Operations Dashboard in Power BI
A Treasury Operations Dashboard delivers several tangible benefits. Let us explore them in detail.
1. Centralized Treasury Visibility
All treasury data stays in one place. As a result, teams avoid confusion and duplication.
2. Faster Decision-Making
Real-time insights enable quicker responses to liquidity issues and market changes.
3. Improved Cash Flow Management
Better visibility into inflows and balances helps optimize cash utilization.
4. Enhanced Risk Management
Counterparty and regional analysis reduces financial risk.
5. Executive-Ready Reporting
Interactive visuals make reporting easier for senior management.
Who Should Use a Treasury Operations Dashboard?
This dashboard suits a wide range of professionals, including:
-
Treasury Managers
-
CFOs and Finance Directors
-
Corporate Finance Teams
-
Risk Management Teams
-
Financial Controllers
Moreover, organizations of all sizes can benefit from it.
How Does Power BI Improve Treasury Analytics?
Power BI offers advanced analytics capabilities that go beyond traditional reporting.
Key Power BI Benefits for Treasury Teams
-
Interactive slicers and drill-downs
-
Real-time data refresh
-
Secure data access
-
Scalable reporting across departments
As a result, treasury analytics becomes faster, smarter, and more reliable.
Best Practices for the Treasury Operations Dashboard in Power BI
Click to Purchases Treasury Operations Dashboard in Power BI
To get maximum value, treasury teams should follow these best practices.
1. Standardize Data Sources
Ensure consistent data definitions across systems.
2. Use Clear KPI Definitions
Define every KPI clearly to avoid confusion.
3. Apply Role-Based Access
Restrict sensitive data based on user roles.
4. Review Dashboards Regularly
Update visuals and KPIs as treasury needs evolve.
5. Combine Forecasts with Actuals
Compare actual performance against forecasts for better planning.
Common Use Cases of Treasury Operations Dashboards
Organizations use treasury dashboards for various purposes.
Typical Use Cases
-
Daily liquidity monitoring
-
Interest income optimization
-
Counterparty exposure tracking
-
Regional cash allocation
-
Monthly treasury reporting
Because the dashboard adapts easily, teams can support both operational and strategic decisions.
How to Implement a Treasury Operations Dashboard Successfully?
A structured approach ensures success.
Step-by-Step Implementation Approach
-
Identify key treasury metrics
-
Collect and clean data
-
Build a data model in Power BI
-
Design user-friendly visuals
-
Test with real users
-
Roll out and train teams
This approach ensures accuracy and adoption.
Challenges in Treasury Dashboard Implementation and How to Overcome Them
Even the best dashboards face challenges.
Common Challenges
-
Poor data quality
-
Resistance to change
-
Overloaded visuals
Solutions
-
Automate data validation
-
Train users early
-
Keep dashboards simple and focused
As a result, adoption improves significantly.
Future of Treasury Operations Dashboards
Treasury dashboards continue to evolve.
Emerging Trends
-
Predictive analytics
-
AI-driven cash forecasting
-
Real-time API integrations
-
Advanced risk modeling
Therefore, treasury teams that adopt Power BI dashboards stay ahead of the curve.
Conclusion: Is a Treasury Operations Dashboard in Power BI Worth It?
Absolutely.
A Treasury Operations Dashboard in Power BI transforms how organizations manage cash, liquidity, and financial risk. It replaces manual processes with real-time insights. Moreover, it improves transparency, accuracy, and decision-making.
As treasury operations grow more complex, dashboards like this become a necessity rather than a luxury.
Frequently Asked Questions (FAQs)
What is a Treasury Operations Dashboard in Power BI?
It is an interactive reporting solution that tracks cash flow, liquidity, interest income, and balances using Power BI.
Who benefits most from this dashboard?
Treasury managers, CFOs, finance teams, and risk professionals benefit the most.
Can this dashboard handle multiple entities and regions?
Yes, it supports entity-level, regional, and counterparty analysis.
How often can data refresh in Power BI?
Power BI supports scheduled and real-time data refresh options.
Is Power BI suitable for large treasury datasets?
Yes, Power BI handles large datasets efficiently with proper modeling.
Can this dashboard reduce financial risk?
Yes, it improves visibility into counterparty exposure and liquidity risks.
Visit our YouTube channel to learn step-by-step video tutorials
Click to Purchases Treasury Operations Dashboard in Power BI