Trucking and Logistics Dashboard in Excel is a powerful, pivot-driven analytics workbook designed to help fleet managers, trucking company owners, logistics coordinators, and supply chain professionals monitor every critical aspect of their trucking operations. With 5 dedicated dashboard pages, dynamic KPI cards, built-in slicers, and automatic pivot chart refresh, this Excel template transforms raw trucking data into actionable visual insights that drive smarter decisions across routes, drivers, trucks, and finances.
Whether you run a regional freight operation or manage a nationwide logistics network, this dashboard gives you complete visibility into revenue, fuel costs, delivery performance, and profitability — without writing a single formula. Just paste your data, click Refresh All, and every chart updates instantly.
Key Features of the Trucking and Logistics Dashboard in Excel
- 5 Interactive Analysis Pages — Overview, Route Analysis, Driver Performance, Fleet Analysis, and Financial Trends provide comprehensive coverage of your entire trucking operation.
- High-Level KPI Summary Cards — The Overview page displays Total Revenue, Total Records, Total Delivered, Total Fuel Cost, and Total Profit for instant executive-level visibility.
- Dynamic Pivot-Powered Visualizations — Every chart in the dashboard is connected to pivot tables in the Support sheet. Update data and click Refresh All to auto-update all visuals.
- Built-in Slicers for Quick Filtering — Filter by cargo type, route, driver name, truck ID, customer type, month, and more across all dashboard pages.
- Route-Level Profitability Insights — Identify top-revenue routes, origin-destination performance, and route-wise profit margins.
- Driver Performance Benchmarking — Compare delivery records, on-time rates, revenue contribution, and profit per driver.
- Fleet Utilization Tracking — Monitor fuel cost vs profit by truck, on-time delivery percentage, and monthly profit trends at the vehicle level.
- No VBA or Macros — 100% pivot-table driven, compatible with Excel 2016 and later, including Microsoft 365.
Dashboard Pages Explained
1. Overview Page
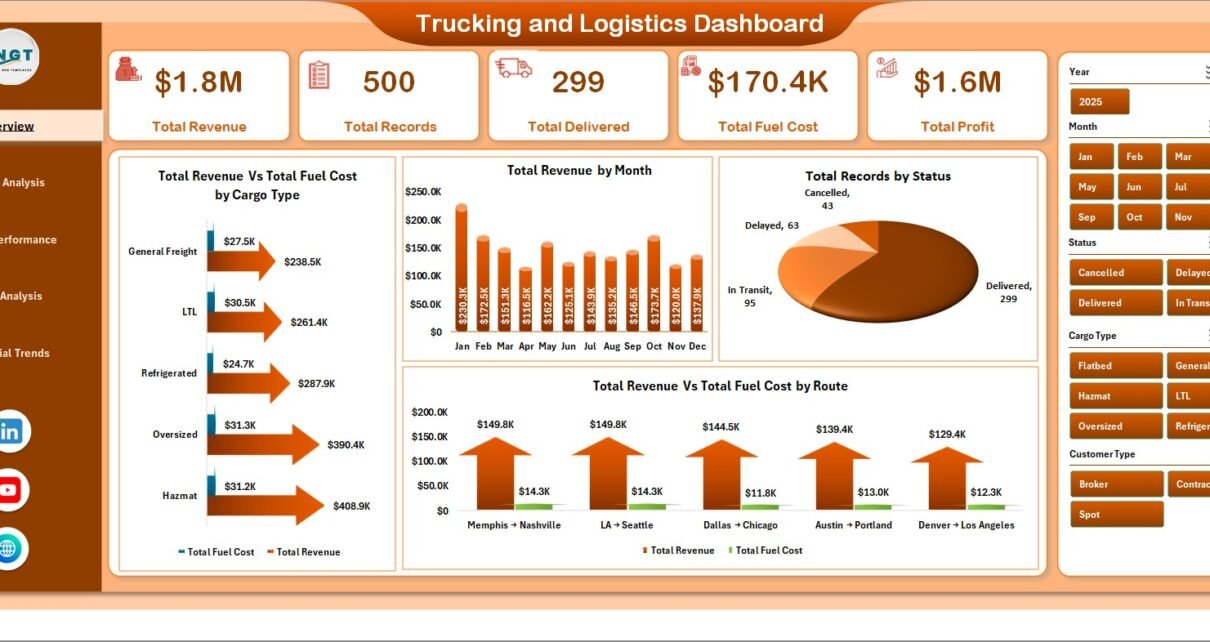
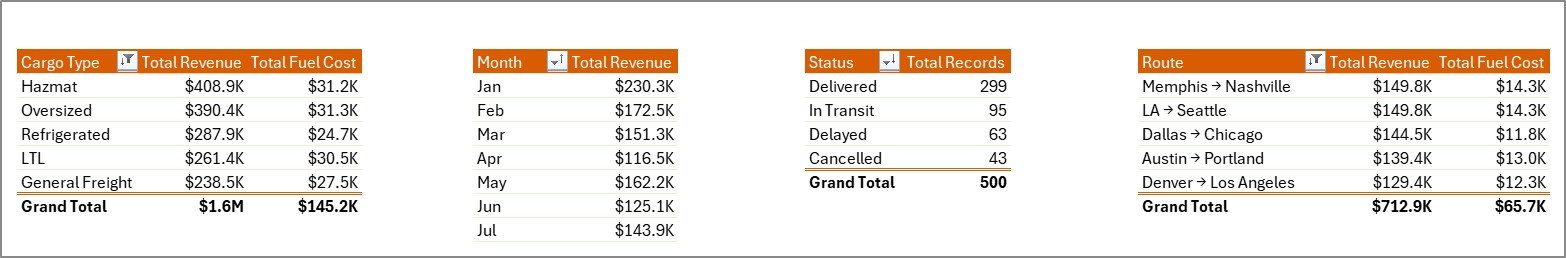
The Overview page serves as the command center of the Trucking and Logistics Dashboard in Excel. At the top, you’ll find 5 KPI summary cards displaying Total Revenue, Total Records, Total Delivered, Total Fuel Cost, and Total Profit. These cards provide an instant snapshot of your trucking operation’s health.
Below the cards, 4 analytical charts deliver deeper insights: Total Revenue vs Total Fuel Cost by Cargo Type reveals which cargo categories are most cost-efficient. Total Revenue by Month shows seasonal revenue patterns. Total Records by Status breaks down deliveries by their current status. Total Revenue vs Total Fuel Cost by Route highlights which shipping lanes are consuming the most fuel relative to revenue generated. Multiple slicers let you filter the entire page with a single click.
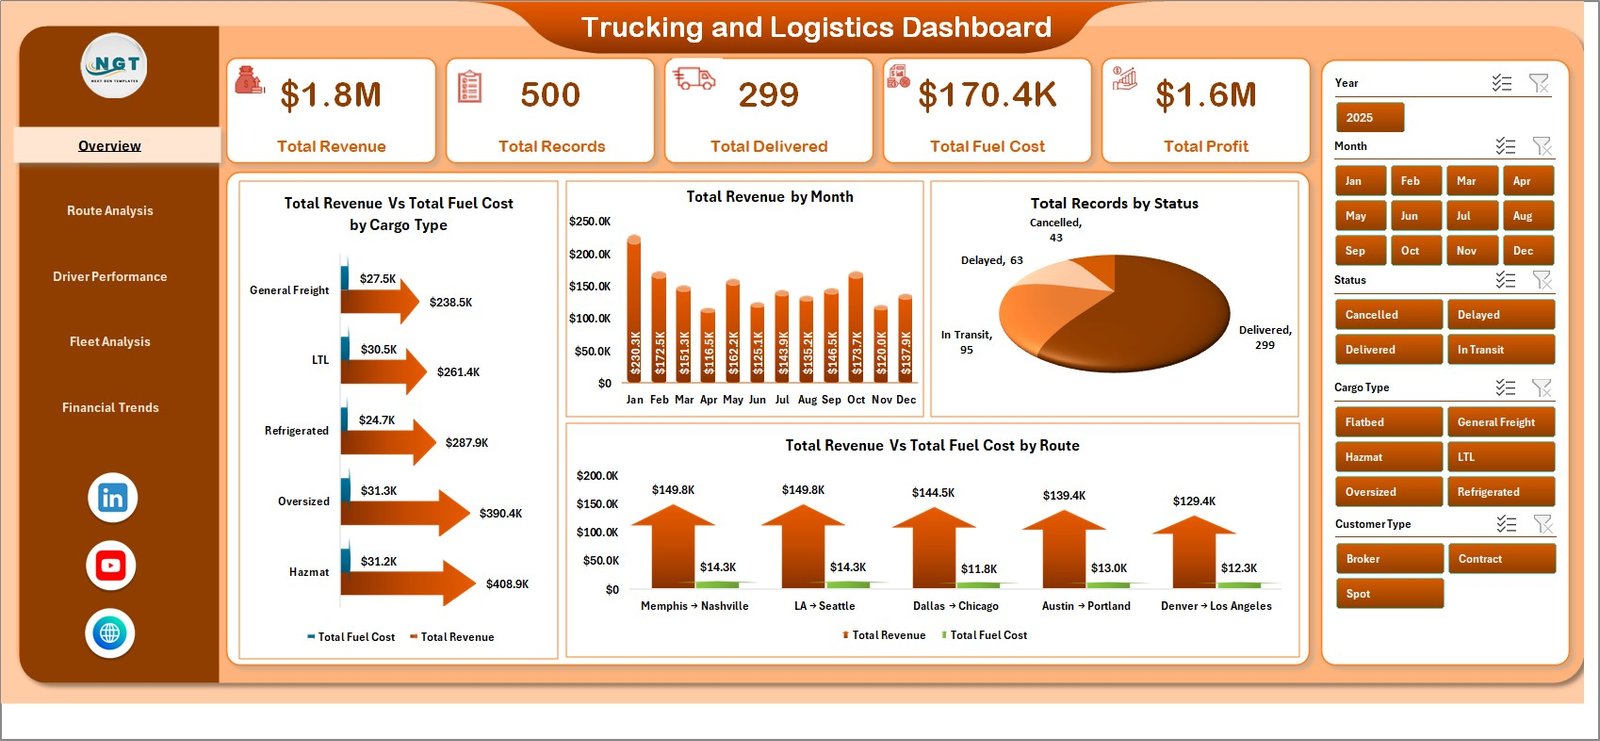
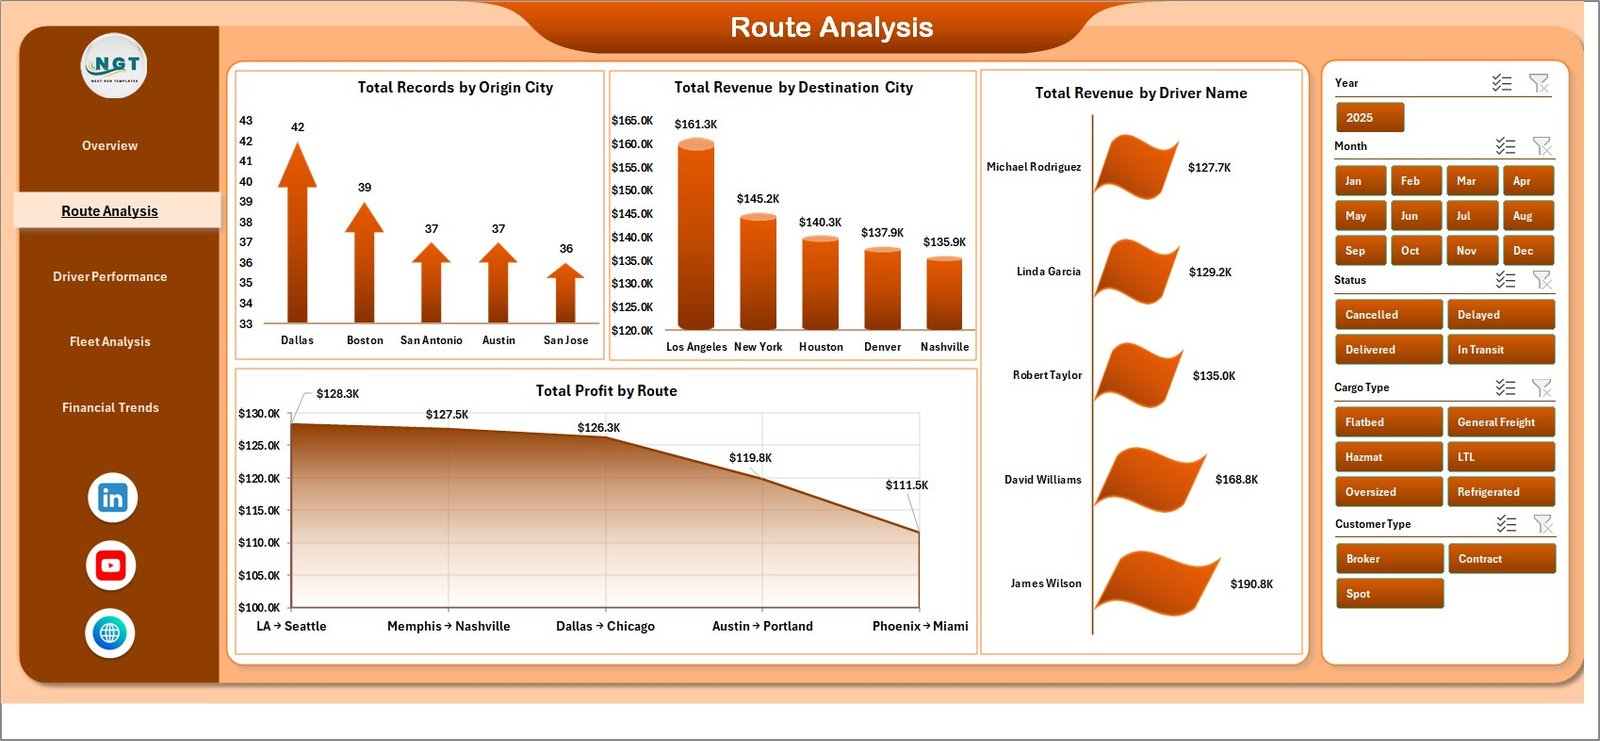
Trucking and Logistics Dashboard – Overview Page2. Route Analysis
The Route Analysis page dives into the geographic and route-level performance of your trucking operations. This page features 4 focused charts: Total Records by Origin City identifies which origin locations generate the most shipments. Total Revenue by Destination City reveals the highest-revenue delivery destinations. Total Revenue by Driver Name links route performance to specific drivers. Total Profit by Route shows which shipping lanes deliver the best bottom-line results. Use this page to optimize route planning and allocate resources to the most profitable corridors.
 Route Analysis
3. Driver Performance
The Driver Performance page is essential for fleet managers who want to evaluate individual driver contributions. It includes 4 charts: Total Records vs Total Delivered by Driver Name compares assigned loads against actual deliveries. Total On Time by Driver Name highlights drivers with the best punctuality records. Total Revenue by Truck ID connects revenue to specific vehicles. Total Profit by Driver Name reveals which drivers generate the most profit. This page helps you reward top performers and identify coaching opportunities.
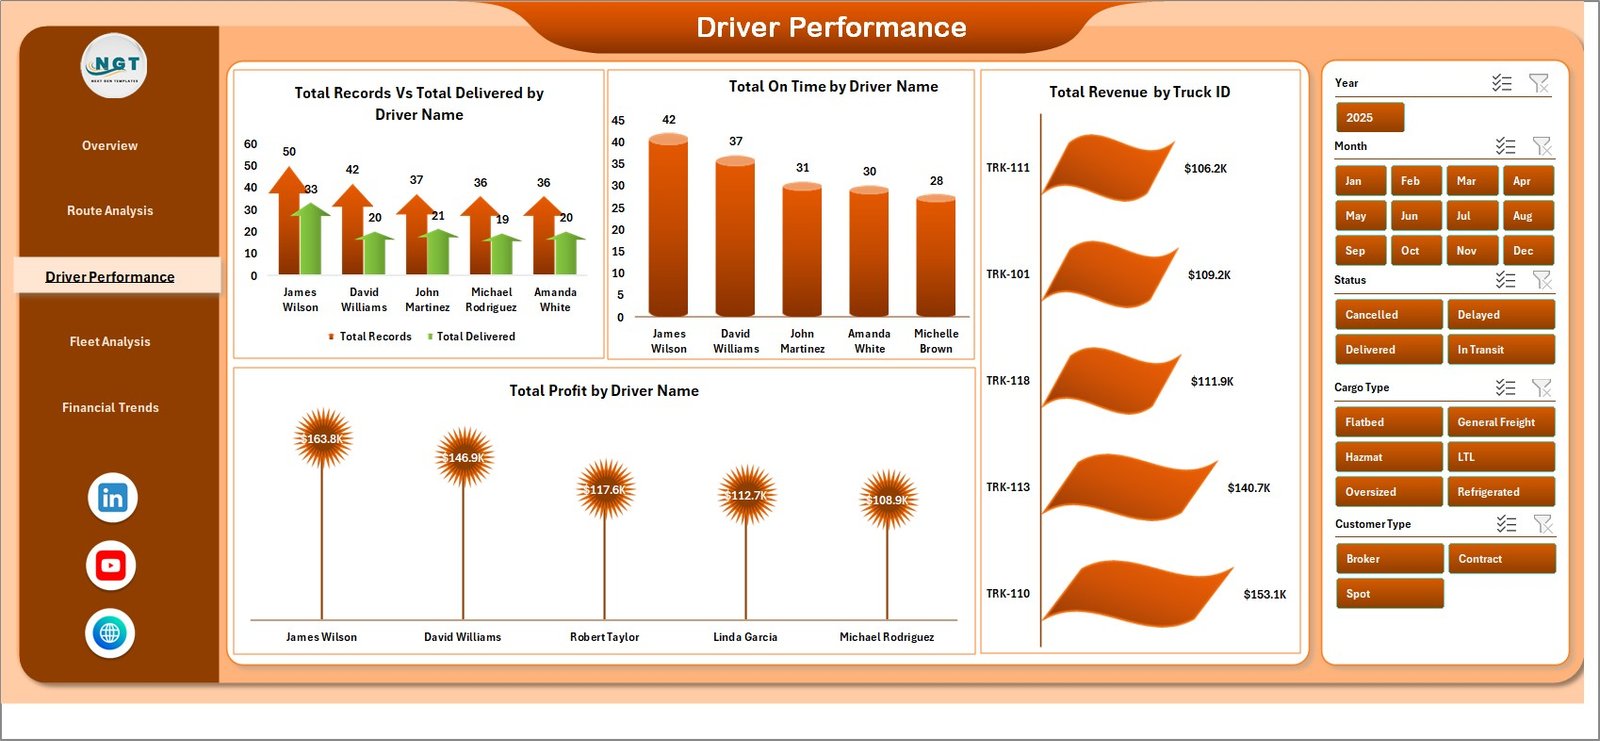 Driver Performance
4. Fleet Analysis
The Fleet Analysis page focuses on vehicle-level metrics to help you make smarter fleet management decisions. It features 4 charts: Total Records by Truck ID shows workload distribution across your fleet. Total Fuel Cost vs Total Profit by Truck reveals which trucks are the most and least cost-efficient. Total Profit by Month tracks fleet profitability trends over time. On Time % by Truck ID highlights which vehicles consistently meet delivery deadlines. Use these insights to schedule maintenance, retire underperforming trucks, or reallocate high-performing vehicles to premium routes.
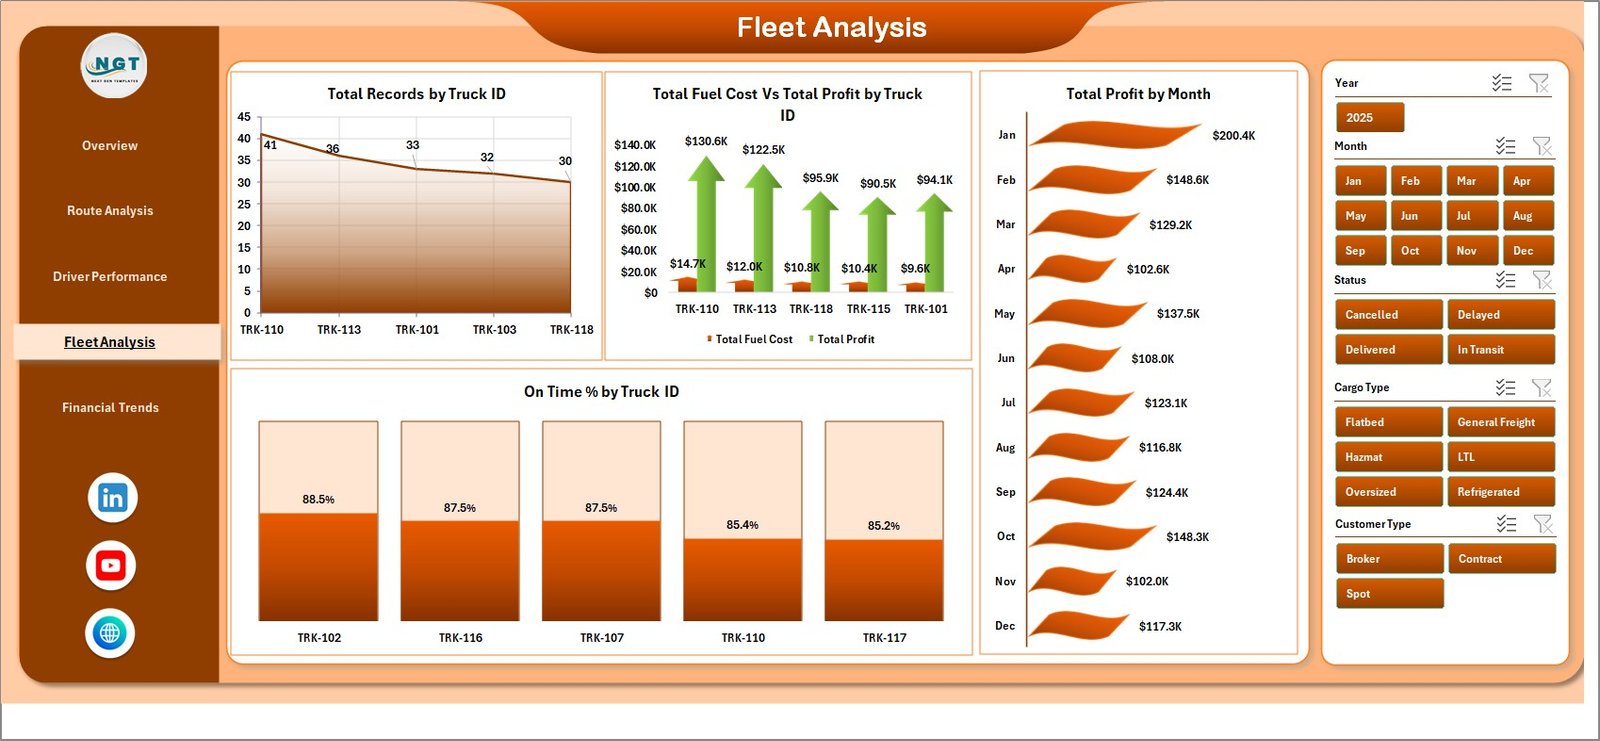 Fleet Analysis
5. Financial Trends
The Financial Trends page provides a big-picture view of your trucking company’s financial health. It includes 3 analytical charts: Total Records vs Total Delivered by Customer Type compares shipment volumes and fulfillment rates across customer segments. Total Revenue vs Total Fuel Cost by Month reveals how fuel expenses track against revenue over time. Total Revenue vs Total Profit by Customer Type shows which customer segments are most profitable after accounting for costs. This page is invaluable for budgeting, forecasting, and strategic pricing decisions.
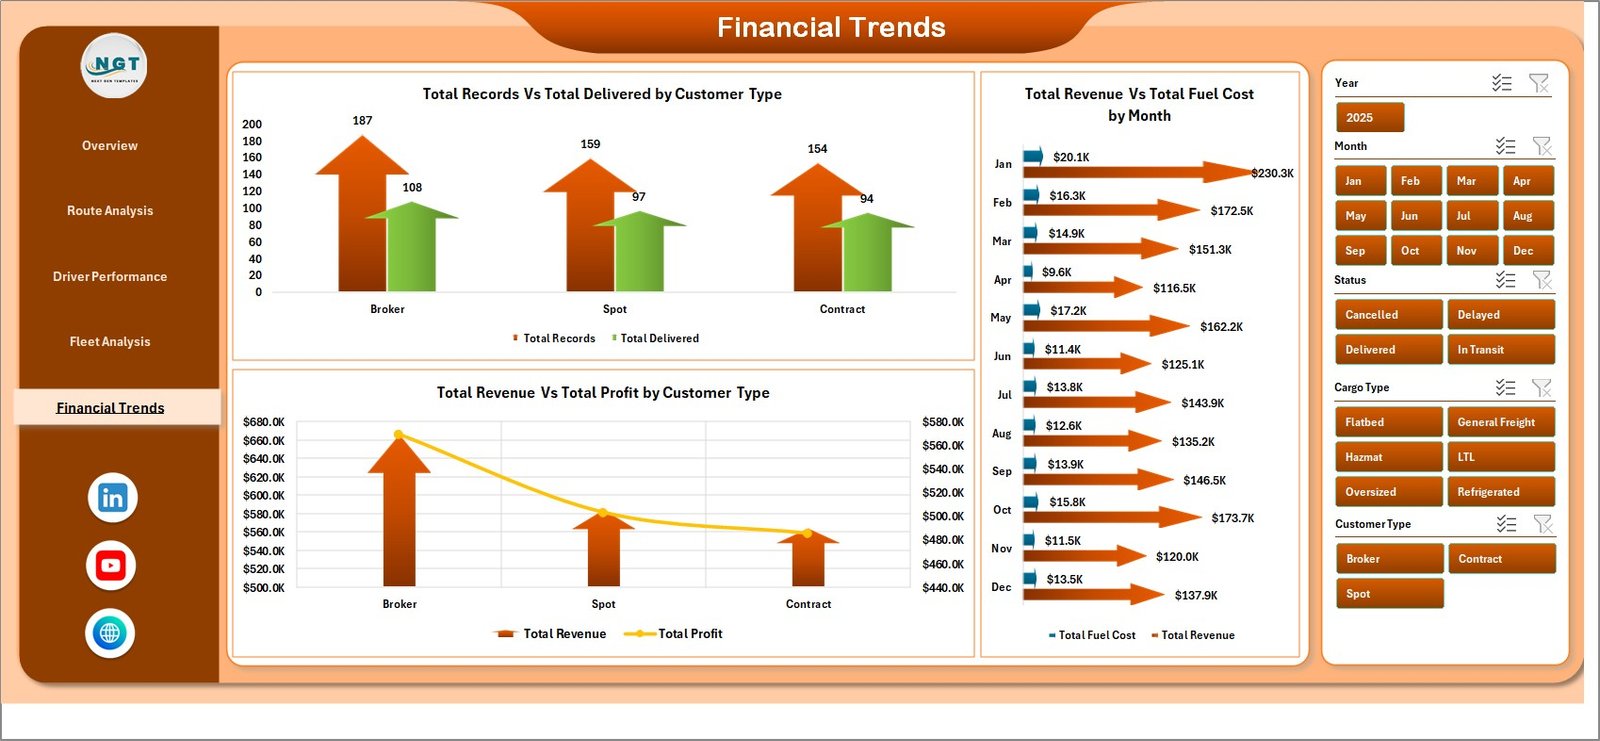 Financial Trends
6. Data Sheet
The Data Sheet is where all your trucking records live. Each row represents a single shipment with columns for dates, routes, drivers, trucks, cargo types, customer types, revenue, fuel cost, profit, delivery status, and more. To use this dashboard with your own data, simply replace the sample records with your actual trucking data in the same column format. Make sure to keep the column headers unchanged so the pivot tables can reference them correctly.
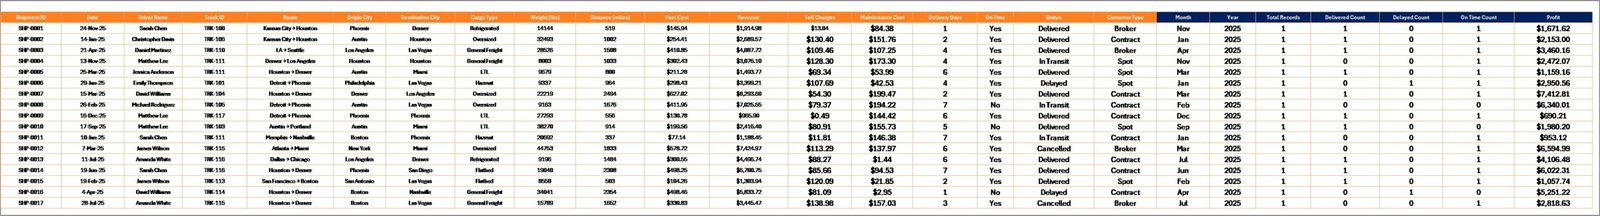 Data Sheet Tab
7. Support Sheet
The Support Sheet contains all the pivot tables that drive the entire dashboard. Each chart on the 5 dashboard pages pulls its data from a corresponding pivot table on this sheet. After updating your data in the Data Sheet, navigate to the Data tab in the Excel Ribbon and click Refresh All — every pivot table and chart will update simultaneously. You can keep this sheet hidden during presentations or when sharing the workbook with stakeholders who only need to see the visual dashboards.
 Support Sheet Tab
Advantages of the Trucking and Logistics Dashboard in Excel
- Zero Learning Curve — No macros, no VBA, no complex setup. If you can paste data into Excel and click a button, you can use this dashboard.
- Complete Operational Visibility — Five dedicated pages cover every angle of trucking operations from routes and drivers to fleet utilization and financial health.
- Instant Data Refresh — Pivot-powered architecture means one click updates every chart, card, and metric across all pages.
- Slicer-Driven Interactivity — Built-in slicers let you filter the entire dashboard by any dimension — cargo type, route, driver, truck, customer, or time period.
- Professional Presentation-Ready Design — Clean layouts with consistent formatting make it easy to share insights with executives, clients, or partners.
Opportunities for Improvement
- GPS Integration — Adding real-time GPS tracking data could enhance route analysis with actual vs planned route comparisons.
- Maintenance Cost Tracking — Including a vehicle maintenance column would allow fleet managers to calculate true total cost of ownership per truck.
- Driver Safety Scores — Incorporating incident or violation data would add a safety dimension to the driver performance analysis.
- Conditional Formatting Alerts — Adding color-coded alerts for KPIs that fall below target thresholds would make the Overview page even more actionable.
Best Practices for Using This Dashboard
- Update Data Weekly — For the most accurate insights, refresh your trucking data at least once a week and click Refresh All.
- Use Consistent Data Formats — Ensure dates, route names, driver names, and truck IDs follow the same format as the sample data to avoid pivot table errors.
- Hide the Support Sheet — Right-click the Support Sheet tab and select Hide to keep your workbook clean for presentations.
- Duplicate Before Customizing — Before making structural changes, save a backup copy so you can always revert to the original template.
- Combine with Other Templates — Pair this dashboard with a Supply Chain Analytics Dashboard or Transportation and Logistics Dashboard in HTML for a more comprehensive logistics analytics suite.
Explore Relevant Templates
If you found the Trucking and Logistics Dashboard in Excel useful, you may also want to explore these related templates from NextGenTemplates.com:
- Transportation and Logistics Dashboard in HTML — A browser-based interactive logistics dashboard with dynamic charts and filters.
- Port Logistics Dashboard in Power BI — Track port operations, vessel turnaround, and maritime logistics KPIs in Power BI.
- Supply Chain Analytics Dashboard in HTML — Monitor supply chain performance with this premium HTML dashboard.
- Inventory Management Dashboard in HTML — Track inventory levels, turnover, and stock movement across warehouses.
Also check out our collection of Excel Dashboard Templates and Best Excel Dashboard Templates for Every Industry.
Frequently Asked Questions
What is the best Excel dashboard for tracking trucking and logistics performance?
The Trucking and Logistics Dashboard in Excel is one of the most comprehensive trucking analytics templates available. It features 5 interactive dashboard pages covering overview KPIs, route analysis, driver performance, fleet utilization, and financial trends — all powered by pivot tables with automatic refresh.
How do I update the dashboard with my own trucking data?
Navigate to the Data Sheet tab, replace the sample data with your own trucking records in the same column format, then go to the Data tab in the Excel Ribbon and click Refresh All. Every pivot table and chart across all 5 dashboard pages will update instantly.
Can I track individual driver performance with this Excel template?
Yes. The Driver Performance page includes 4 dedicated charts that compare delivery records, on-time rates, revenue by truck, and profit by driver name. You can use slicers to filter by specific drivers for a focused performance review.
Does this dashboard require macros or VBA?
No. The Trucking and Logistics Dashboard in Excel is 100% powered by standard pivot tables and charts. No macros or VBA scripts are used, making it safe, lightweight, and compatible with Excel 2016 and later, including Microsoft 365.
How many records can this trucking dashboard handle?
Excel pivot tables support hundreds of thousands of rows. Whether you have 50 shipment records or 50,000, the dashboard will process and visualize your data accurately.
Can I use this dashboard to compare fuel costs against profit by truck?
Absolutely. The Fleet Analysis page includes a dedicated Total Fuel Cost vs Total Profit by Truck chart that shows exactly which trucks are the most cost-efficient and which ones are eating into your margins.
Conclusion
The Trucking and Logistics Dashboard in Excel is the ultimate analytics companion for anyone managing trucking operations, fleet logistics, or freight delivery networks. With 5 purpose-built dashboard pages, KPI summary cards, dynamic slicers, and fully automated pivot chart refresh, this template eliminates hours of manual reporting and gives you the insights you need to optimize routes, reward top drivers, reduce fuel costs, and maximize profitability.
Click here to Purchase the Trucking and Logistics Dashboard in Excel
For step-by-step video tutorials on how to use this and other Excel dashboard templates, visit our YouTube channel:
👉 Youtube.com/@PK-AnExcelExpert