The used car industry is growing faster than ever before. With increasing demand for affordable vehicles, dealerships and resellers are constantly striving to improve performance, efficiency, and profitability. But how do you track success when so many factors influence sales—inventory turnover, pricing strategies, lead conversion, financing approvals, customer satisfaction, and more?
This is where a Used Car Sales KPI Dashboard in Power BI becomes a game changer. It transforms raw sales data into meaningful insights that help managers, analysts, and business owners make data-driven decisions.
In this article, we will explore the structure, features, advantages, best practices, and use cases of a Used Car Sales KPI Dashboard in Power BI. By the end, you’ll understand how to harness this tool to maximize sales performance and stay ahead of the competition.
Click to Purchases Used Car Sales KPI Dashboard in Power BI
What Is a Used Car Sales KPI Dashboard in Power BI?
A Used Car Sales KPI Dashboard is a Power BI-based reporting solution that consolidates dealership performance metrics into a single interactive platform. Instead of manually checking Excel sheets or scattered reports, you can view everything—monthly sales, targets, customer trends, and year-over-year comparisons—in one place.
The dashboard connects directly to an Excel data source that holds your actual and target figures. With visualizations, slicers, and drill-through features, managers can analyze performance across timeframes and compare against both targets and previous year benchmarks.
Structure of the Used Car Sales KPI Dashboard
The dashboard is designed with three interactive pages in the Power BI desktop application. Let’s go through each one.
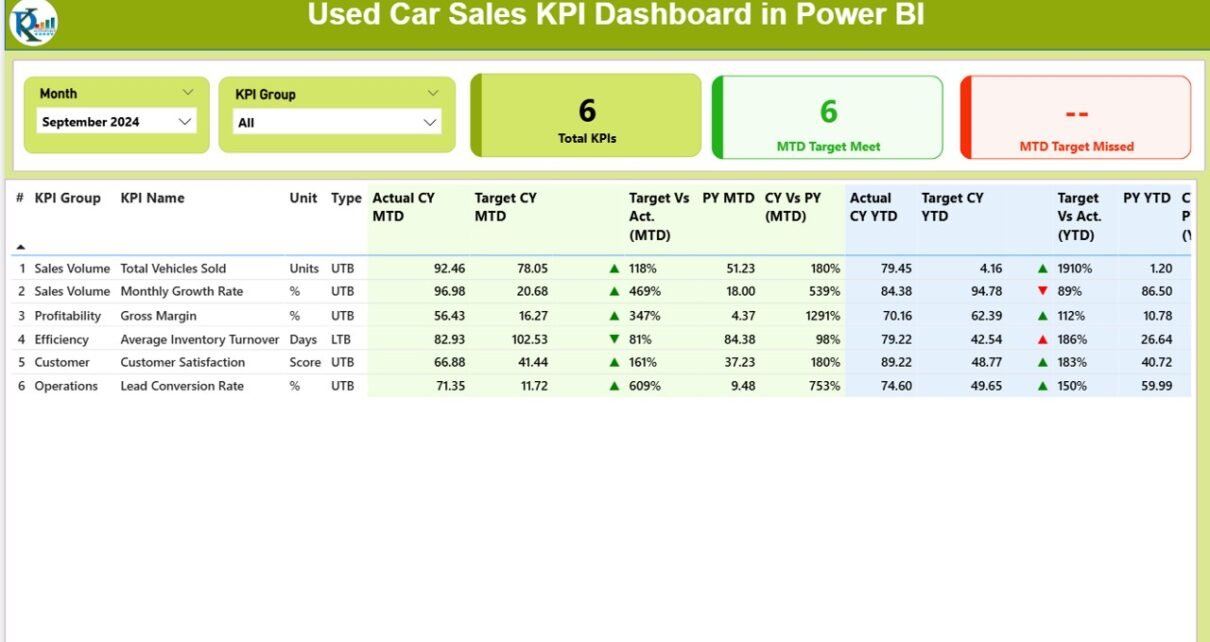
Summary Page
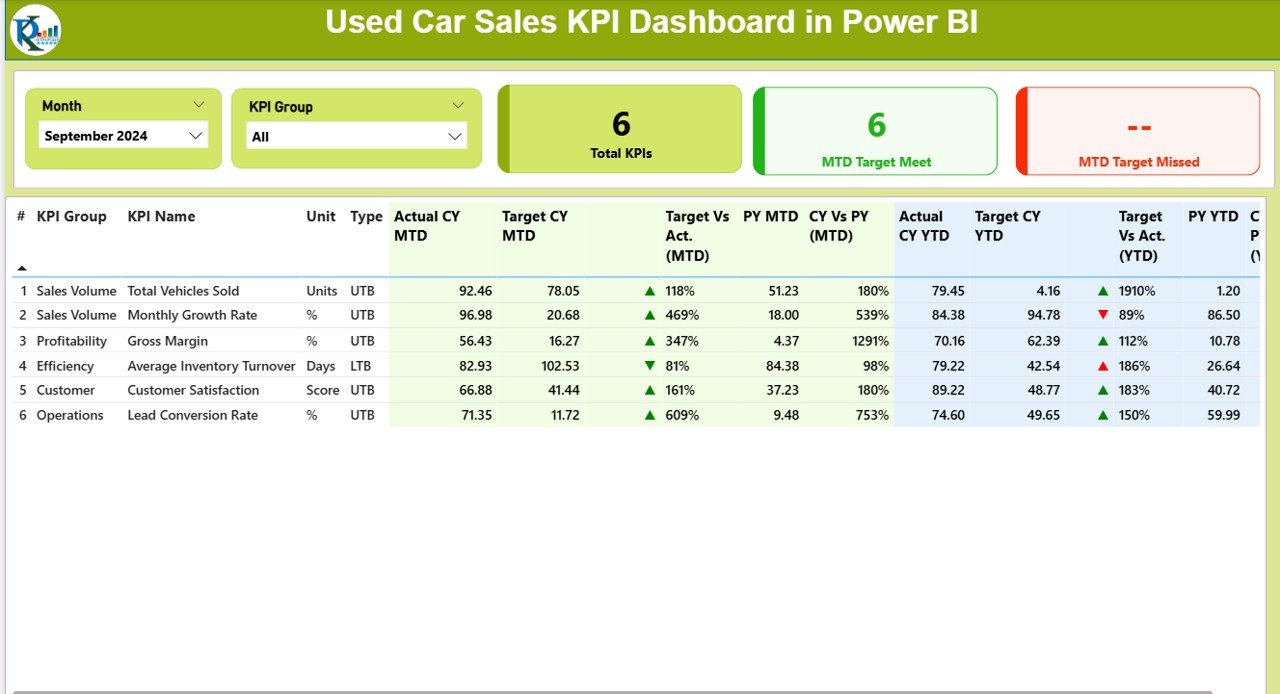
The Summary Page is the heart of the dashboard. It gives you a quick snapshot of how your dealership is performing.
-
Top Section Slicers: Month selector and KPI Group slicer for easy filtering.
KPI Cards:
- Total KPI count
- MTD (Month-to-Date) Target Met
- MTD Target Missed
Detailed KPI Table: Includes:
- KPI Number – Unique identifier for each KPI.
- KPI Group – Category such as Sales, Finance, or Customer Experience.
- KPI Name – Specific metric (e.g., “Units Sold”, “Leads Converted”).
- Unit – Measurement unit (e.g., %, $, Number of Cars).
- Type – Defines whether higher values are better (UTB = Upper the Better) or lower values are better (LTB = Lower the Better).
- Actual CY MTD – Current Year MTD value.
- Target CY MTD – Target MTD value.
- MTD Icon – ▲ or ▼ in green or red, indicating performance vs target.
- Target vs Actual (MTD) – % achievement formula = Actual ÷ Target.
- PY MTD – Previous Year MTD for comparison.
- CY vs PY (MTD) – Performance difference between current and previous year.
- Actual CY YTD – Current Year Year-to-Date value.
- Target CY YTD – Target YTD value.
- YTD Icon – ▲ or ▼ status for YTD.
- Target vs Actual (YTD) – % achievement formula = Actual ÷ Target.
- PY YTD – Previous Year YTD value.
- CY vs PY (YTD) – Year-over-year comparison for YTD.
This page allows dealership managers to instantly see which KPIs are on track and which ones require urgent attention.
Click to Purchases Used Car Sales KPI Dashboard in Power BI
KPI Trend Page
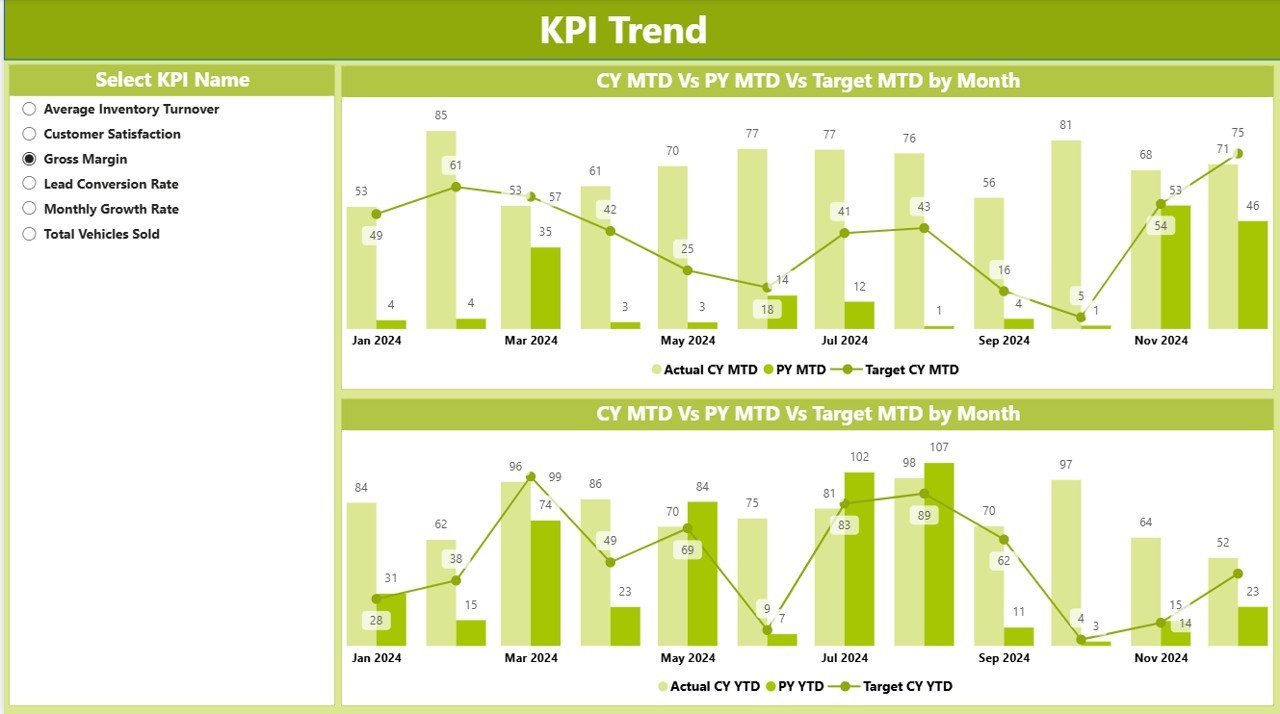
The KPI Trend Page helps you go beyond numbers and see actual performance trends over time.
-
Combo Charts: Compare Actual vs Target vs Previous Year for both MTD and YTD.
-
Slicer on the Left: Filter by KPI Name to see performance trends for a specific metric.
Example: If you select “Units Sold,” you can instantly compare how your dealership performed this month versus last year and how close you are to the target.
KPI Definition Page
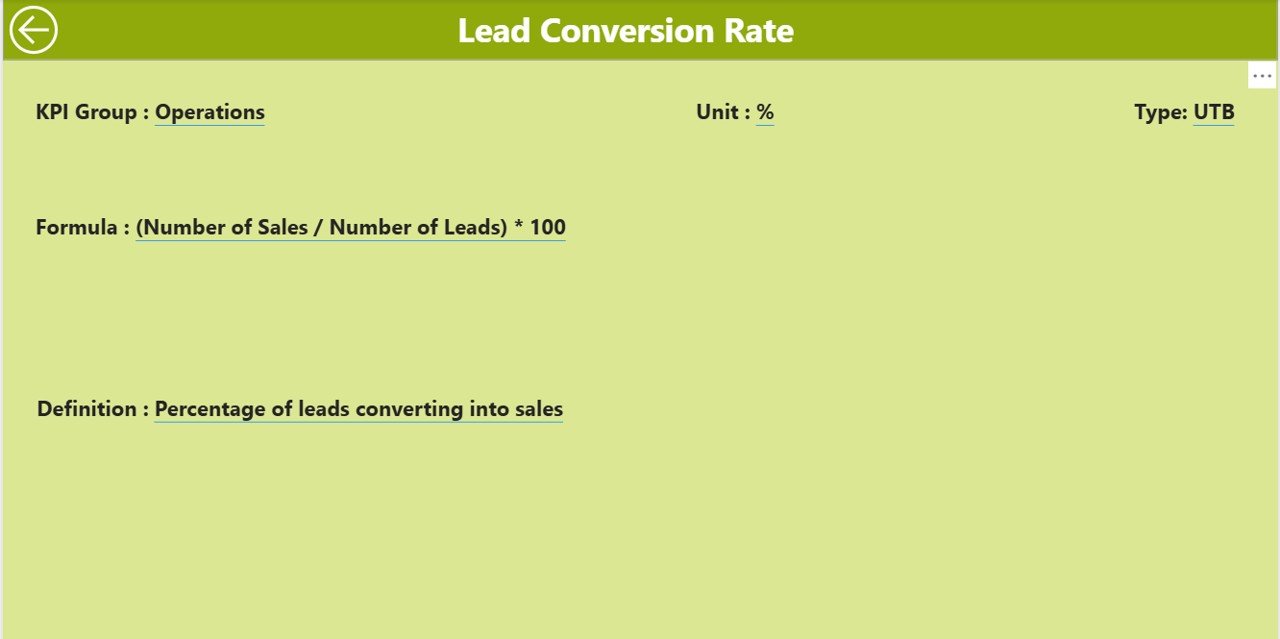
The KPI Definition Page is designed as a drill-through page for deeper insights.
-
Shows KPI definition, formula, and calculation logic.
-
Helps managers and staff clearly understand what each KPI means.
-
Ensures transparency across the team so everyone is aligned on measurement standards.
-
Hidden by default, but accessible via drill-through from the Summary Page.
Excel Data Source Structure
The Power BI dashboard connects to a structured Excel file with three main worksheets:
-
Input_Actual Sheet
-
Columns: KPI Name, Month (first date of month), MTD value, YTD value.
-
Enter actual values here.
-
-
Input_Target Sheet
-
Columns: KPI Name, Month, MTD target, YTD target.
-
Enter targets here for comparison.
-
-
KPI Definition Sheet
-
Columns: KPI Number, KPI Group, KPI Name, Unit, Formula, Definition, Type (UTB/LTB).
-
Defines all KPIs for consistency.
-
This design makes it easy to update numbers monthly without touching the dashboard visuals.
Why Do Dealerships Need a KPI Dashboard in Power BI?
The used car industry is competitive and dynamic. Traditional static reports fail to provide the agility managers need. A Power BI dashboard offers:
-
Real-time visibility into performance.
-
Automated comparisons with past performance and targets.
-
Better decision-making with interactive filtering.
-
Reduced manual reporting effort, saving time.
-
Clarity and transparency across sales, finance, and operations.
Advantages of a Used Car Sales KPI Dashboard
✅ Centralized Tracking – No more scattered Excel files or manual reports.
✅ Visual Clarity – Icons, charts, and trend lines make insights easy to grasp.
✅ Target vs Actual Monitoring – Quickly see where sales performance stands.
✅ Year-over-Year Comparison – Track growth or decline over time.
✅ Data-Driven Culture – Encourages accountability in teams.
✅ Customizable – Add or remove KPIs as per business requirements.
Click to Purchases Used Car Sales KPI Dashboard in Power BI
Practical Use Cases
-
Dealership Owners: Monitor monthly and yearly performance at a glance.
-
Sales Managers: Identify top-performing sales reps and weak areas.
-
Finance Teams: Track revenue, financing approvals, and margins.
-
Operations Managers: Analyze lead-to-sale conversion trends.
-
Marketing Teams: Measure the effectiveness of campaigns on sales growth.
Best Practices for the Used Car Sales KPI Dashboard
🚀 Define KPIs Clearly – Ensure every KPI has a definition, formula, and owner.
🚀 Update Data Regularly – Feed accurate monthly inputs from Excel.
🚀 Use Slicers Effectively – Empower users to filter by month, KPI group, or KPI name.
🚀 Leverage Drill-Through – Encourage managers to explore KPI definitions for clarity.
🚀 Benchmark with Industry Standards – Compare not only with your past but also with competitors where possible.
🚀 Keep It Simple – Avoid clutter; only include KPIs that matter to the business.
Opportunities for Improvement
Even the best dashboards can evolve. Here are areas where dealerships can enhance value:
-
Integrate with CRM Systems: Pull live lead and sales data.
-
Add Customer Satisfaction Metrics: Track post-sale surveys.
-
Include Inventory Analysis: Combine sales KPIs with stock turnover.
-
Mobile-Friendly Dashboards: Make insights accessible anywhere.
-
Predictive Analytics: Forecast sales based on historical patterns.
Conclusion
The Used Car Sales KPI Dashboard in Power BI is more than just a reporting tool—it’s a strategic asset. By consolidating sales, financial, and operational metrics into one interactive platform, dealerships can stay competitive, improve decision-making, and maximize profits.
When you combine Excel’s simplicity for data entry with Power BI’s visualization power, you get a scalable, future-ready solution that any dealership can adopt.
If you want to transform how you monitor sales performance, this dashboard is the perfect starting point.
Frequently Asked Questions (FAQs)
1. What is a KPI Dashboard in Power BI?
It’s a visual reporting tool that consolidates performance metrics into one interactive view for easy analysis.
2. Why do dealerships need a Used Car Sales Dashboard?
It helps track sales, compare targets vs actuals, monitor trends, and improve decision-making.
Visit our YouTube channel to learn step-by-step video tutorials