Managing vendor payments plays a critical role in every organization. However, many finance teams still depend on spreadsheets, emails, and manual tracking systems. As a result, they struggle with delayed payments, missed due dates, poor visibility, and rising overdue amounts.
Therefore, businesses need a smarter and faster way to monitor invoices, outstanding balances, and payment status. This is exactly where a Vendor Payment Dashboard in Power BI becomes essential.
This dashboard transforms raw invoice data into clear, interactive, and real-time insights. Instead of reviewing multiple Excel sheets, finance teams can instantly track total invoices, outstanding amounts, overdue payments, and payment methods — all in one place.
In this detailed guide, you will learn:
- What a Vendor Payment Dashboard in Power BI is
- Why businesses need it
- Dashboard pages and features
- Advantages of using it
- Best practices for implementation
- Frequently asked questions
By the end, you will clearly understand how this dashboard improves cash flow control and vendor relationship management.
Click to buy Vendor Payment Dashboard in Power BI
What Is a Vendor Payment Dashboard in Power BI?
A Vendor Payment Dashboard in Power BI is an interactive analytics solution designed to monitor, analyze, and manage vendor invoices and payments.
Instead of checking payment status manually, users can:
- Track total invoices in real time
- Monitor paid, partially paid, and pending invoices
- Analyze overdue amounts
- Evaluate outstanding balances by payment method
- Identify trends month by month
Because Power BI offers dynamic visuals and slicers, users can filter data by vendor, category, payment method, or time period instantly.
Why Do Businesses Need a Vendor Payment Dashboard?
Many companies face payment-related challenges. For example:
- Finance teams lose visibility into outstanding invoices
- Vendors follow up repeatedly for pending payments
- Overdue invoices increase penalties
- Cash flow forecasting becomes inaccurate
- Manual reports consume time
However, when organizations use a Vendor Payment Dashboard in Power BI, they gain instant clarity. Moreover, leadership can make data-driven decisions quickly.
Key Features of Vendor Payment Dashboard in Power BI
This dashboard contains 5 interactive pages inside the Power BI desktop application. Each page focuses on a specific analysis area.
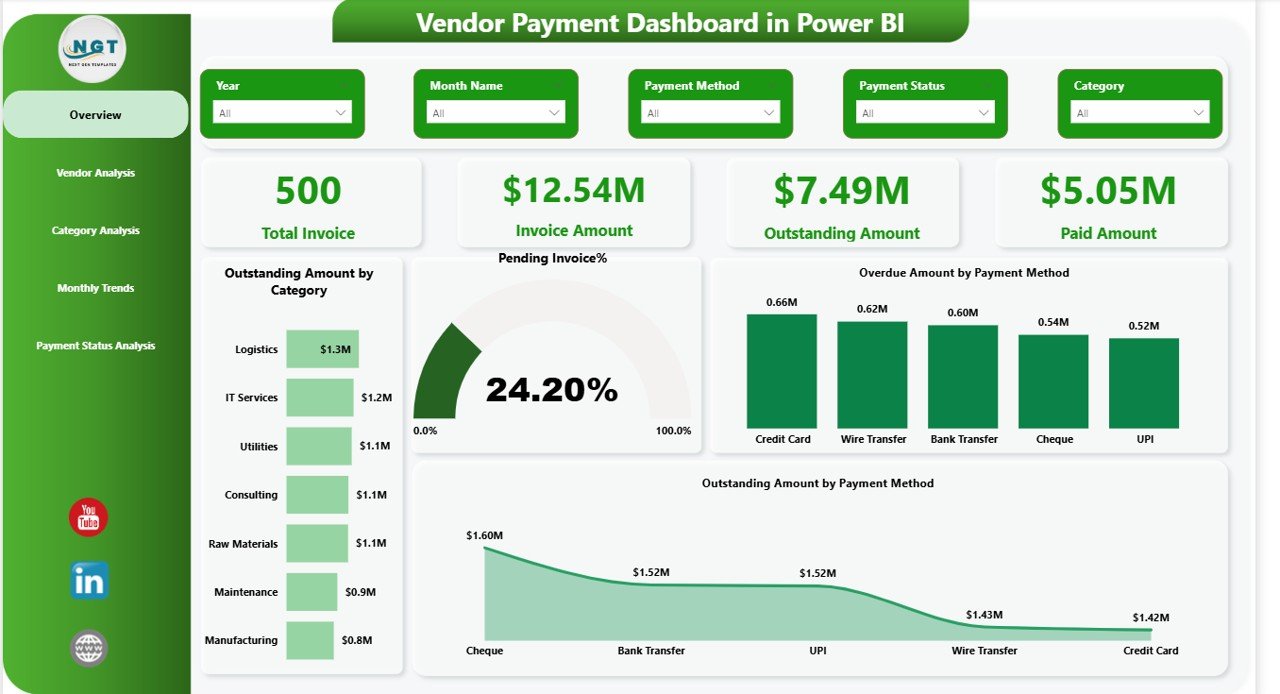
Overview Page – How Does It Provide a Complete Snapshot?
The Overview page acts as the central control panel. Here, users can apply slicers to filter data by category, payment method, or date.
Key KPI Cards
- Total Invoices
- Invoice Amount
- Outstanding Amount
- Paid Amount
- Pending Invoice %
Visual Insights
- Outstanding amount by payment method
- Overdue amount by payment method
- Pending percentage of invoices
Because this page summarizes everything, finance managers can immediately identify risk areas.
Click to buy Vendor Payment Dashboard in Power BI
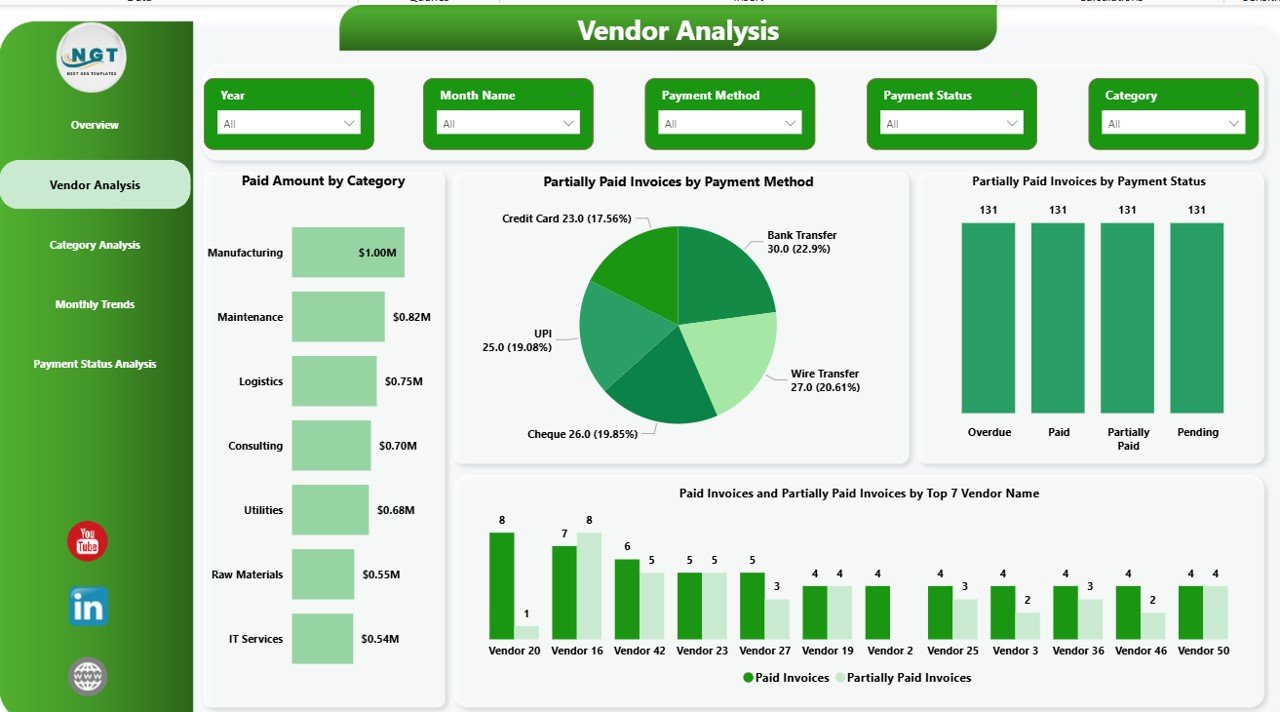
Vendor Analysis – How Can You Track Vendor-Level Performance?
The Vendor Analysis page helps organizations understand vendor-wise payment behavior.
Insights Available
- Paid amount by category
- Partially paid invoices by payment method
- Partially paid invoices by payment status
Therefore, businesses can identify vendors with frequent partial payments. In addition, they can prioritize high-value vendors.
Click to buy Vendor Payment Dashboard in Power BI
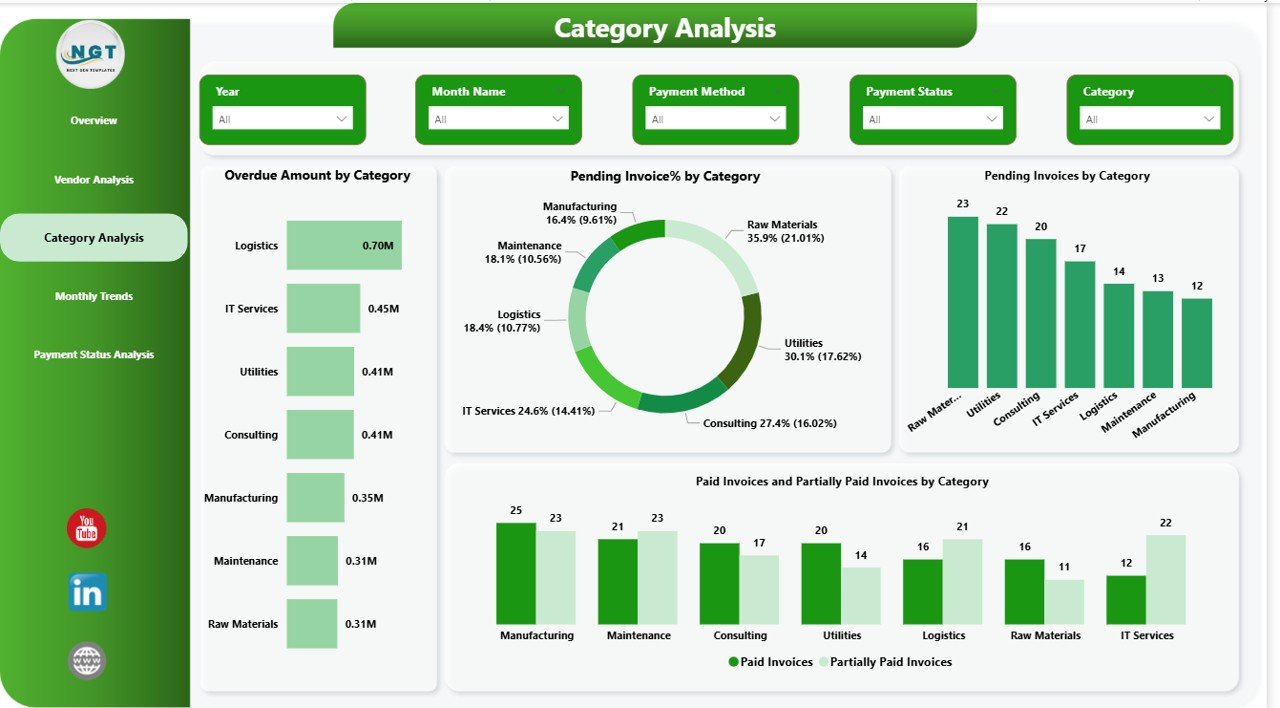
Category Analysis – How Can You Analyze Spending Categories?
Organizations often categorize vendors into services, supplies, logistics, IT, and more. Therefore, analyzing payments by category becomes important.
Key Charts
- Overdue amount by category
- Pending invoices % by category
- Pending invoices by category
- Paid invoices and partially paid invoices by category
Because this analysis shows category-wise risk, finance teams can focus on high-risk areas.
Click to buy Vendor Payment Dashboard in Power BI
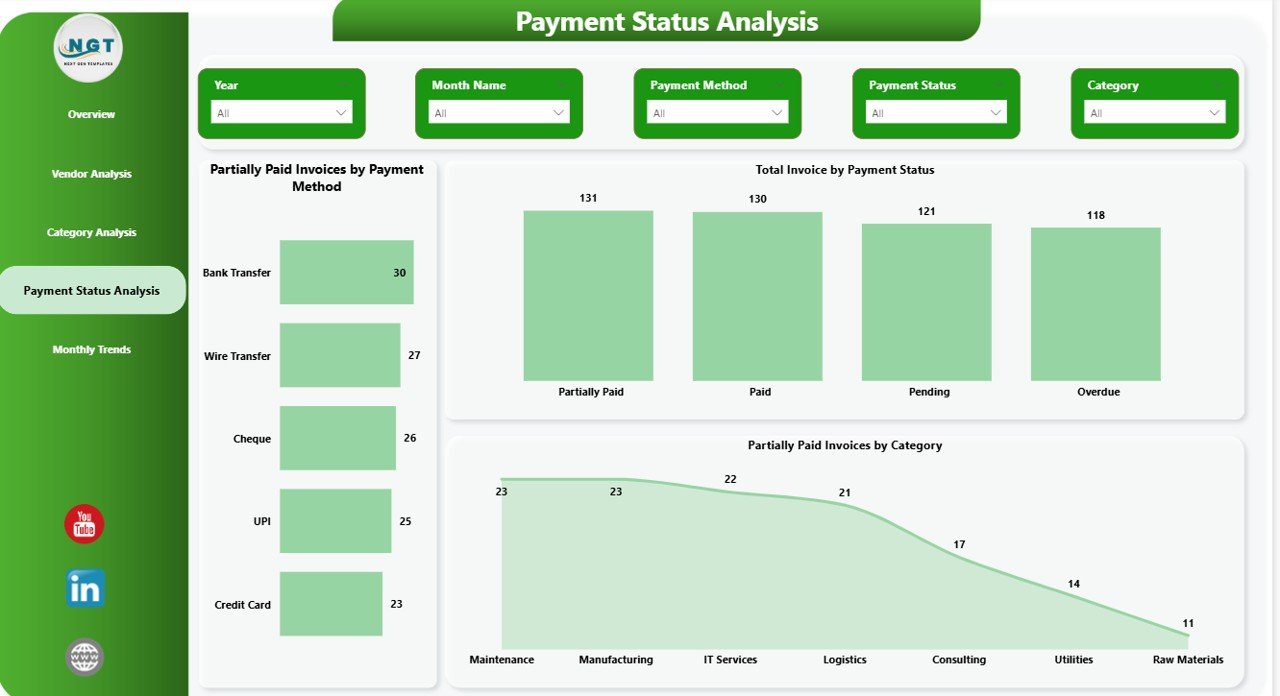
Payment Status Analysis – How Can You Monitor Payment Health?
Payment status tracking ensures financial discipline. Therefore, this page provides detailed insights into invoice status.
Charts Included
- Partially paid invoices by payment method
- Total invoices by payment status
- Partially paid invoices by category
As a result, users can quickly detect payment bottlenecks.
Click to buy Vendor Payment Dashboard in Power BI
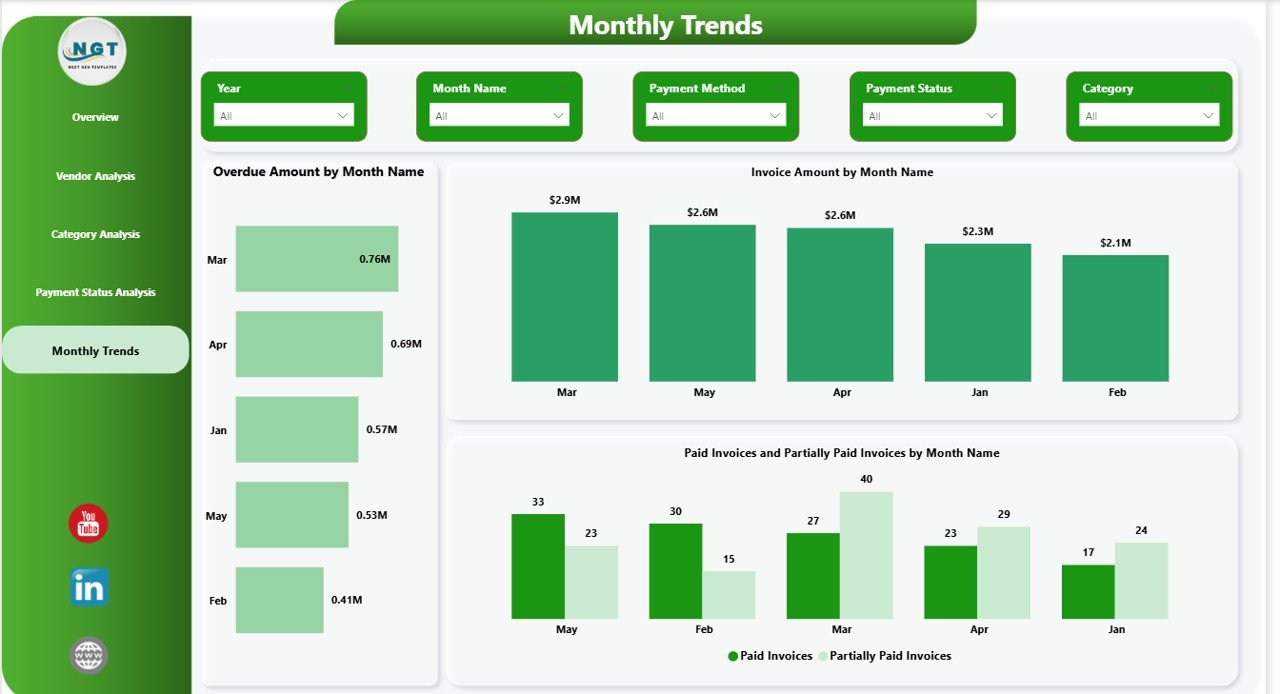
Monthly Trends – How Can You Track Payment Patterns Over Time?
Monthly analysis improves forecasting and planning. Therefore, the Monthly Trends page shows:
- Overdue amount by month
- Invoice amount by month
- Paid and partially paid invoices by month
Because of trend analysis, businesses can detect seasonal spikes and manage cash flow accordingly.
Click to buy Vendor Payment Dashboard in Power BI
How Does Vendor Payment Dashboard Improve Cash Flow?
Cash flow determines business stability. However, delayed payments and high outstanding amounts create financial pressure.
This dashboard helps because it:
- Highlights overdue invoices instantly
- Tracks outstanding balances clearly
- Shows payment method trends
- Identifies partial payment risks
- Improves forecasting accuracy
Consequently, companies maintain better liquidity control.
Advantages of Vendor Payment Dashboard in Power BI
Implementing this dashboard delivers multiple business benefits.
Improves Financial Visibility
Finance teams can see invoice data in one centralized view. Therefore, they avoid confusion and reduce reporting time.
Reduces Overdue Payments
Since the dashboard highlights overdue invoices clearly, teams can act immediately.
Enhances Vendor Relationships
When companies pay vendors on time, they build trust. As a result, vendors offer better terms and services.
Supports Data-Driven Decisions
Leadership can analyze payment patterns and adjust strategies accordingly.
Saves Time and Effort
Instead of creating manual reports, users refresh data and get instant insights.
Strengthens Internal Control
The dashboard promotes transparency. Therefore, organizations reduce errors and financial mismanagement.
How to Implement Vendor Payment Dashboard in Power BI?
If you want to implement this solution, follow these steps:
Step 1: Prepare Invoice Data
Include fields such as:
- Invoice Number
- Vendor Name
- Invoice Date
- Due Date
- Invoice Amount
- Paid Amount
- Payment Method
- Payment Status
Step 2: Import Data into Power BI
Use Power Query to clean and transform data.
Step 3: Create Calculated Measures
For example:
- Outstanding Amount = Invoice Amount – Paid Amount
- Overdue Flag = IF(Today > Due Date, “Yes”, “No”)
- Pending % = Pending Invoices / Total Invoices
Step 4: Design Interactive Visuals
Use:
- KPI Cards
- Bar Charts
- Donut Charts
- Trend Line Charts
- Slicers
Step 5: Test and Validate Data
Always cross-check totals with accounting records.
Best Practices for the Vendor Payment Dashboard
To maximize performance, follow these best practices:
Keep Data Clean and Updated
Always maintain consistent vendor names and payment categories.
Automate Data Refresh
Schedule automatic refresh to ensure real-time reporting.
Use Clear Payment Status Definitions
Define Paid, Partially Paid, Pending, and Overdue clearly.
Limit Visual Clutter
Avoid too many visuals on one page. Focus on key KPIs.
Use Conditional Formatting
Highlight overdue and high-risk invoices in red.
Monitor Monthly Trends Regularly
Review trend data to improve planning and budgeting.
Common Challenges and How to Solve Them
Problem 1: Duplicate Vendor Records
Solution: Use unique vendor IDs.
Problem 2: Incorrect Payment Status
Solution: Use calculated columns for accuracy.
Problem 3: Data Entry Errors
Solution: Validate input data before uploading.
Problem 4: Delayed Reporting
Solution: Automate refresh schedules.
Who Should Use Vendor Payment Dashboard?
This dashboard benefits:
- Finance Managers
- Accounts Payable Teams
- CFOs
- Procurement Managers
- Business Owners
Because it simplifies payment tracking, it suits businesses of all sizes.
How Does This Dashboard Support Strategic Decision-Making?
Beyond daily operations, this dashboard helps with:
- Budget planning
- Vendor negotiation
- Risk management
- Cash flow forecasting
- Compliance reporting
Therefore, it becomes a strategic financial tool.
Conclusion
Vendor payment management requires accuracy, speed, and visibility. However, manual systems create delays and errors. Therefore, organizations must adopt smarter solutions.
A Vendor Payment Dashboard in Power BI provides complete transparency into invoices, outstanding balances, overdue amounts, and payment trends. Moreover, it enhances vendor relationships, improves cash flow, and strengthens internal controls.
If you want better financial control and faster insights, this dashboard offers the perfect solution.
Frequently Asked Questions (FAQs)
- What is a Vendor Payment Dashboard in Power BI?
- It is an interactive reporting solution that tracks invoices, payments, outstanding amounts, and overdue status in real time.
- Can small businesses use this dashboard?
- Yes. Small and medium businesses can use it to manage vendor payments efficiently.
- Does the dashboard support real-time updates?
- Yes. You can schedule automatic data refresh in Power BI.
- What data do I need to build this dashboard?
- You need invoice details, vendor information, payment amounts, due dates, and payment status.
- How does this dashboard reduce overdue payments?
- It highlights overdue invoices clearly, so finance teams can take action immediately.
- Can I customize the dashboard?
Yes. You can modify visuals, filters, and measures according to your business needs.
Watch the step-by-step video tutorial:
Visit our YouTube channel to learn step-by-step video tutorials
Click to buy Vendor Payment Dashboard in Power BI