Venture capital firms operate in a fast-moving, high-risk environment. Therefore, partners, analysts, and fund managers must always track performance accurately. However, manual Excel reports, scattered data files, and delayed reviews often slow down decisions. Because of this, many VC firms now rely on a Venture Capital KPI Dashboard in Power BI.
A Venture Capital KPI Dashboard in Power BI gives a single, clear view of investment performance, portfolio health, and fund progress. Moreover, it transforms raw Excel data into meaningful insights using interactive visuals, slicers, and automated comparisons. As a result, decision-makers act faster and smarter.
In this detailed article, you will learn what a Venture Capital KPI Dashboard in Power BI is, how it works, why it matters, what pages it includes, and how you can use it effectively. Additionally, you will explore its advantages, best practices, and frequently asked questions.
Click to buy Venture Capital KPI Dashboard in Power BI
What Is a Venture Capital KPI Dashboard in Power BI?
A Venture Capital KPI Dashboard in Power BI is a ready-to-use analytical solution designed to track, monitor, and analyze venture capital KPIs in a structured and visual way. It uses Excel as the data source and Power BI Desktop as the reporting layer.
Instead of managing multiple spreadsheets, this dashboard provides:
- A centralized performance summary
- Clear Month-to-Date (MTD) and Year-to-Date (YTD) tracking
- Target vs Actual comparisons
- Current Year vs Previous Year analysis
- Drill-through KPI definitions for complete clarity
Because Power BI updates visuals instantly, users gain real-time insights with minimal effort.
Why Is KPI Tracking Important in Venture Capital?
Venture capital success depends on timing, performance, and smart analysis. Therefore, KPI tracking plays a critical role.
Key Reasons KPI Tracking Matters
- It improves portfolio visibility
- It supports data-backed investment decisions
- It highlights underperforming metrics early
- It aligns fund performance with strategic targets
- It strengthens reporting for stakeholders
Without proper KPI tracking, VC firms often miss early warning signs. However, a KPI dashboard solves this issue effectively.
Overview of the Venture Capital KPI Dashboard in Power BI
The Venture Capital KPI Dashboard in Power BI is a ready-to-use dashboard built for clarity, speed, and accuracy. It captures data from Excel and converts it into interactive reports.
Technical Setup at a Glance
- Tool Used: Power BI Desktop
- Data Source: Microsoft Excel
- Pages: 3 interactive pages
- Navigation: Slicers, drill-through, and back buttons
Because of this structure, users manage KPIs efficiently without complex configurations.
What Pages Are Included in the Venture Capital KPI Dashboard?
The dashboard contains three well-structured pages, each serving a specific analytical purpose.
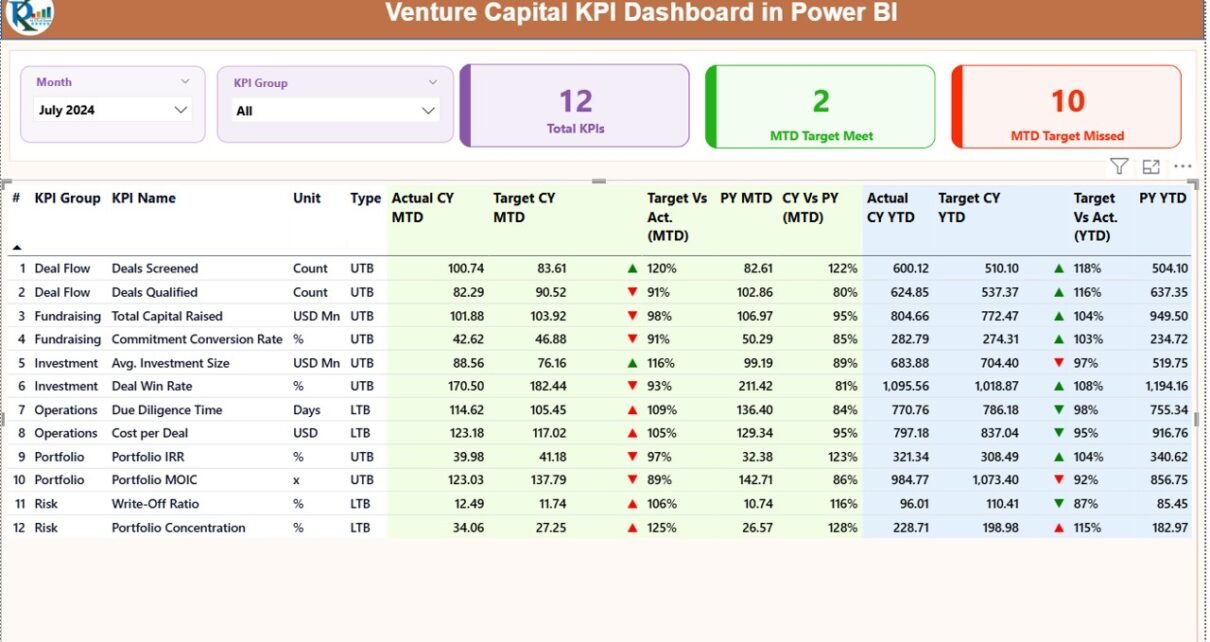
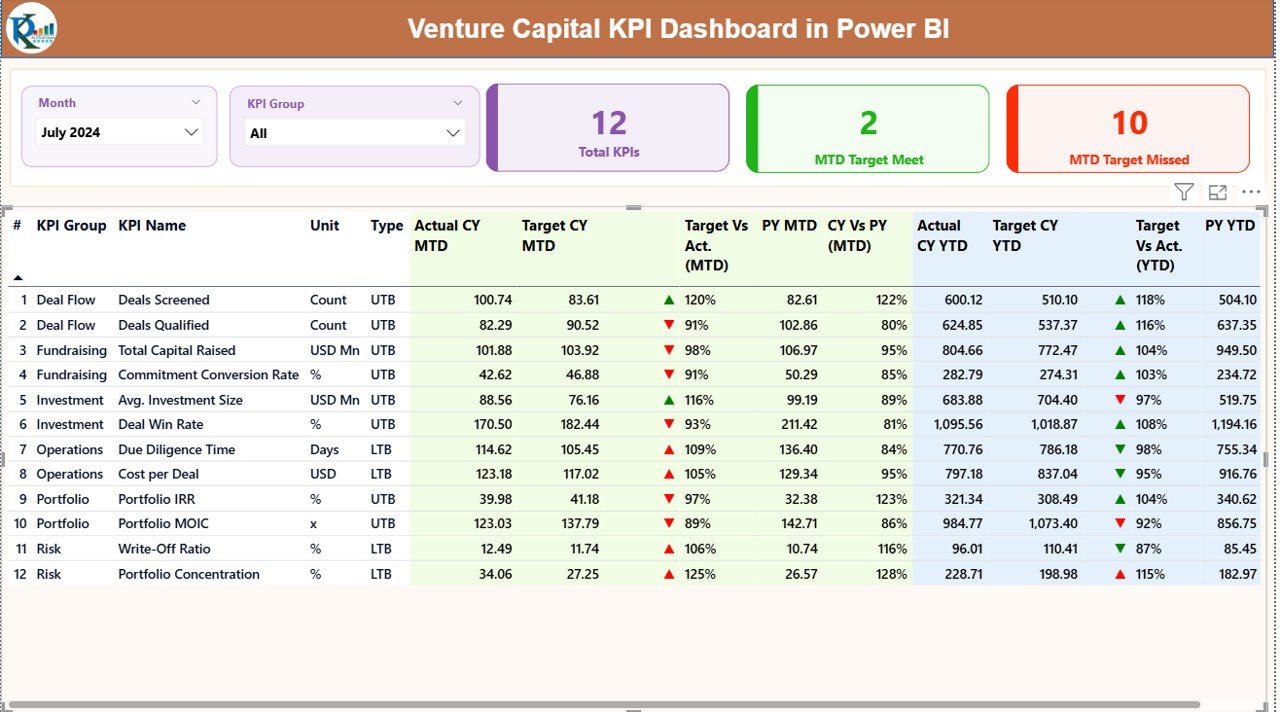
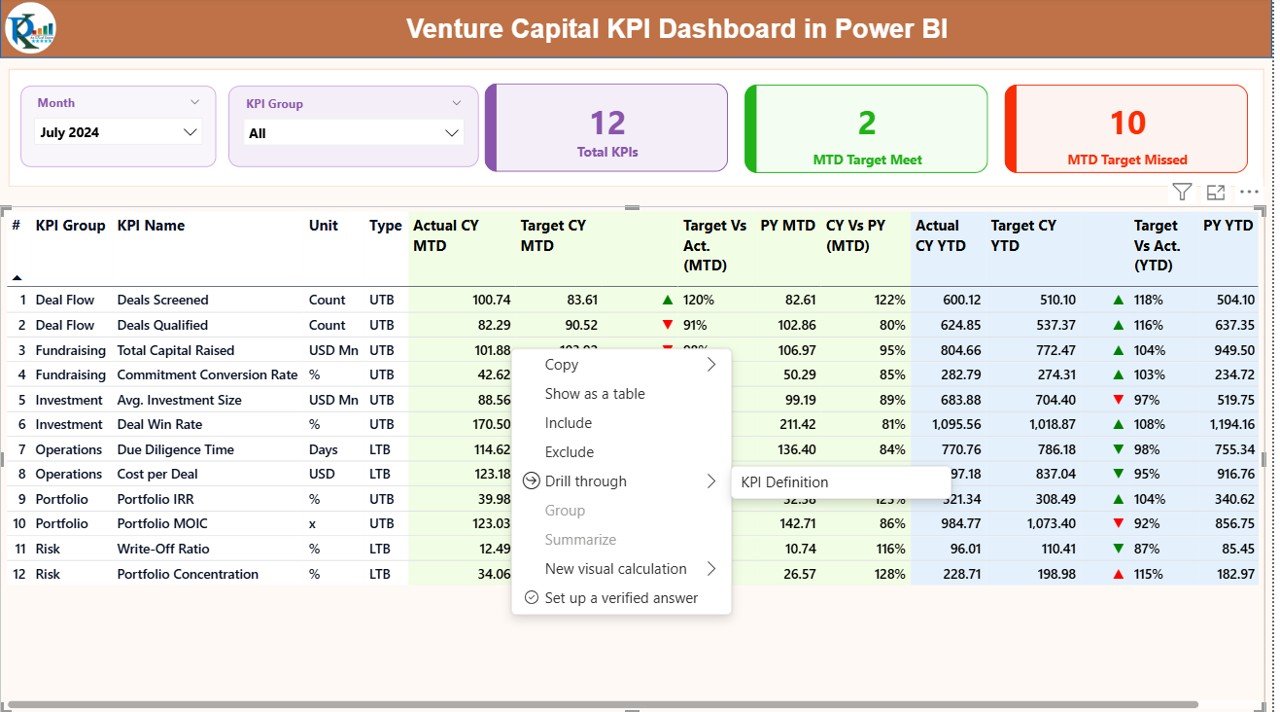
Summary Page: How Does the Summary Page Work?
The Summary Page acts as the main control panel of the dashboard. Therefore, it delivers a complete KPI overview at a glance.
Key Features of the Summary Page
- Month Slicer: Select any month easily
- KPI Group Slicer: Filter KPIs by category
- Three KPI Cards:
- Total KPI Count
- MTD Target Meet Count
- MTD Target Missed Count
- These cards instantly communicate overall performance.
Detailed KPI Table on the Summary Page
Below the cards, a detailed KPI table provides deep performance insights.
Columns Explained Clearly
- KPI Number: Sequential identifier of KPIs
- KPI Group: Category or business area of the KPI
- KPI Name: Name of the performance indicator
- Unit: Measurement unit (%, USD, Count, etc.)
- Type:
- LTB (Lower the Better)
- UTB (Upper the Better)
- MTD Performance Fields
- Actual CY MTD: Current Year actual MTD value
- Target CY MTD: Current Year target MTD value
- MTD Icon:
- ▲ Green arrow for target met
- ▼ Red arrow for target missed
- Target vs Actual (MTD):
- Formula: Actual MTD / Target MTD
- PY MTD: Previous Year MTD value
- CY vs PY (MTD):
- Formula: CY MTD / PY MTD
YTD Performance Fields
- Actual CY YTD: Current Year actual YTD value
- Target CY YTD: Current Year target YTD value
- YTD Icon: Visual status indicator
- Target vs Actual (YTD):
- Formula: Actual YTD / Target YTD
- PY YTD: Previous Year YTD value
- CY vs PY (YTD):
- Formula: CY YTD / PY YTD
Because of this structure, users instantly identify trends and gaps.
Click to buy Venture Capital KPI Dashboard in Power BI
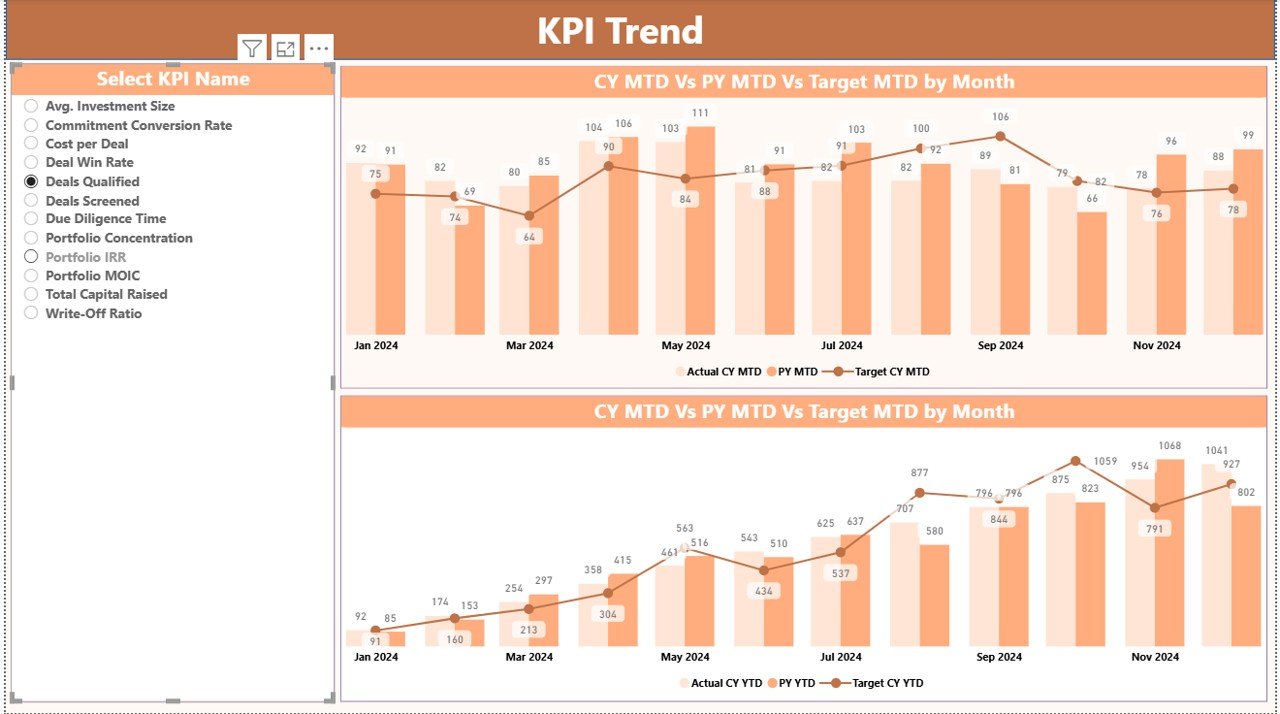
KPI Trend Page: How Can You Analyze Trends?
The KPI Trend Page focuses on performance over time. Therefore, it supports deep trend analysis for any selected KPI.
Key Highlights of the KPI Trend Page
- Two combo charts:
- MTD Trend
- YTD Trend
- Comparison of:
- Current Year Actual
- Previous Year Actual
- Target Values
- KPI Name Slicer on the left
As a result, users analyze historical performance quickly.
Click to buy Venture Capital KPI Dashboard in Power BI
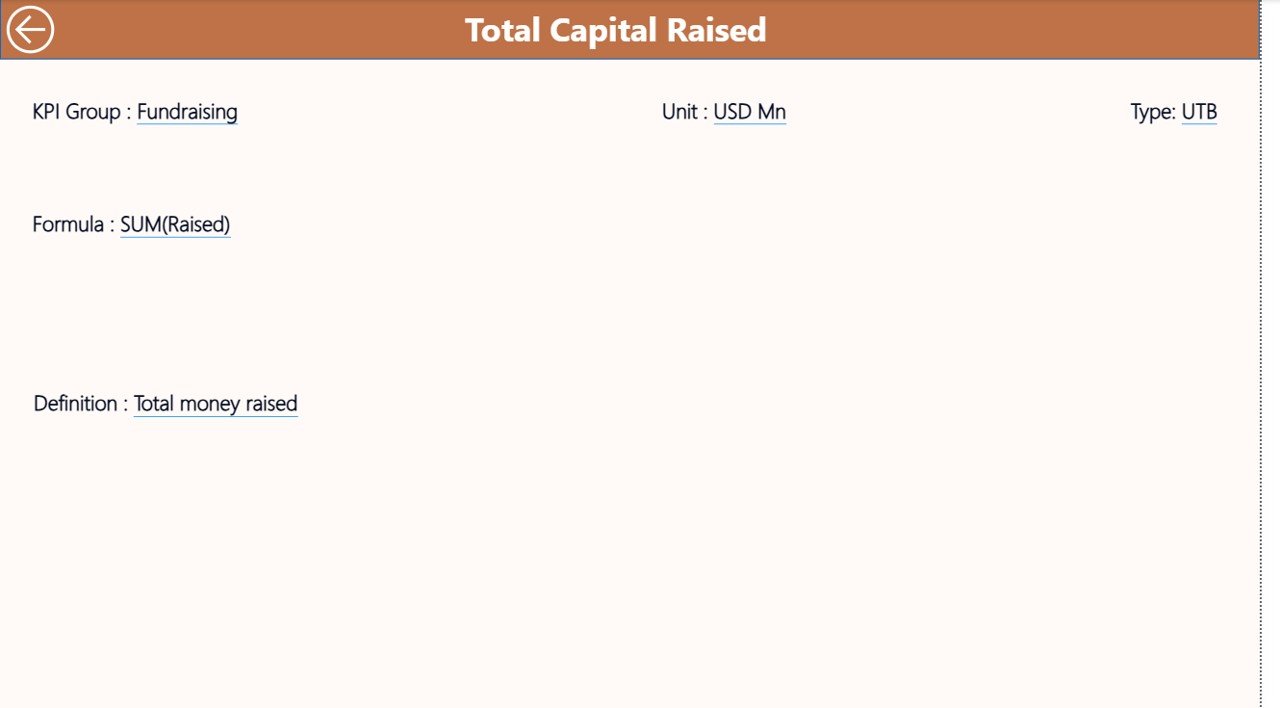
KPI Definition Page: Why Is This Page Important?
The KPI Definition Page explains every KPI clearly. Although it remains hidden, users can access it through drill-through.
What Does This Page Include?
- KPI Number
- KPI Group
- KPI Name
- Unit
- Formula
- Clear KPI definition
- KPI Type (LTB or UTB)
To return, users click the Back button on the top left corner.
This feature ensures transparency and avoids confusion during decision-making.
Click to buy Venture Capital KPI Dashboard in Power BI
How Does the Excel Data Structure Work?
The dashboard connects to an Excel file with three simple worksheets. Therefore, data entry stays easy and structured.
Input_Actual Sheet
Use this sheet to enter actual performance data.
Mandatory Columns
- KPI Name
- Month (use first date of the month)
- MTD Value
- YTD Value
Input_Target Sheet
Use this sheet to enter target values.
Mandatory Columns
- KPI Name
- Month (first date of the month)
- Target MTD
- Target YTD
KPI Definition Sheet
Use this sheet to define all KPIs.
Mandatory Columns
- KPI Number
- KPI Group
- KPI Name
- Unit
- Formula
- Definition
- Type (LTB or UTB)
Once filled, Power BI refreshes all visuals automatically.
Click to buy Venture Capital KPI Dashboard in Power BI
What Are the Advantages of a Venture Capital KPI Dashboard in Power BI?
Key Advantages Explained
- Centralized Performance View
- Track all KPIs in one dashboard
- Faster Decision-Making
- Instantly detect underperforming areas
- Clear Target Tracking
- Visual indicators simplify comparisons
- Historical Performance Analysis
- CY vs PY trends improve forecasting
- Excel-Driven Flexibility
- Easy updates without technical skills
- Executive-Ready Reporting
- Clean, professional visuals
- Who Should Use This Dashboard?
- This dashboard fits multiple roles perfectly.
- Ideal Users
- Venture Capital Partners
- Investment Analysts
- Fund Managers
- Portfolio Managers
- Finance Teams
- Strategy Teams
Because the interface stays simple, both technical and non-technical users benefit equally.
Best Practices for the Venture Capital KPI Dashboard in Power BI
Follow These Best Practices
- Always use consistent KPI names
- Enter month dates correctly
- Update targets before actuals
- Review KPI definitions regularly
- Avoid overloading KPIs
- Validate data before refresh
- Keep KPI formulas simple
- Use KPI groups logically
By following these practices, you maintain accuracy and reliability.
How Does This Dashboard Improve Investment Strategy?
This dashboard supports strategy in several ways.
- It highlights early risks
- It improves capital allocation
- It supports performance benchmarking
- It strengthens investor reporting
- It enhances portfolio reviews
Because insights remain up-to-date, leadership responds confidently.
Conclusion: Why Choose a Venture Capital KPI Dashboard in Power BI?
A Venture Capital KPI Dashboard in Power BI transforms how VC firms monitor performance. Instead of relying on disconnected reports, teams gain a centralized, visual, and data-driven system.
This dashboard simplifies KPI tracking, improves trend analysis, and supports faster decisions. Moreover, Excel-based inputs keep adoption easy, while Power BI visuals deliver professional insights.
If you want better visibility, accountability, and performance control, this dashboard becomes an essential tool.
Frequently Asked Questions (FAQs)
- What is a Venture Capital KPI Dashboard in Power BI?
A Venture Capital KPI Dashboard in Power BI visually tracks venture capital KPIs using Excel data and interactive Power BI reports.
- Do I need advanced Power BI skills to use it?
No. You only need basic Excel knowledge. Power BI handles all calculations and visuals.
- Can I customize KPIs in the dashboard?
Yes. You can easily add, modify, or remove KPIs by updating the Excel KPI Definition sheet.
- How often should I update the data?
You should update data monthly. However, you can update it more frequently if required.
- Does this dashboard support comparison with previous years?
- Yes. It includes Current Year vs Previous Year comparisons for both MTD and YTD.
- Can this dashboard support multiple KPI groups?
- Yes. The KPI Group slicer allows you to analyze metrics by category.
- Is this dashboard suitable for small VC firms?
Absolutely. Small and large venture capital firms benefit equally from this dashboard.
Visit our YouTube channel to learn step-by-step video tutorials
Watch the step-by-step video tutorial:
Click to buy Venture Capital KPI Dashboard in Power BI