Vertical Farming Dashboard in Power BI is a powerful, ready-to-use analytical solution designed for modern indoor farming businesses. As the vertical farming industry continues to grow rapidly around the world, managing operational costs, crop yield, revenue generation, and profitability across multiple growth systems and countries becomes increasingly challenging. Traditional spreadsheets and manual reports simply cannot keep up with the complexity and speed of decision-making that modern vertical farming requires.
That is exactly why this Power BI dashboard is built to bring all your critical vertical farming metrics into one centralized, interactive, and professional reporting system. Whether you run a single indoor farm or manage operations across multiple locations, this dashboard provides the visibility and clarity you need to make faster, smarter, and data-driven business decisions. If you are looking for a practical way to monitor crop performance, compare growth systems, track costs, and analyze profitability trends, this dashboard is the perfect tool for your business.
Key Features of Vertical Farming Dashboard in Power BI
This dashboard is packed with features that make vertical farming analytics simple, clear, and actionable. Here are the highlights that set this product apart from basic spreadsheets and generic reporting tools:
- 5 Interactive Dashboard Pages – The product includes five fully designed analytical pages: Overview, Crop Type Analysis, Country Analysis, Growth System Analysis, and Monthly Trends.
- High-Level KPI Cards – The overview page displays Operational Cost, Total Revenue, Profit, Yield (Kg), and Avg Temperature (Celsius) instantly.
- Dynamic Slicers and Filters – Apply filters to explore data by crop type, country, growth system, energy source, and month for targeted analysis.
- Professional Visual Charts – Turn complex farming data into clear and easy-to-understand visuals for team meetings and stakeholder presentations.
- Ready-to-Use Power BI Template – Simply connect your data and the entire dashboard updates automatically with fresh insights.
- Country and Growth System Comparisons – Identify top-performing regions and farming technologies to optimize your strategy.
- Monthly Trend Monitoring – Track changes in revenue, costs, and profit margins over time to support seasonal planning.
Dashboard Pages Explanation
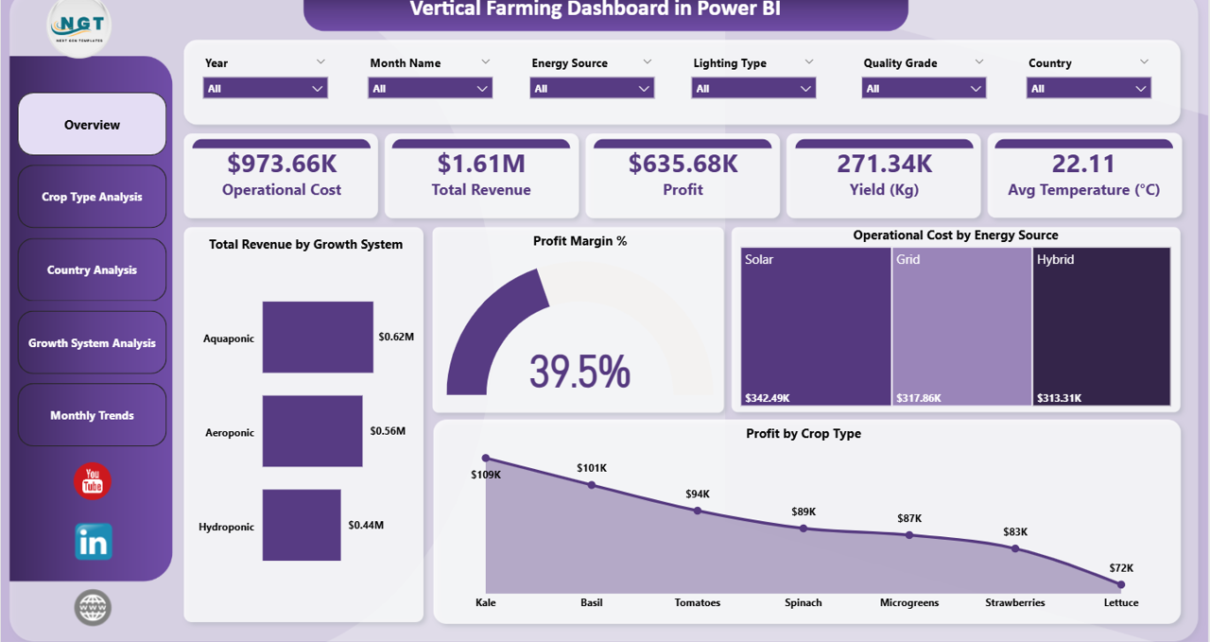
1. Overview Page
The Overview Page serves as the main entry point of the dashboard. It provides a high-level snapshot of your entire vertical farming operation. At the top, you will find KPI cards displaying Operational Cost, Total Revenue, Profit, Yield (Kg), and Avg Temperature (Celsius). These KPIs help you quickly understand the financial and operational health of your business at a glance.
Below the KPI cards, the page includes visual charts that show Total Revenue by Growth System, Profit Margin Percentage, Operational Cost by Energy Source, and Profit by Crop Type. These charts work together to give you a complete picture of where your revenue comes from, how your costs are distributed, and which crop types contribute the most to your profit. Multiple slicers are also available on this page to filter the entire dashboard by specific criteria.
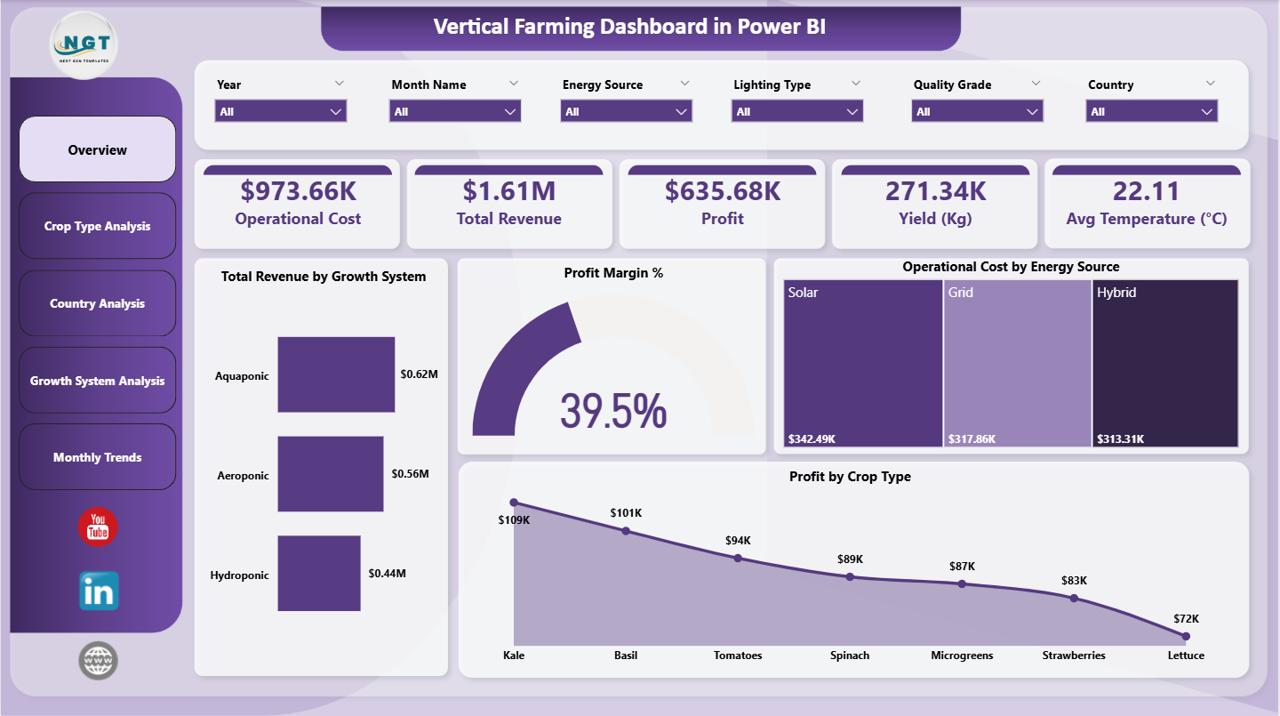
Vertical Farming Dashboard in Power BI
2. Crop Type Analysis
The Crop Type Analysis page dives deep into the performance of individual crop categories within your vertical farming operation. This page provides three key analytical views: Total Revenue by Crop Type, Operational Cost by Crop Type, and Profit Margin Percentage by Crop Type.
By comparing these metrics side by side, farm managers can quickly identify which crops are generating the highest revenue, which ones are the most cost-efficient, and which crop types deliver the strongest profit margins. This level of insight is essential for making informed decisions about crop mix optimization, resource allocation, and long-term production planning.
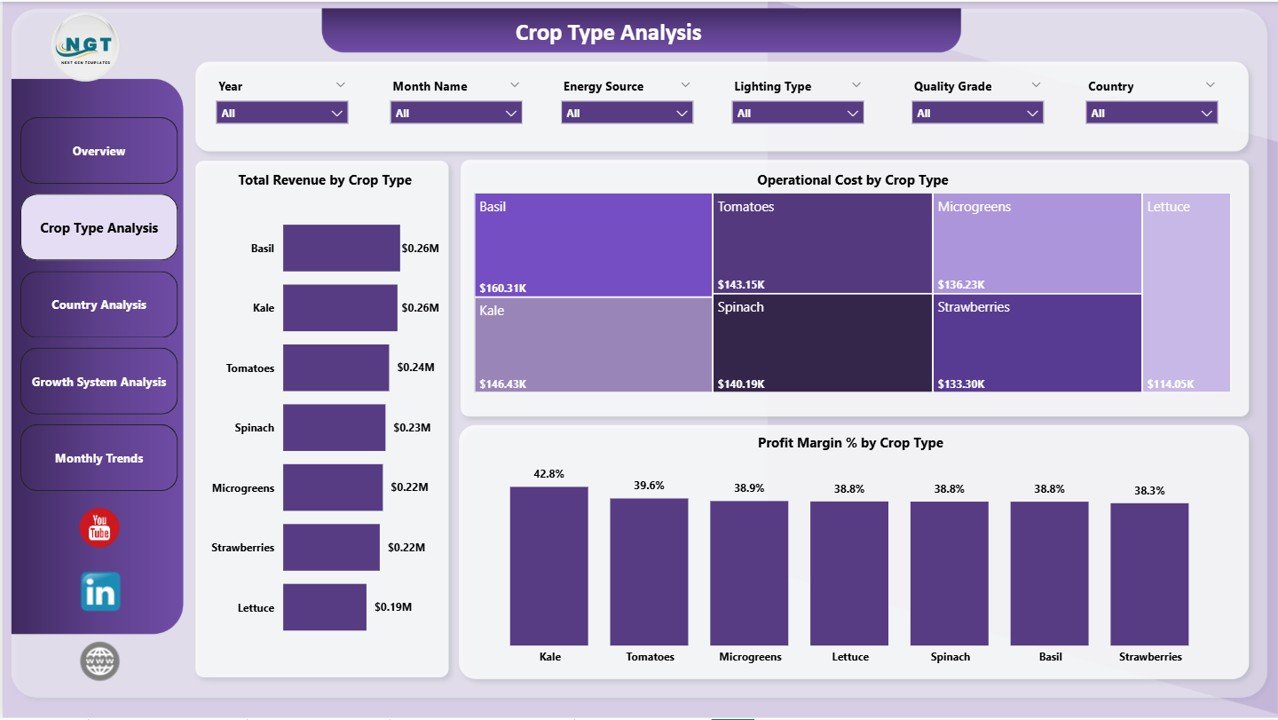
Crop Type Analysis
3. Country Analysis
The Country Analysis page provides geographic performance insights for farms operating across multiple countries. This page includes charts for Total Revenue by Country, Avg Temperature (Celsius) by Country, and Profit by Country.
This analysis helps managers compare how different locations perform financially and environmentally. Understanding temperature variations by country can also help in planning which crops to grow in specific regions, while revenue and profit comparisons help identify the most productive and profitable markets for expansion.
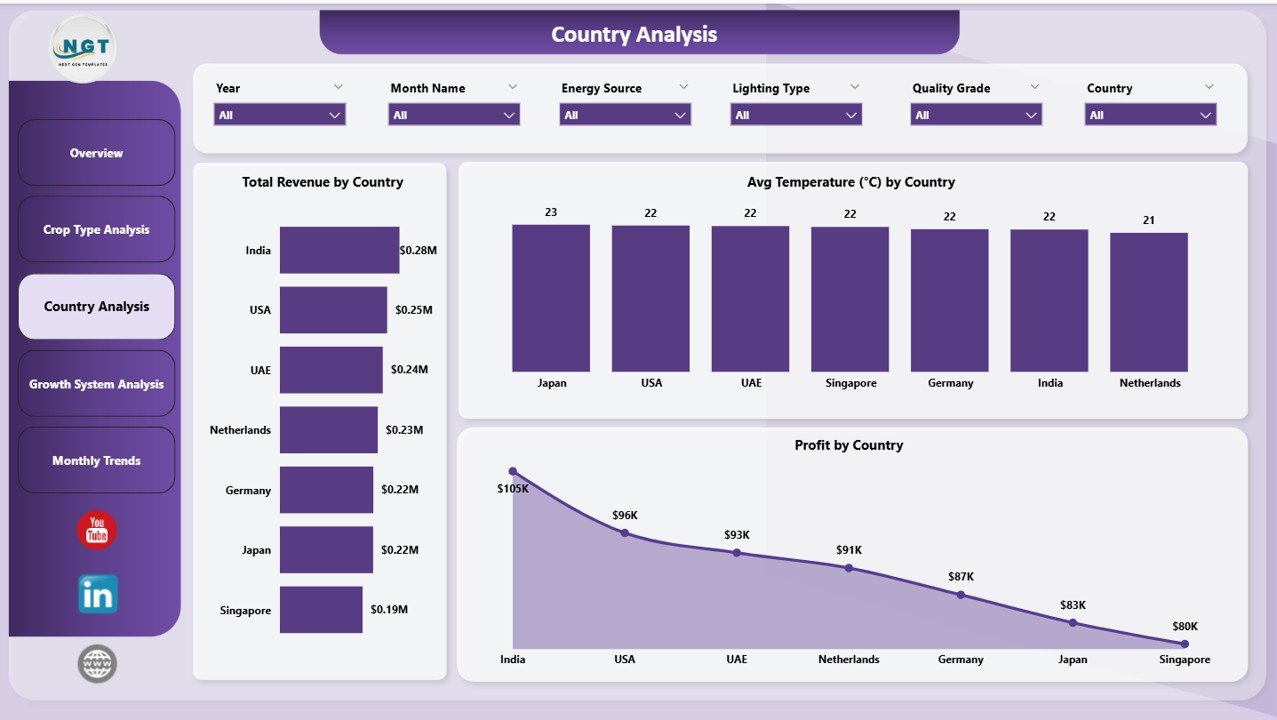
Country Analysis
4. Growth System Analysis
The Growth System Analysis page evaluates the performance of different farming technologies used in your vertical farm. This page provides charts for Profit Margin Percentage by Growth System, Yield (Kg) by Growth System, and Operational Cost by Growth System.
Vertical farms often use multiple growth systems such as hydroponics, aeroponics, and aquaponics. By comparing profit margins, yield output, and operational costs across these systems, managers can determine which technology delivers the best return on investment and make informed decisions about scaling specific systems. You can also explore similar farming dashboards like the Aquaponics Dashboard in Power BI for related agricultural analytics.
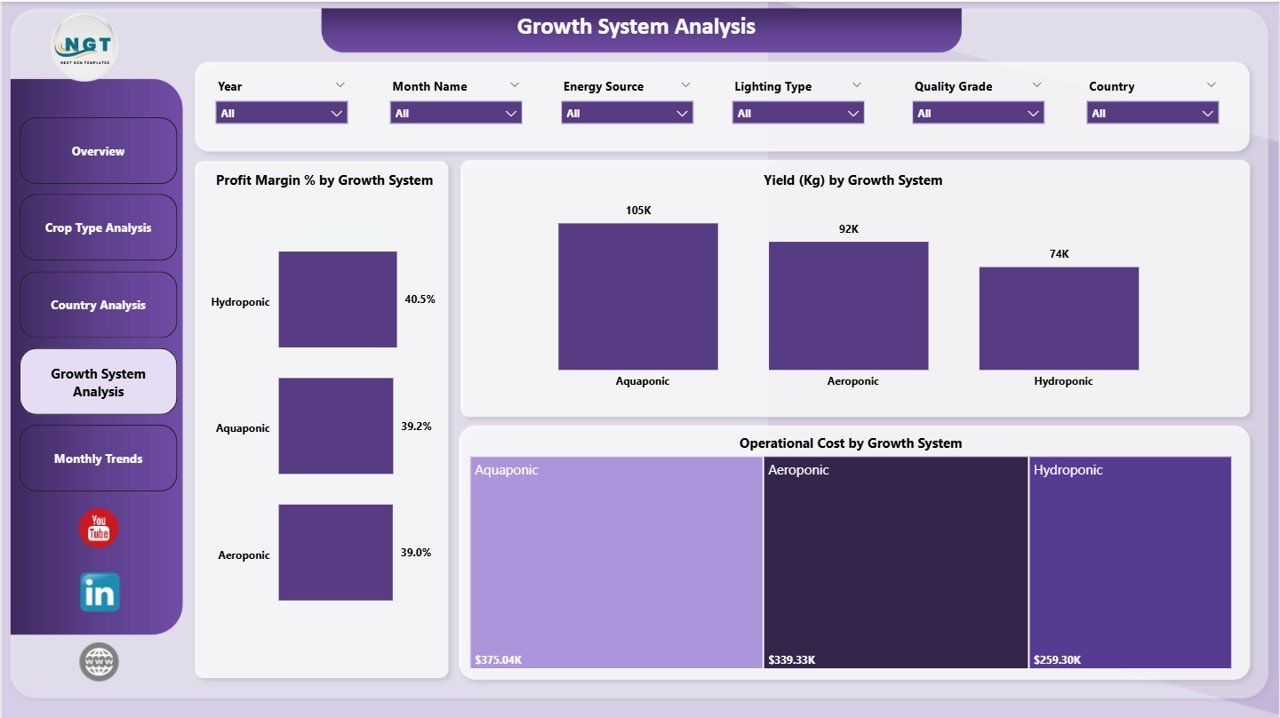
Growth System Analysis
5. Monthly Trends
The Monthly Trends page tracks time-based performance patterns across your vertical farming operations. This page includes charts for Profit Margin Percentage by Month Name, Operational Cost by Month Name, and Total Revenue by Month Name.
By analyzing monthly trends, farm managers can identify seasonal patterns in revenue generation, detect periods of rising operational costs, and understand how profit margins fluctuate throughout the year. This information is invaluable for budgeting, forecasting, and strategic planning purposes.
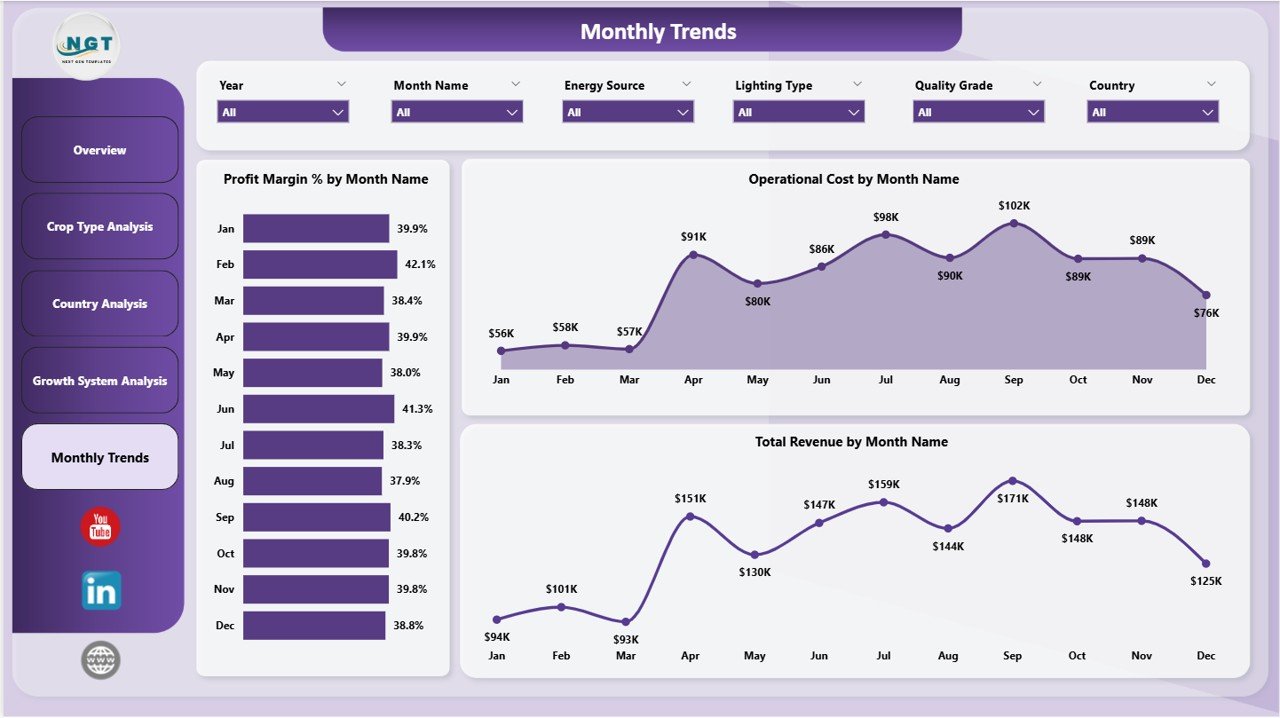
Monthly Trends
Advantages of Vertical Farming Dashboard in Power BI
- Centralized Data View – All critical metrics in one place instead of scattered across multiple files.
- Interactive Filtering – Slicers let you drill down into specific crops, countries, and systems instantly.
- Time-Saving – Eliminates manual reporting and provides automatic visual updates when data refreshes.
- Better Decision-Making – Clear visuals help identify trends, issues, and opportunities quickly.
- Professional Presentation – Dashboard-quality reports suitable for team meetings and investor reviews.
- Scalable Solution – Works equally well for single-location farms and multi-country operations.
Opportunities for Improvement
- Adding sensor integration for real-time temperature and humidity data feeds would further enhance the monitoring capabilities.
- Including predictive analytics models could help forecast future crop yields and revenue based on historical trends.
- Adding labor cost tracking alongside operational costs would provide a more complete financial picture.
- Incorporating crop growth cycle duration metrics could help optimize harvest scheduling and production planning.
Best Practices
- Update your source data regularly to keep the dashboard insights current and actionable.
- Use the slicers strategically to focus on specific areas before team meetings or reviews.
- Compare growth system performance quarterly to identify optimization opportunities.
- Track monthly trends over at least 12 months to understand full seasonal cycles.
- Share the dashboard with team leads and stakeholders to promote data-driven decision-making across the organization.
- Visit Microsoft Power BI documentation for tips on advanced data modeling and visualization techniques.
Explore Relevant Templates
If you found this vertical farming dashboard useful, you may also be interested in these related templates available on our store:
- Aquaponics Dashboard in Power BI – Track aquaponics production, sustainability, and financial performance.
- Aquaculture Dashboard in Power BI – Monitor fish farm production, species performance, and environmental health.
- Aquaponics Dashboard in Excel – Excel-based aquaponics analytics with interactive charts and KPIs.
- Farm Production and Profitability Dashboard in Google Sheets – Track farm production across crops, regions, and seasons.
- Aquaculture Dashboard in Excel – Excel dashboard for aquaculture production monitoring and analysis.
Frequently Asked Questions
What is the Vertical Farming Dashboard in Power BI?
It is a ready-to-use Power BI dashboard template designed to help vertical farming businesses track operational costs, revenue, profit, yield, and temperature metrics across five interactive analysis pages.
Do I need advanced Power BI skills to use this dashboard?
No, this dashboard is designed to be user-friendly. You simply need to connect or import your farming data, and the charts and KPIs update automatically.
Can I customize the dashboard for my specific farm?
Yes, the Power BI file is fully editable. You can modify chart types, add new metrics, change colors, and adjust filters to match your specific operational needs.
What type of data do I need to use this dashboard?
You need data related to crop types, growth systems, energy sources, countries, revenue, operational costs, yield measurements, and temperature readings. The dashboard works best with structured tabular data.
Is this dashboard suitable for multi-location vertical farming operations?
Yes, the Country Analysis page is specifically designed for comparing performance across multiple geographic locations, making it ideal for multi-country or multi-site operations.
Can I use this dashboard for investor presentations?
Yes, the professional visual design and comprehensive analytics make it suitable for investor presentations, team meetings, and stakeholder reviews.
Conclusion
The Vertical Farming Dashboard in Power BI is a comprehensive and practical analytics tool that helps vertical farming businesses monitor, analyze, and optimize their operations with clarity and confidence. With five interactive pages covering overview metrics, crop analysis, country comparisons, growth system evaluation, and monthly trends, this dashboard transforms complex farming data into actionable insights.
Whether you are a farm owner, operations manager, agricultural consultant, or AgriTech startup, this dashboard equips you with the visual intelligence you need to improve productivity, reduce costs, and increase profitability. Stop relying on scattered spreadsheets and start making smarter farming decisions today.
Click here to Purchase Vertical Farming Dashboard in Power BI
Visit our YouTube channel for step-by-step video tutorials: