Veterinary Clinic Dashboard in Excel is a comprehensive, pivot-driven analytics dashboard designed specifically for veterinary clinics, animal hospitals, and pet care centers. This ready-to-use Excel template provides 5 interactive dashboard pages, a structured data sheet, and a support sheet with pivot tables that power every chart automatically. If you want to track revenue, monitor patient trends, evaluate veterinarian performance, and analyze treatment patterns — this dashboard delivers all of that in a single Excel file.
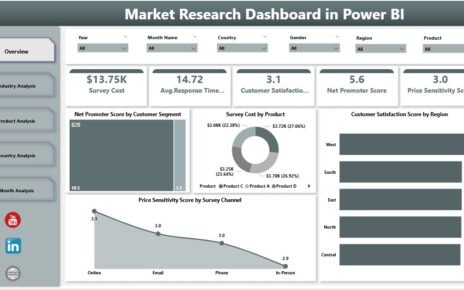
Modern veterinary practices handle hundreds of patient records, multiple veterinarians, various treatment types, and diverse revenue streams. Without a centralized reporting tool, clinic managers often rely on scattered spreadsheets or manual summaries. The Veterinary Clinic Dashboard in Excel solves this by bringing all your clinic data into one place with visual charts, KPI cards, and slicer filters that let you slice through data effortlessly.
Key Features of Veterinary Clinic Dashboard in Excel
This Excel dashboard template stands out with its combination of visual analytics and ease of use. Here are the key features that make it a powerful tool for veterinary professionals:
- 5 Interactive Dashboard Pages — Overview, Patient Analysis, Treatment Insights, Vet Performance, and Revenue Breakdown give you a complete 360-degree view of clinic operations.
- KPI Summary Cards — The Overview page displays 5 critical metrics at a glance: Total Revenue, Total Records, Avg. Satisfaction, Visits Completed, and Avg. Bill Per Visit.
- Pivot-Driven Dynamic Charts — Every chart in this dashboard is powered by pivot tables in the Support Sheet, so a single Refresh All updates the entire dashboard.
- Built-in Slicer Filters — Filter your dashboard by month, department, pet type, veterinarian, visit type, and more to drill into specific segments instantly.
- No Macros Required — This is a pure Excel dashboard using pivot tables, charts, and formulas. No VBA or macros needed — it works right out of the box.
- Fully Customizable — Add new data columns, modify pivot fields, or create additional charts to tailor the dashboard to your clinic’s unique requirements.
For those looking for a KPI-focused approach with MTD/YTD target tracking, the Veterinary Clinic KPI Scorecard in Excel is an excellent complementary template.
Dashboard Pages Explained
1. Overview Page
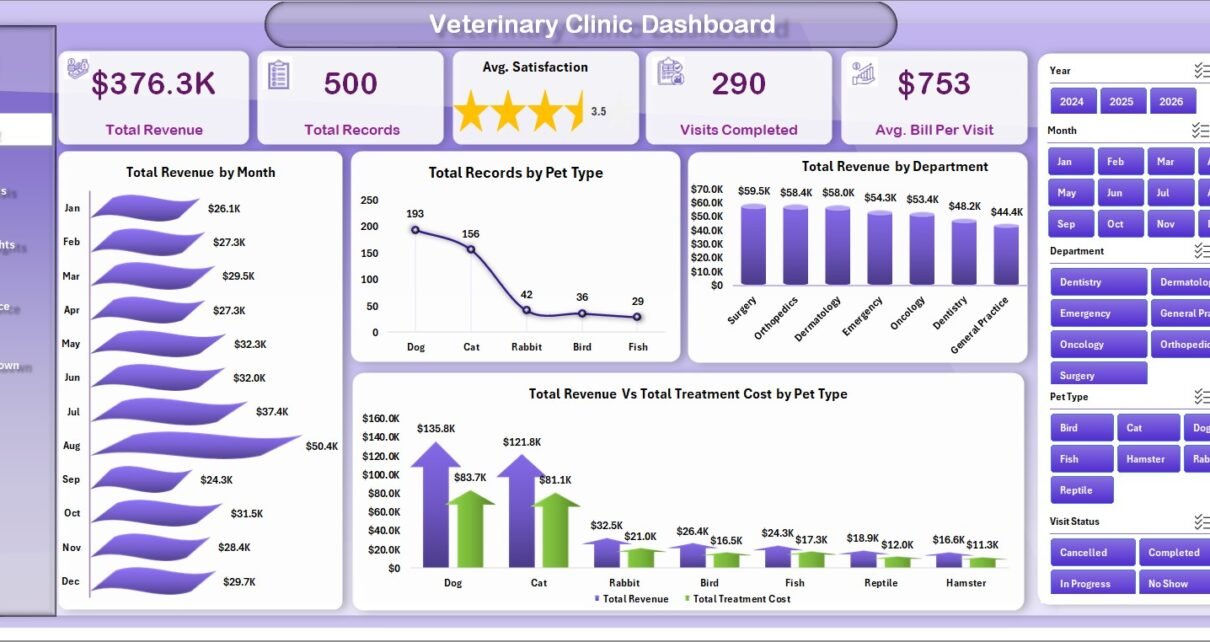
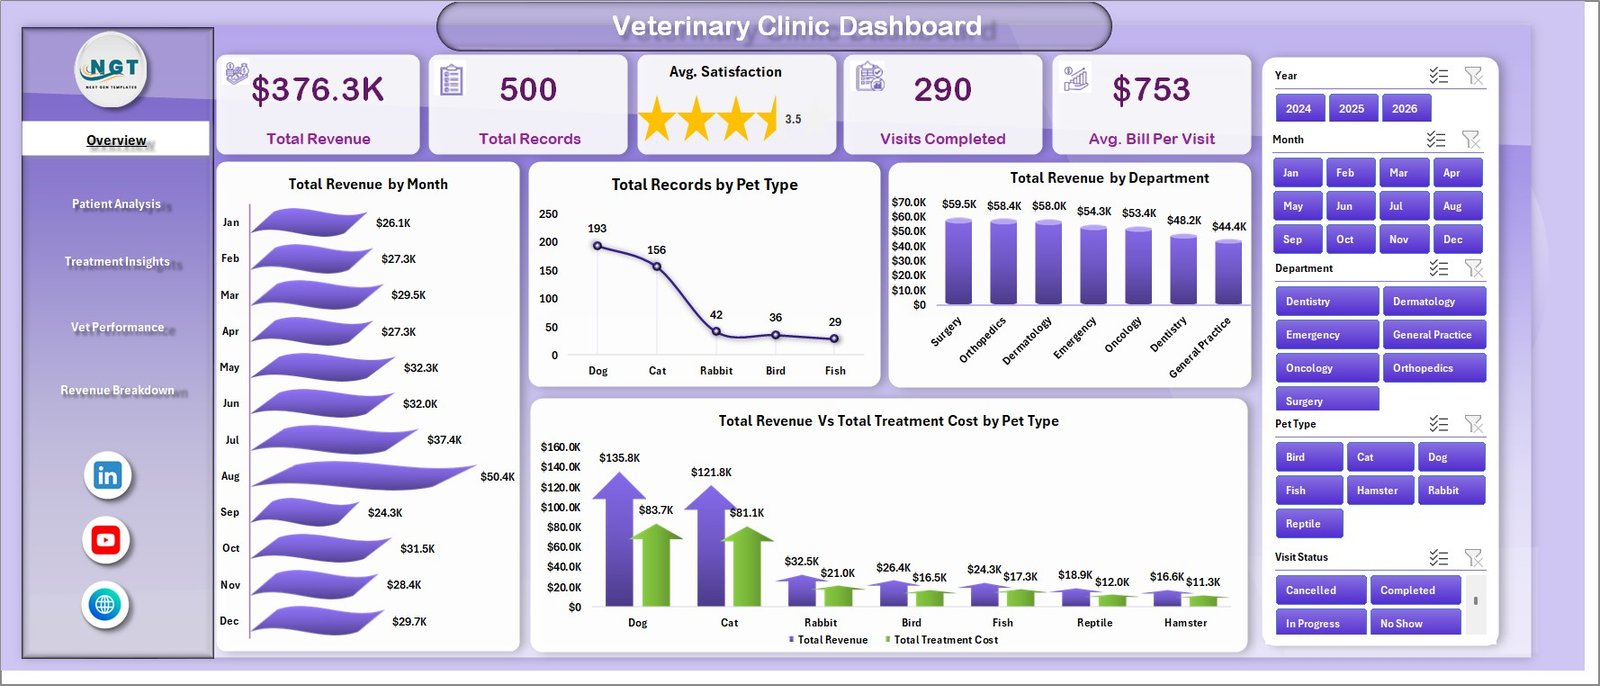
The Overview page serves as the main control center of the Veterinary Clinic Dashboard. At the top, you will find 5 KPI summary cards displaying Total Revenue, Total Records, Avg. Satisfaction, Visits Completed, and Avg. Bill Per Visit. These cards give you an instant snapshot of your clinic’s overall health.
Below the cards, the page features 4 analytical charts: Total Revenue by Month shows monthly revenue trends to identify seasonal patterns. Total Records by Pet Type reveals which animal categories drive the most patient visits. Total Revenue by Department breaks down earnings across different clinic departments. Total Revenue Vs Total Treatment Cost by Pet Type compares revenue against treatment costs to help identify profitable pet categories.
Multiple slicers on this page allow you to filter the entire dashboard by month, department, pet type, and other dimensions for quick, targeted analysis.
Veterinary Clinic Dashboard2. Patient Analysis
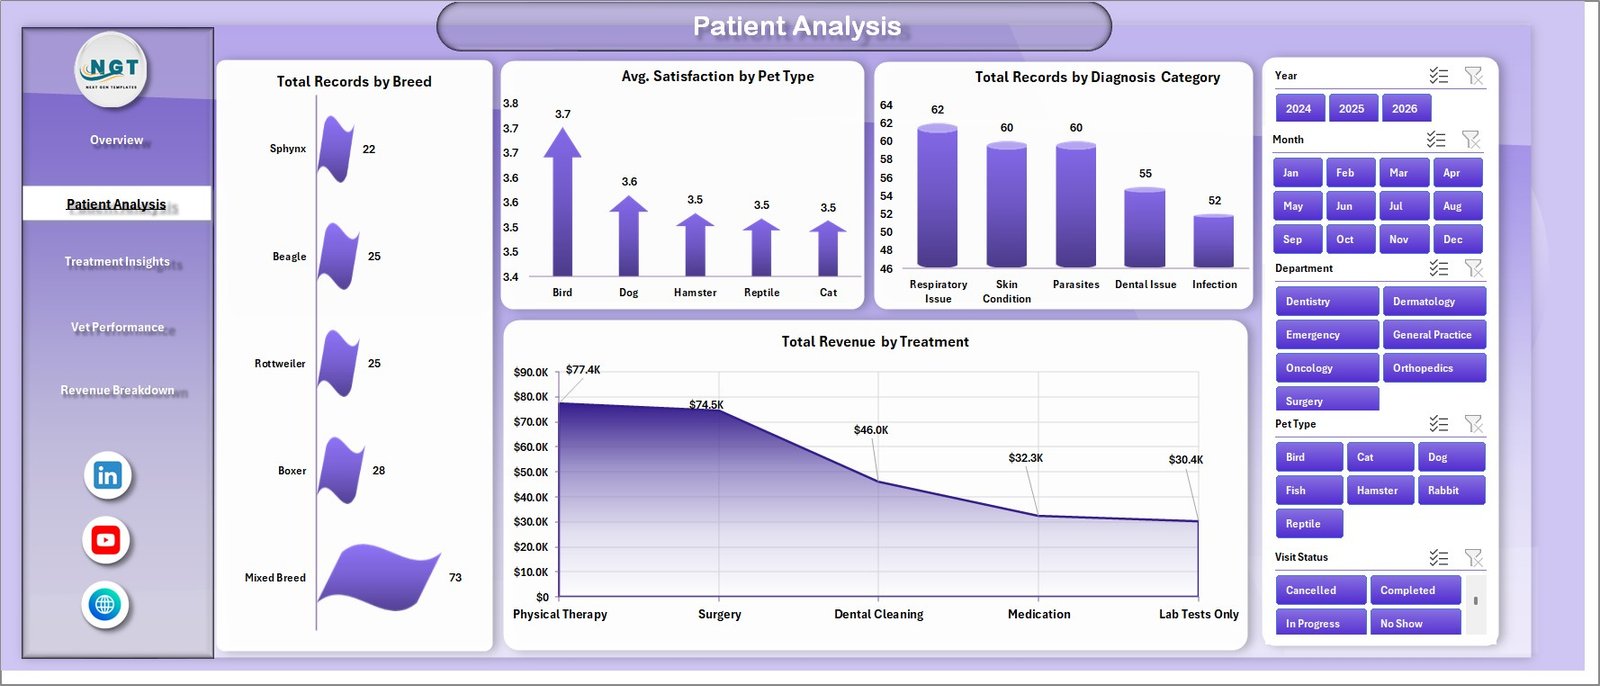
The Patient Analysis page provides a deep dive into patient demographics and satisfaction metrics. This page includes 4 charts: Total Records by Breed helps you understand which breeds visit your clinic most frequently. Avg. Satisfaction by Pet Type reveals satisfaction trends across different animal categories. Total Records by Diagnostic Category shows the distribution of diagnoses to help with resource planning. Total Revenue by Treatment identifies which treatment types generate the most revenue.
This page is especially valuable for clinic managers who want to optimize staffing and supply chain decisions based on patient volume patterns.
 Patient Analysis
3. Treatment Insights
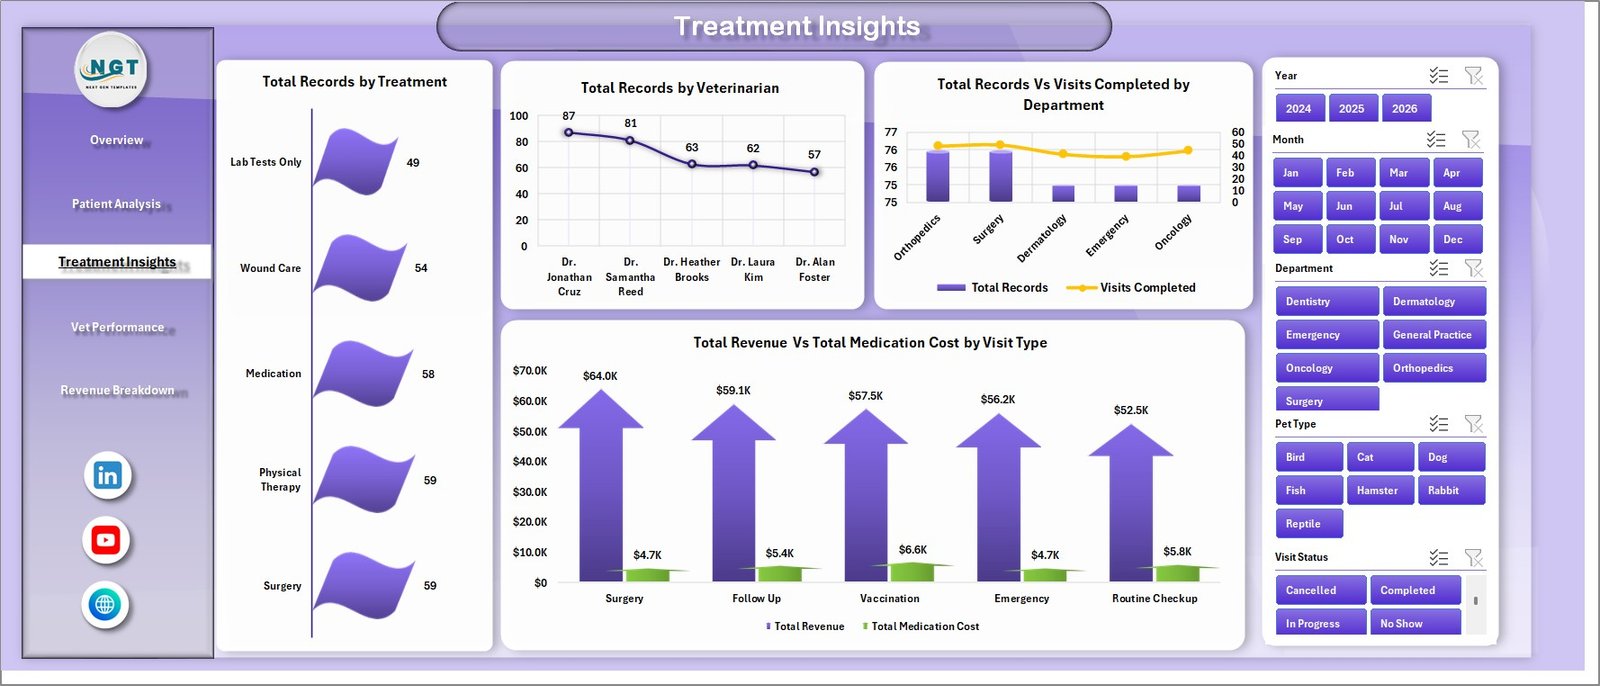
The Treatment Insights page focuses on the operational side of clinical care. It features 4 charts: Total Records by Treatment shows the volume of each treatment type performed. Total Records by Veterinarian highlights workload distribution across your vet team. Total Records Vs Visits Completed by Department compares scheduled versus completed appointments to spot drop-off issues. Total Revenue Vs Total Medication Cost by Visit Type compares revenue against medication expenses for different visit categories.
This analysis helps identify treatment bottlenecks, over-utilized departments, and cost-heavy visit types that need attention.
 Treatment Insights
4. Vet Performance
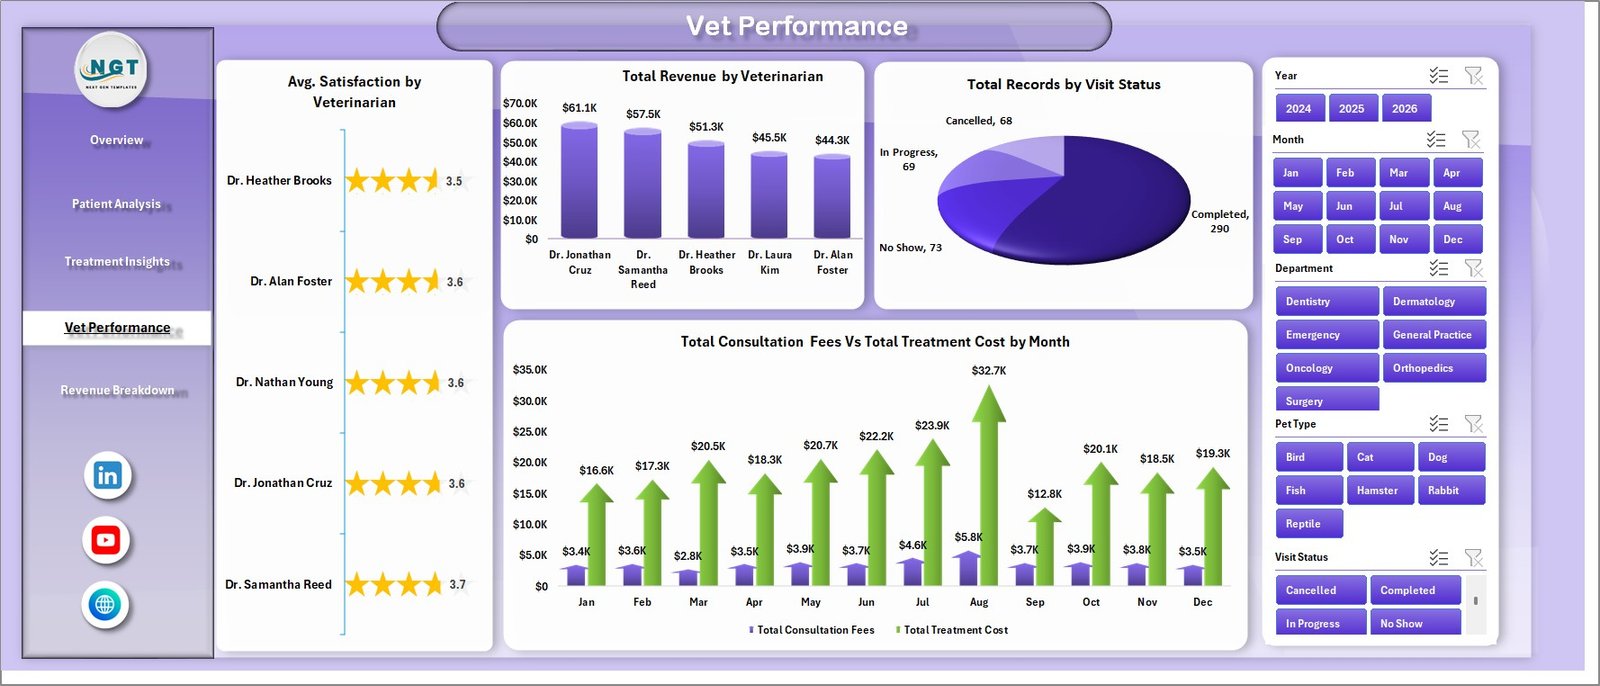
The Vet Performance page evaluates your veterinary team across multiple dimensions. This page includes 4 charts: Avg. Satisfaction by Veterinarian shows client satisfaction ratings for each vet. Total Revenue by Veterinarian highlights each vet’s revenue contribution. Total Records by Visit Status tracks the ratio of completed, pending, and cancelled visits. Total Consultation Fees Vs Total Treatment Cost by Month reveals monthly profitability trends.
Clinic owners and practice managers can use this page to reward high performers, identify training needs, and balance caseloads across the team.
 Vet Performance
5. Revenue Breakdown
The Revenue Breakdown page delivers financial clarity for your veterinary practice. It includes 3 analytical charts: Total Revenue by Payment Method shows how clients prefer to pay — cash, card, insurance, or digital wallets. Total Revenue by Year enables year-over-year revenue comparison to track growth. Avg. Bill Per Visit by Pet Type helps you understand pricing efficiency across different animal categories.
This page is essential for financial planning, pricing strategy adjustments, and understanding payment preferences to offer better checkout experiences.
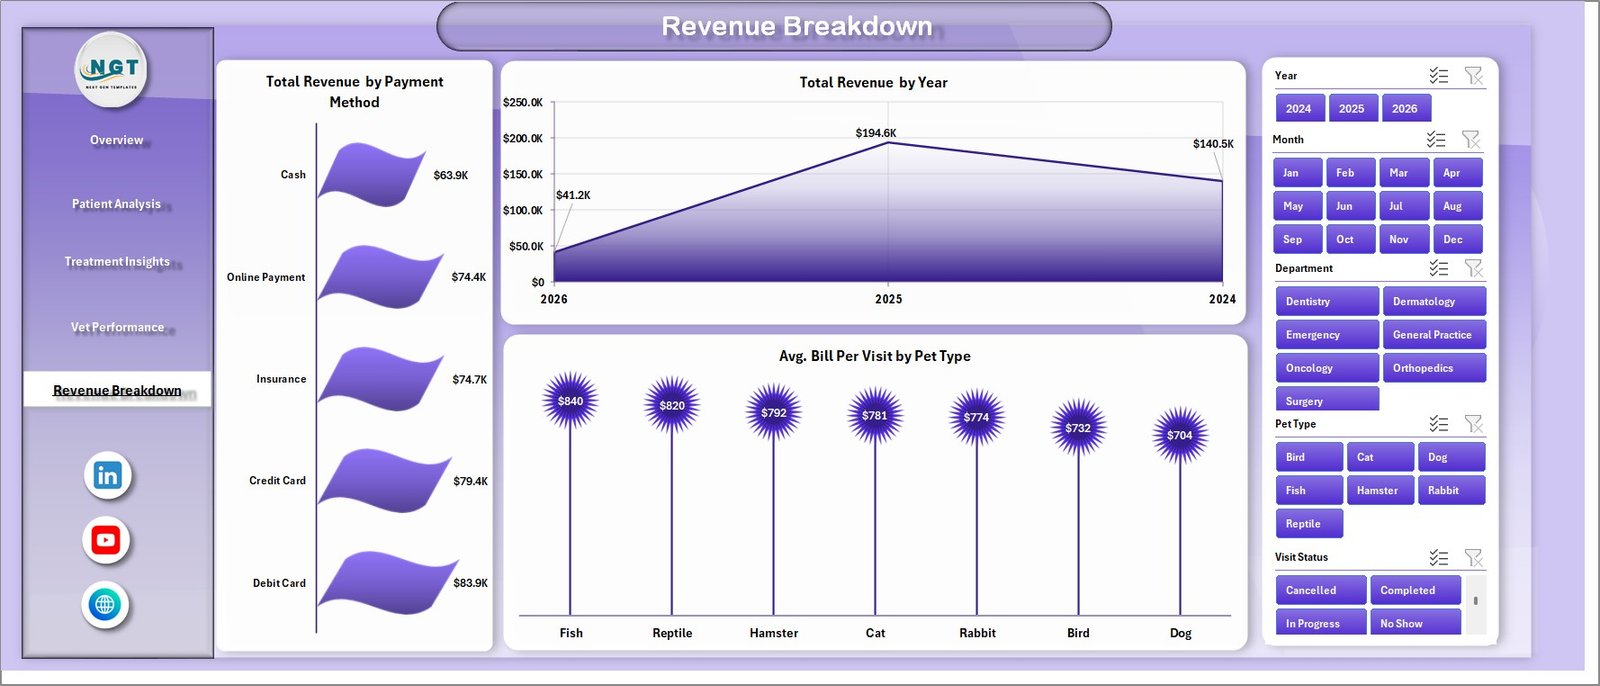 Revenue Breakdown
6. Data Sheet
The Data Sheet is where you enter all your clinic records. The data is organized in a structured tabular format with columns for patient information, pet details, treatment types, veterinarian names, revenue, costs, satisfaction scores, and more. Simply replace the sample data with your own records while keeping the column structure intact.
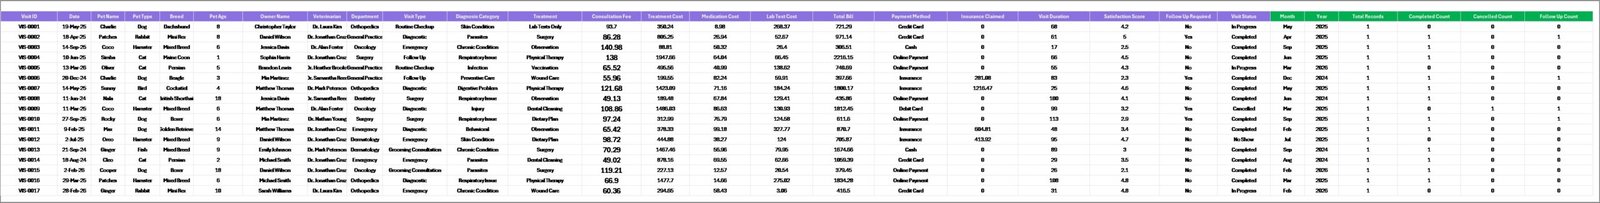 Data Sheet Tab
7. Support Sheet
The Support Sheet contains all the pivot tables that power the dashboard charts and KPI cards. You do not need to edit this sheet manually. After updating your data in the Data Sheet, simply go to the Data tab in the Excel Ribbon and click Refresh All — every pivot table and chart across all pages will update automatically. You can keep this sheet hidden for a cleaner workbook experience.
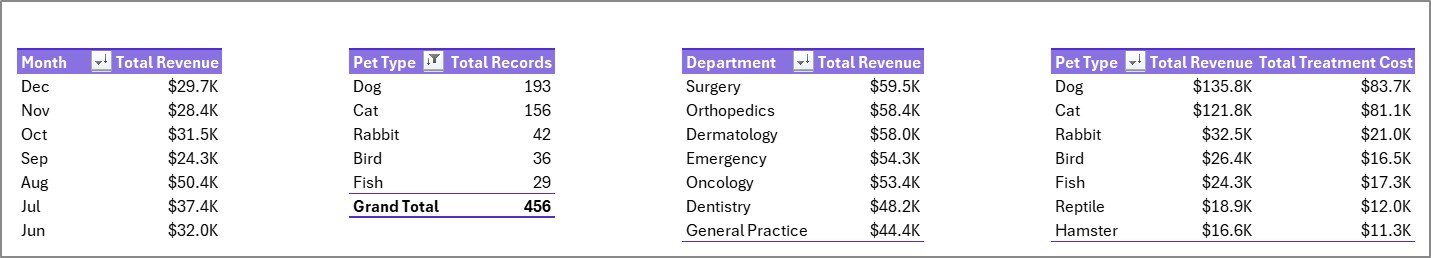 Support Sheet Tab
Advantages of Veterinary Clinic Dashboard in Excel
This dashboard offers several advantages over manual reporting or expensive BI software:
- Instant Visual Insights — Replace hours of manual data analysis with interactive charts that tell the story at a glance.
- Cost-Effective — No subscription fees or additional software. Works entirely inside Microsoft Excel.
- Time-Saving — Enter data once, click Refresh All, and your entire dashboard updates across all 5 pages.
- Data-Driven Decision Making — Identify which treatments are most profitable, which vets are top performers, and which pet categories drive revenue.
- Scalable — Works for small clinics with one vet or large animal hospitals with multiple departments and locations.
Opportunities for Improvement
- Adding appointment scheduling and wait time tracking columns would enable operational efficiency analysis.
- Including a separate Trend Analysis page showing month-over-month growth rates for key metrics would add strategic depth.
- Integration with inventory data could help track medication stock levels alongside treatment analytics.
Best Practices for Using This Dashboard
- Update your data weekly or monthly for the most accurate analytics.
- Use consistent naming conventions for veterinarians, departments, and pet types to avoid duplicate entries in pivot tables.
- Keep the Data Sheet clean — avoid blank rows or merged cells as they can disrupt pivot table refresh.
- Use the slicer filters to create focused views for team meetings or department reviews.
- Hide the Support Sheet for a cleaner presentation when sharing with stakeholders.
Explore Relevant Templates
If you found the Veterinary Clinic Dashboard useful, explore these related templates from NextGenTemplates:
- Veterinary Clinic KPI Scorecard in Excel — Track monthly and yearly KPI targets with color-coded performance indicators and trend charts.
- Veterinary Services KPI Dashboard in Power BI — Advanced interactive dashboard for Power BI users with drill-through capabilities and Excel data connectivity.
- Veterinary Clinic KPI Dashboard in Google Sheets — Cloud-based KPI tracking with automated formulas, trend analysis, and real-time collaboration.
- Veterinary Clinic KPI Dashboard in Excel — KPI-focused dashboard with MTD/YTD tracking, target comparisons, and performance indicators.
Also check out the related blog posts on our site: Pet Care KPI Scorecard in Excel and Clinics Dashboard in Excel for more healthcare analytics templates.
Frequently Asked Questions
What is the best Excel dashboard for tracking veterinary clinic performance?
The Veterinary Clinic Dashboard in Excel from NextGenTemplates is one of the best options for tracking veterinary clinic performance. It includes 5 interactive pages covering patient analysis, treatment insights, vet performance, and revenue breakdown — all powered by pivot tables that auto-refresh with a single click.
How do I add my own data to this veterinary dashboard?
Go to the Data Sheet tab in the Excel workbook. Replace the sample data with your clinic records while keeping the same column structure. Then navigate to the Data tab in the Excel Ribbon and click Refresh All. Every chart and KPI card across all 5 dashboard pages will update automatically.
Can I track multiple veterinarians in this dashboard?
Yes. The dashboard tracks performance by veterinarian across multiple pages. The Vet Performance page shows satisfaction ratings, revenue contribution, and consultation fees for each veterinarian. The Treatment Insights page also shows records by veterinarian for workload analysis.
Do I need Power BI or any other software to use this template?
No. This dashboard works entirely inside Microsoft Excel. It uses standard pivot tables and charts with no macros or VBA code. Any version of Excel that supports pivot tables and slicers will work perfectly.
How is this different from the Veterinary Clinic KPI Dashboard?
The Veterinary Clinic KPI Dashboard focuses on pre-defined KPI metrics with MTD/YTD target tracking and color-coded indicators. This Veterinary Clinic Dashboard provides broader operational analytics across 5 pages with detailed charts covering patients, treatments, vet performance, and revenue — ideal for day-to-day operational monitoring.
Conclusion
The Veterinary Clinic Dashboard in Excel is a powerful yet easy-to-use analytics tool that transforms your raw clinic data into actionable visual insights. With 5 interactive dashboard pages, dynamic pivot-driven charts, built-in slicer filters, and a one-click refresh workflow, this template empowers veterinary professionals to make data-driven decisions that improve patient care, boost revenue, and optimize team performance.
Click here to Purchase Veterinary Clinic Dashboard in Excel
Visit our YouTube channel to learn step-by-step video tutorials — Youtube.com/@PK-AnExcelExpert