The video game industry grows every year. New technologies, bigger teams, and high user expectations push game studios to deliver better quality and smoother experiences. Because of these demands, every development team must track performance with accuracy. They need to monitor bugs, development time, feature progress, user feedback, testing cycles, design iteration, and real-world performance. That is why many successful studios use a Video Game Development KPI Dashboard in Power BI.
This dashboard gives you a real-time view of your entire development pipeline. It shows the strengths, weaknesses, delays, and achievements of your project. Moreover, it connects design teams, developers, QA testers, and project managers on one platform. In this article, you will explore everything about this dashboard—features, benefits, structure, best practices, and how it transforms the game-development process.
Click to Purchases Video Game Development KPI Dashboard in Power BI
⭐ What Is a Video Game Development KPI Dashboard in Power BI?
A Video Game Development KPI Dashboard in Power BI is a ready-to-use reporting tool specially created for game studios. It tracks key metrics that matter during pre-production, production, testing, and release phases. It highlights how well your team performs, whether you meet targets, and how current performance compares with previous months or years.
This dashboard uses Excel as the data source, which keeps it simple to update. The Power BI file then visualizes and organizes the data into three powerful pages:
-
Summary Page
-
KPI Trend Page
-
KPI Definition Page
Each page helps the entire development team work smarter and faster.
Click to Purchases Video Game Development KPI Dashboard in Power BI
⭐ Why Game Studios Need KPI Dashboards
Developing a game is complex. Teams juggle art creation, code development, testing, story writing, UI design, level building, performance optimization, and release preparation. Because there are so many tasks, it’s easy to lose track of what matters.
A KPI dashboard brings order to this chaos. It helps you:
-
Track development progress
-
Identify performance gaps
-
Compare actual progress with targets
-
Review team productivity
-
Improve timelines
-
Analyze bugs and testing cycles
-
Study user feedback trends
With Power BI, the dashboard becomes even more useful. It provides real-time data, interactive visuals, and advanced comparisons—all without writing code.
Click to Purchases Video Game Development KPI Dashboard in Power BI
⭐ Key Features of the Video Game Development KPI Dashboard
This dashboard includes three well-designed pages, each serving a unique purpose. Let’s explore them one by one.
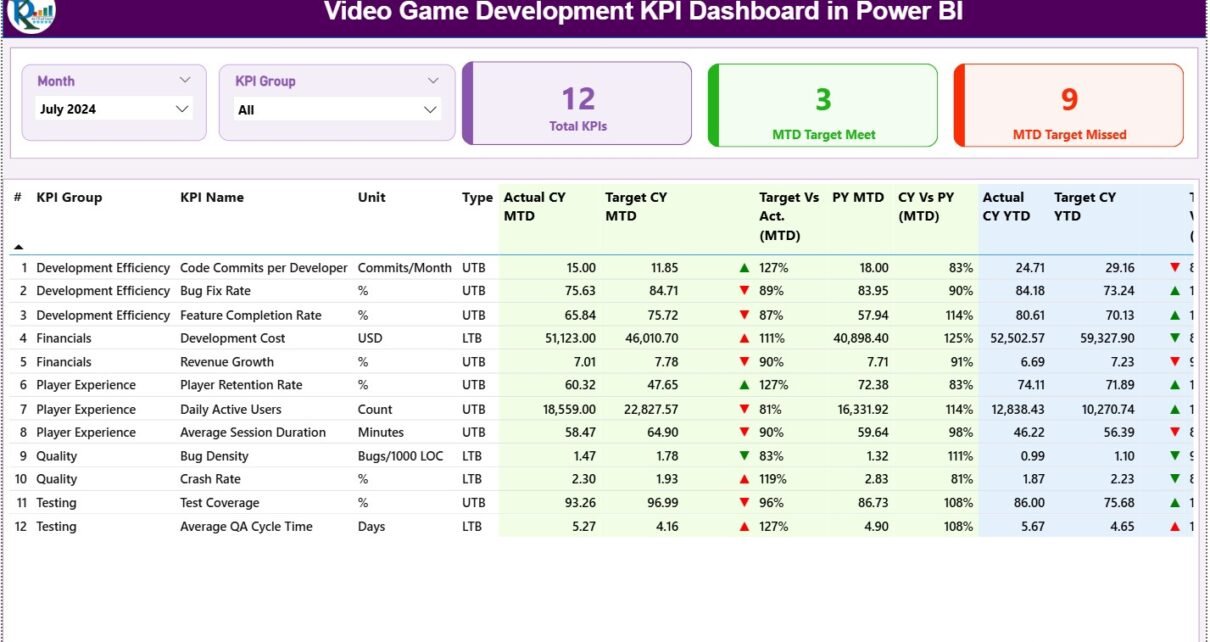
1️⃣ Summary Page — Your Entire Development Status in One View
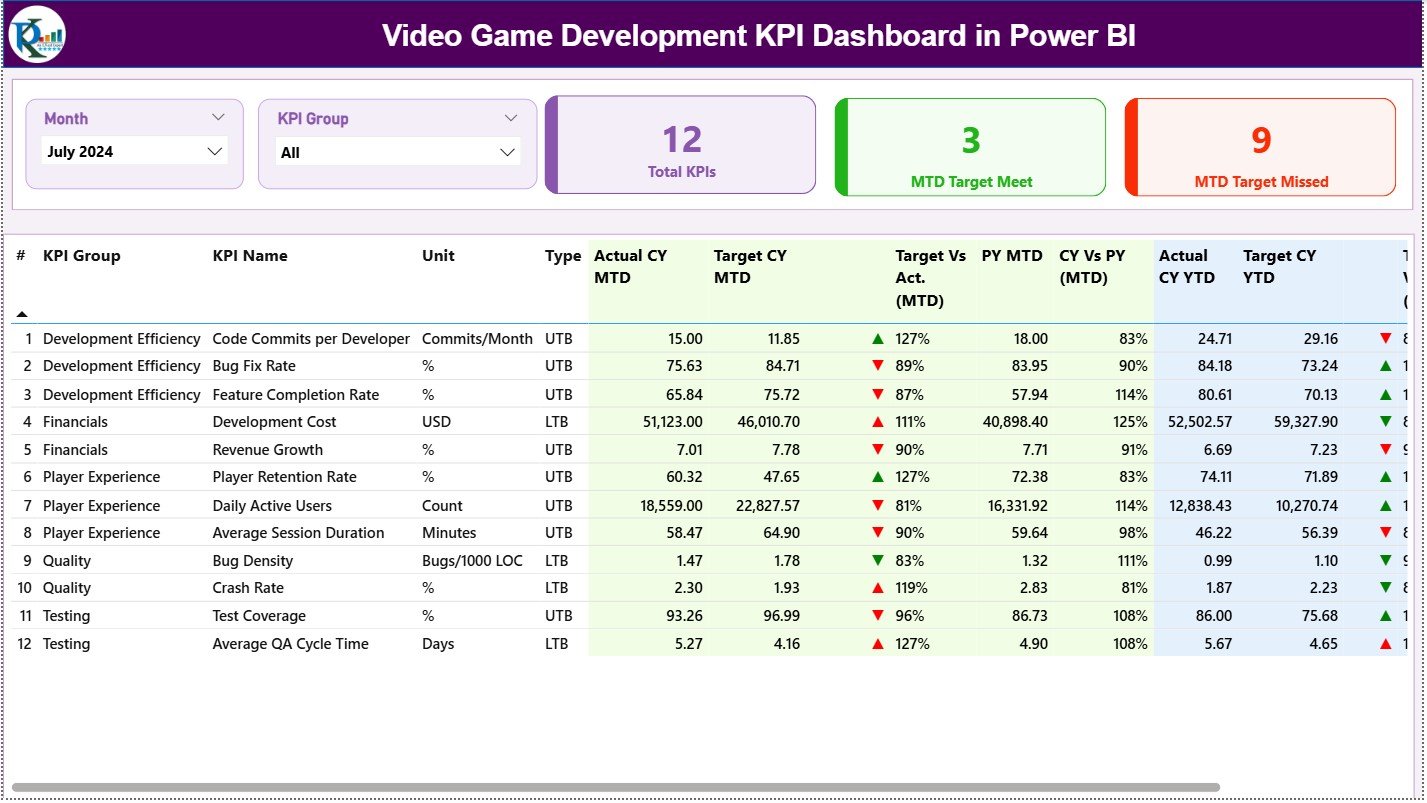
The Summary Page is the heart of the dashboard. It gives a bird’s-eye view of your game’s status. It includes:
✔ Top Slicers
-
Month Slicer – Choose the month you want to analyze.
-
KPI Group Slicer – Filter KPIs by categories such as:
-
Game Design
-
Development
-
QA Testing
-
Performance
-
Player Experience
-
Monetization
-
These slicers help team members focus on the KPIs that matter to them.
✔ KPI Cards at the Top
These three cards create instant clarity:
-
Total KPIs Count
-
MTD Target Met Count
-
MTD Target Missed Count
They show whether the team meets its goals or needs improvement.
⭐ Detailed KPI Table (Core of the Summary Page)
This table gives the complete performance breakdown:
-
KPI Number – Unique sequence number
-
KPI Group – Category like QA, Development, Art, or Game Design
-
KPI Name – The name of the KPI
-
Unit – Hours, %, Count, Bugs, Tasks, etc.
-
Type (LTB / UTB)
-
LTB = Lower the better (e.g., Bugs)
-
UTB = Upper the better (e.g., Levels Completed)
-
-
Actual CY MTD – Current year’s actual month-to-date number
-
Target CY MTD – Target MTD number
-
MTD Icon (▲▼) – Performance indicator
-
MTD Target vs Actual (%) – Actual / Target
-
PY MTD – Previous year’s MTD number
-
CY vs PY (MTD) – Current vs Previous year progress
-
Actual CY YTD – Current year’s cumulative value
-
Target CY YTD – Current year’s cumulative target
-
YTD Icon (▲▼) – Green or red indicator
-
YTD Target vs Actual (%) – Actual / Target
-
PY YTD – Previous year’s cumulative number
-
CY vs PY (YTD) – Year-to-year comparison
This table gives a full, structured, and interactive view of your development success.
Click to Purchases Video Game Development KPI Dashboard in Power BI
2️⃣ KPI Trend Page — Month-by-Month Game Development Insights
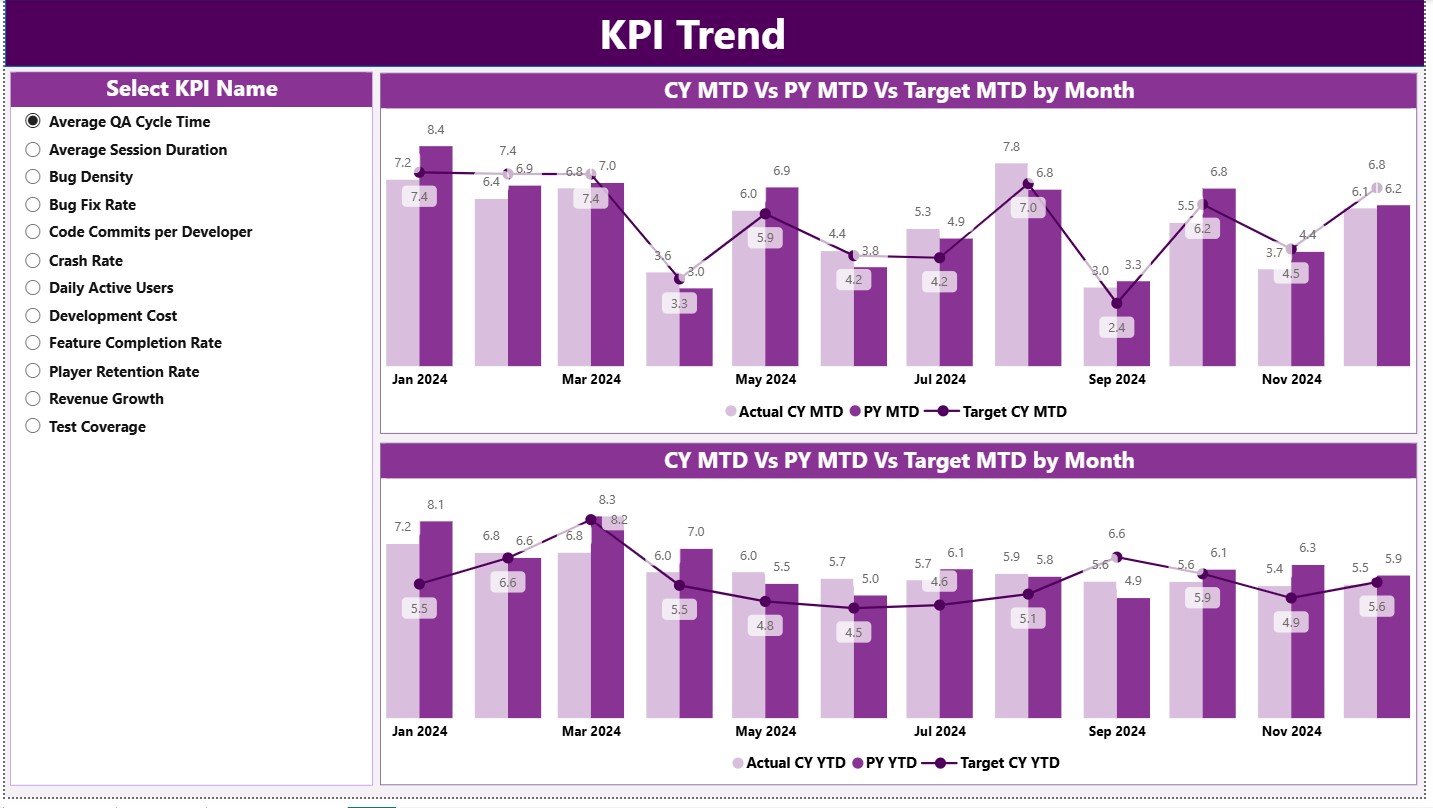
The KPI Trend Page helps track performance changes across months. It shows how things progress, improve, or decline.
What You See Here
-
Left KPI Slicer – Select any KPI from the list
-
Two Combo Charts
-
MTD Trend: Actual vs PY vs Target
-
YTD Trend: Actual vs PY vs Target
-
These charts help you track long-term behavior of metrics like:
-
Bug Fix Rate
-
Feature Completion Rate
-
Load Time Improvement
-
Frame Rate Growth
-
Player Feedback Score
-
User Retention
Trends help teams adjust strategies early.
3️⃣ KPI Definition Page — Understanding Every KPI Clearly
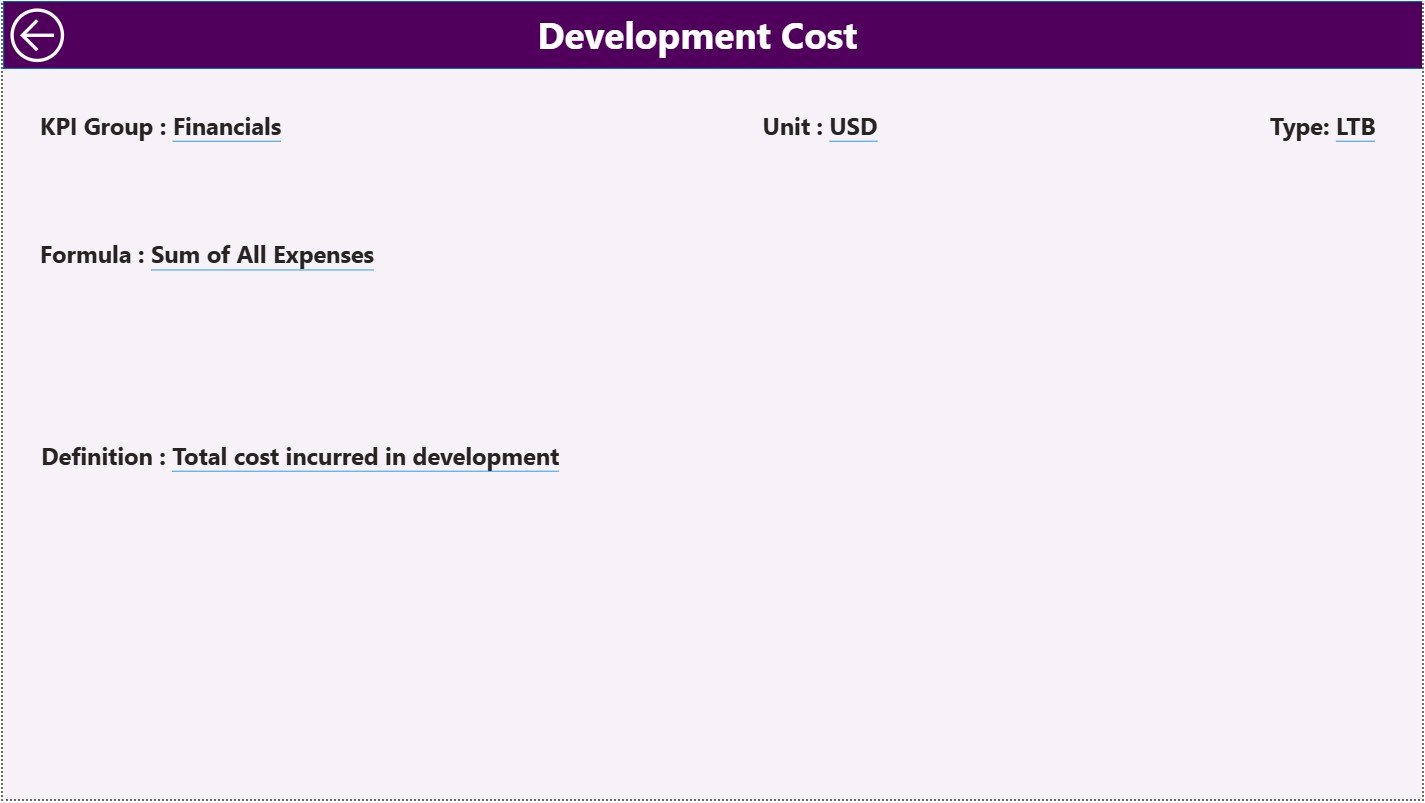
This hidden drill-through page brings transparency. When you click on any KPI from the Summary Page, it takes you here.
It shows:
-
KPI Number
-
KPI Group
-
KPI Name
-
Unit
-
Formula
-
Definition
-
Type (UTB or LTB)
Teams often argue about KPI calculations. This page removes all confusion.
You can return to the Summary Page using the Back button on the top-left corner.
Click to Purchases Video Game Development KPI Dashboard in Power BI
⭐ Excel Data Source for the Dashboard
This dashboard works using an Excel file containing three worksheets.
1️⃣ Input_Actual Sheet
You enter:
-
KPI Name
-
Month (use first day of each month)
-
MTD Actual
-
YTD Actual
2️⃣ Input_Target Sheet
You enter:
-
KPI Name
-
Month
-
MTD Target
-
YTD Target
Targets help managers track performance gaps.
3️⃣ KPI Definition Sheet
You enter:
-
KPI Number
-
KPI Group
-
KPI Name
-
Unit
-
Formula
-
Definition
-
Type (LTB or UTB)
This sheet supports the drill-through page.
⭐ Important KPIs for Video Game Development
Game studios track several KPIs depending on their workflow. Below are popular KPI groups and examples.
🎮 Development KPIs
-
Features completed vs planned
-
Development hours
-
Code review turnaround time
-
Build success rate
🎨 Art & Design KPIs
-
Character models completed
-
Environment assets created
-
UI/UX progress score
-
Animation completion rate
🧪 QA & Testing KPIs
-
Number of bugs reported
-
Bug fix rate
-
Severity levels
-
Test coverage percentage
⚙️ Performance KPIs
-
Frame rate stability
-
Crash reduction rate
-
Load time improvement
-
Memory optimization level
📊 Player Experience KPIs
-
User satisfaction score
-
Feedback implementation rate
-
Tutorial completion rate
-
Retention rate
💰 Monetization KPIs
-
In-app purchase success
-
Ad revenue
-
Subscription conversion rate
-
Average Revenue Per User (ARPU)
⭐ Advantages of the Video Game Development KPI Dashboard
This dashboard offers strong benefits. Let’s explore them.
1. Real-Time Insights
You get instant updates on development performance. You identify delays early and act quickly.
2. Better Team Alignment
Designers, developers, testers, and managers view the same data. Everyone works toward one goal.
3. Faster Decision Making
Clear visuals make decisions easier. No one wastes time reading long reports.
4. Strong Accountability
KPIs highlight areas needing attention. Teams improve performance naturally.
5. Better Quality Control
QA teams track bugs efficiently. Trends help them prevent repeated issues.
6. Clear Project Timeline Visibility
Managers compare actual progress against the plan. They adjust workloads smoothly.
7. Improved Player Experience
Player-focused KPIs track game polish, feedback, and satisfaction.
Click to Purchases Video Game Development KPI Dashboard in Power BI
⭐ Best Practices for Using the Video Game Development KPI Dashboard
Follow these practices for accurate insights.
✔ Use Clear KPI Definitions
Keep formulas simple and transparent.
✔ Update Data Every Month
Consistency improves analysis.
✔ Organize KPIs Based on Workflow
Group by Art, Design, QA, Coding, Performance, and Player Experience.
✔ Add Only Relevant KPIs
Avoid tracking too many metrics.
✔ Compare Performance With Past Trends
Past performance helps predict future challenges.
✔ Share the Dashboard With All Teams
More eyes lead to faster improvements.
✔ Set Realistic Targets
Targets must match team capabilities.
✔ Monitor Both MTD & YTD Values
This gives a complete view of short-term and long-term progress.
⭐ How to Use the Dashboard Effectively
1. Start With the Summary Page
Check overall performance using cards and tables.
2. Drill Deep Into KPI Details
Use the definition page to understand formulas.
3. Track Monthly Trends
Use combo charts to recognize improvement patterns.
4. Improve Workflows
Focus on KPIs that show gaps.
5. Enhance Game Quality
Use QA and performance KPIs to refine gameplay.
⭐ Conclusion
A Video Game Development KPI Dashboard in Power BI brings clarity, structure, and intelligence to the development pipeline. It helps studios track KPIs across art, coding, testing, performance, and player experience. Because it uses a simple Excel data source and powerful visuals, teams can update it easily and review insights instantly.
Whether you build indie games or large AAA productions, this dashboard keeps your project organized and predictable. It improves decision-making, boosts team alignment, and ensures high-quality output. As the gaming market becomes more competitive, dashboards like this become essential for success.
Click to Purchases Video Game Development KPI Dashboard in Power BI
⭐ Frequently Asked Questions (FAQs)
1. What is a Video Game Development KPI Dashboard?
It is a reporting tool built in Power BI that tracks KPIs for art, design, coding, testing, and performance.
2. Who can use this dashboard?
Developers, designers, testers, project managers, and studio heads use it daily.
3. Does it use Excel data?
Yes. Three worksheets store Actuals, Targets, and KPI Definitions.
4. Can I customize the KPIs?
Yes, you can modify, add, or remove KPIs easily.
5. Does it track bugs and testing metrics?
Yes. QA KPIs are fully supported.
6. Can I drill through to view KPI details?
Yes. The dashboard includes a hidden drill-through page.
7. Do I need Power BI Desktop to use it?
Yes. It is required to open, edit, and view the file.
Click to Purchases Video Game Development KPI Dashboard in Power BI
Visit our YouTube channel to learn step-by-step video tutorials