Introduction
The Virtual Office Services KPI Dashboard is a comprehensive, ready-to-use template designed specifically for tracking Outsourced Accounting KPIs. With this dashboard, businesses can efficiently monitor their performance metrics through interactive and visual tools tailored to improve decision making.
Key Features of Virtual Office Services KPI Dashboard
Click to Purchases Virtual Office Services KPI Dashboard in Excel
- Seven fully functional worksheets covering every key aspect of KPI tracking.
- User-friendly month selector to dynamically adjust data across the dashboard.
- Detailed MTD (Month-to-Date) and YTD (Year-to-Date) performance comparisons against targets and previous year figures.
- Conditional formatting with up and down arrows for clear visual indication of KPI trends.
- Comprehensive KPI definitions, formulas, and types to educate users on the metrics tracked.
- Interactive trend charts to visualize KPI progress over time.
Dashboard Pages Explanation
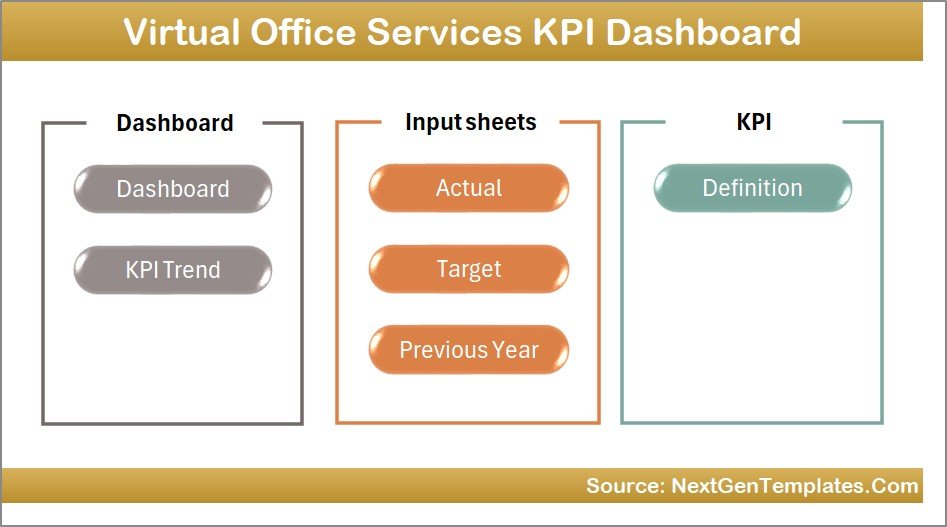
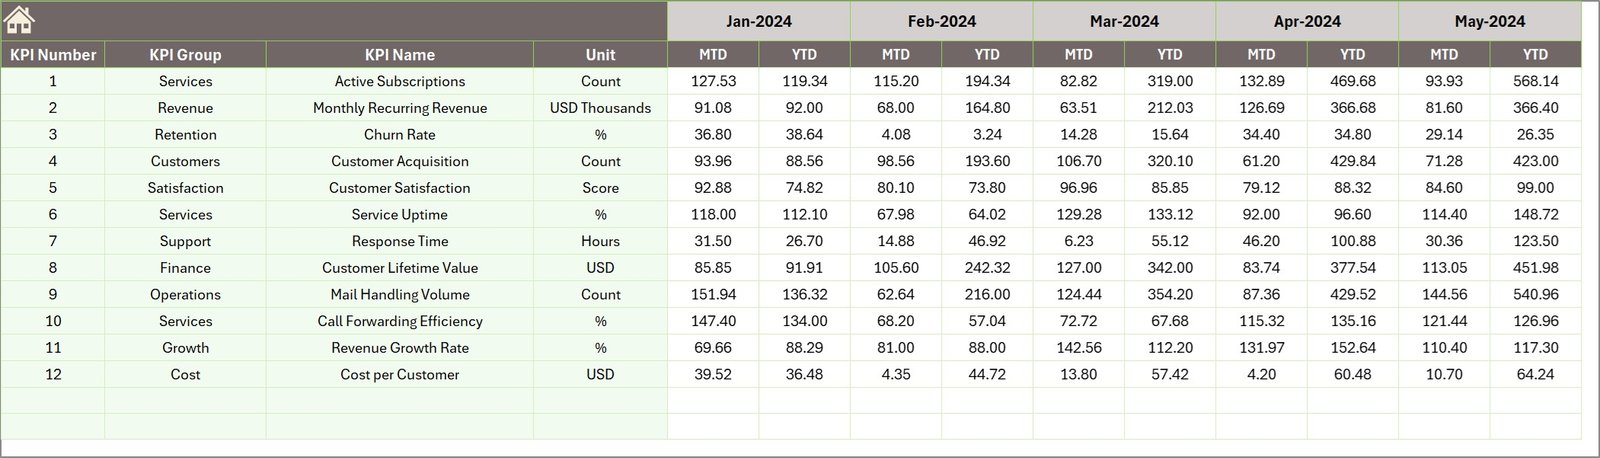
1. Home Sheet
This serves as the main index sheet with six navigation buttons leading to other sheets for easy access.
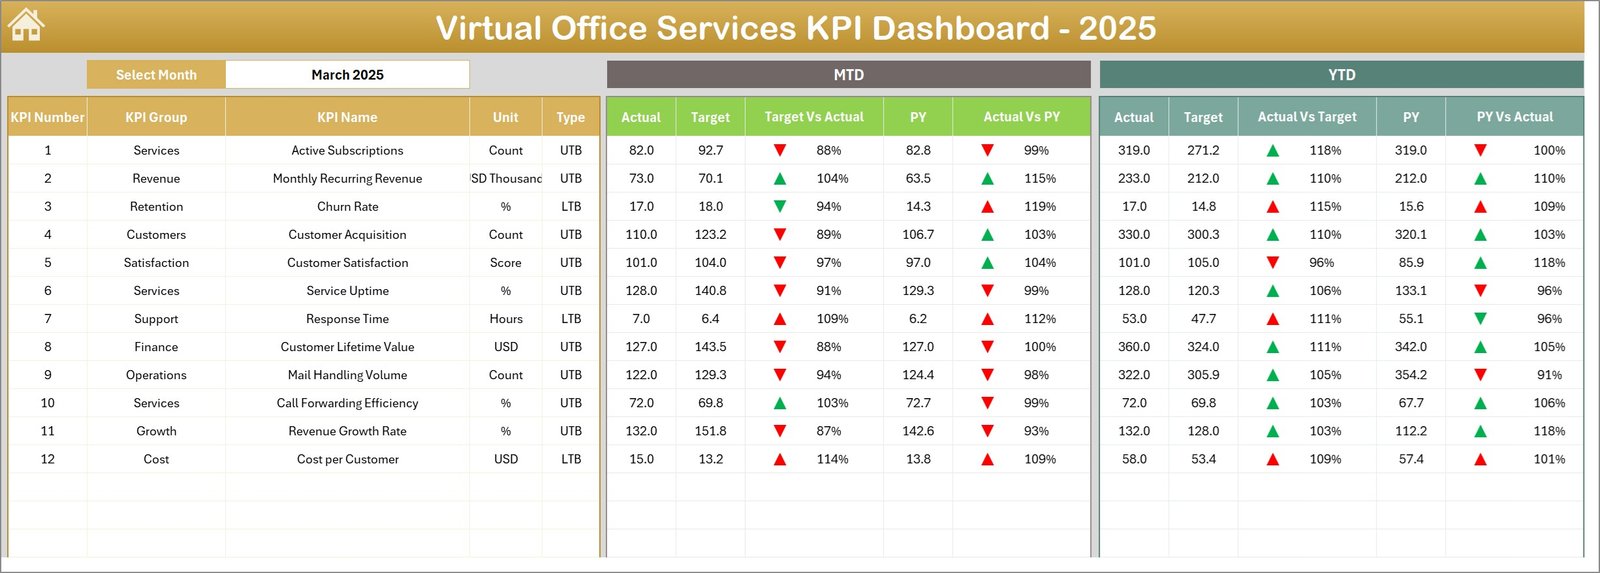
Home Page
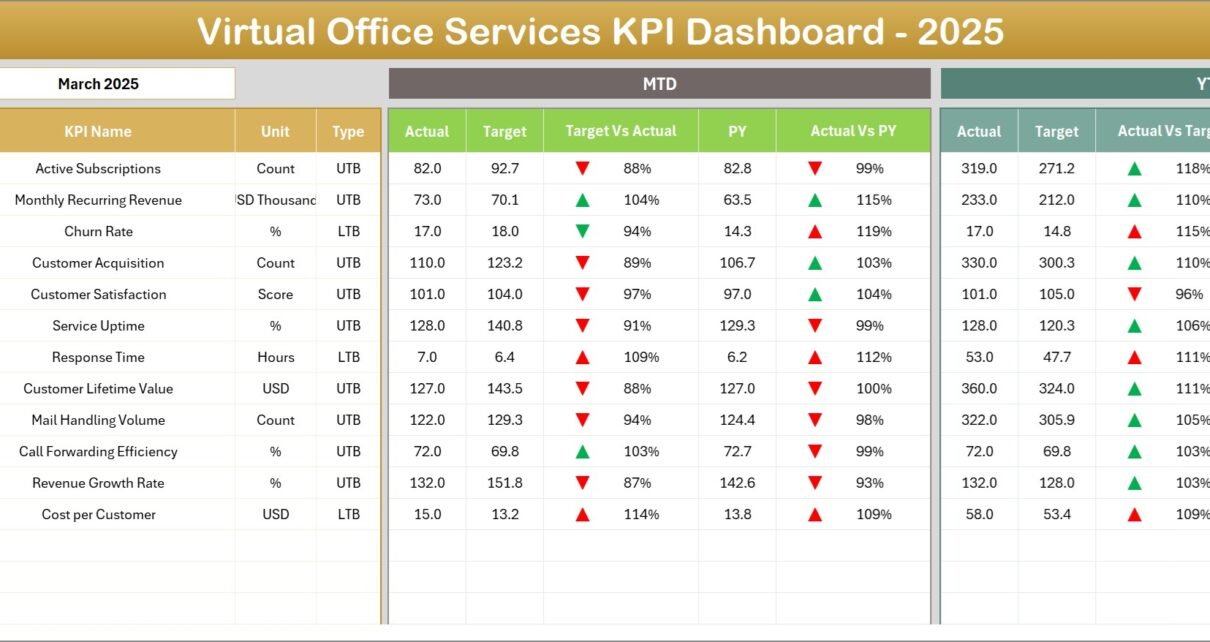
2. Dashboard Sheet
This is the core page displaying all key performance indicators. Users can select a month from a drop-down on cell D3, which refreshes all related data for that period.
- Shows MTD Actual, Target, and Previous Year numbers.
- Displays comparative Target vs Actual and Previous Year vs Actual with intuitive up/down arrows.
- Includes YTD Actual, Target, and Previous Year details with similar comparison visuals.
-
Click to Purchases Virtual Office Services KPI Dashboard in Excel
Virtual Office Services KPI Dashboard
3. KPI Trend Sheet
This sheet allows selecting a KPI name from a drop-down at cell C3 and displays:
- KPI Group, Unit, Type (Lower the Better / Upper the Better), Formula, and Definition.
- MTD and YTD trend charts illustrating Actual, Target, and Previous Year data trends over time.
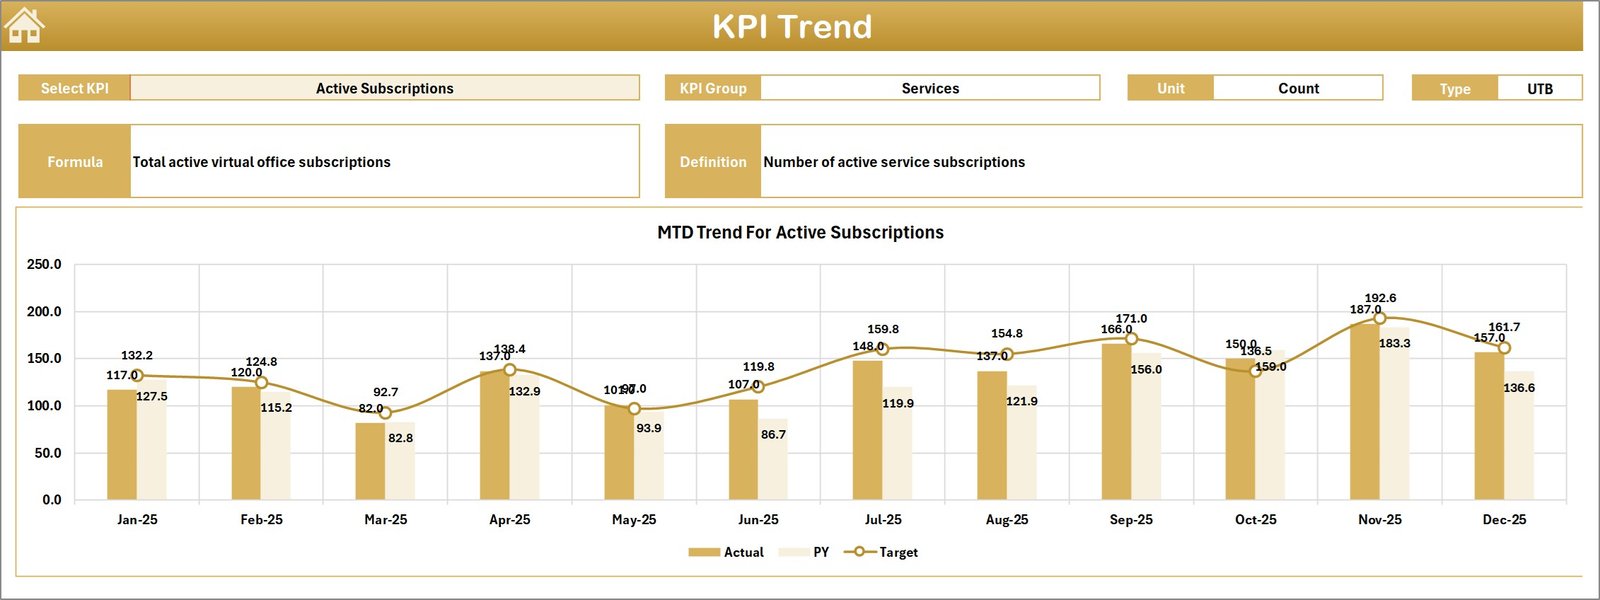
KPI Trend Sheet
4. Actual Numbers Input Sheet
Enter actual performance numbers here for both MTD and YTD for the selected month. Change the months starting from the month entered in cell E1.
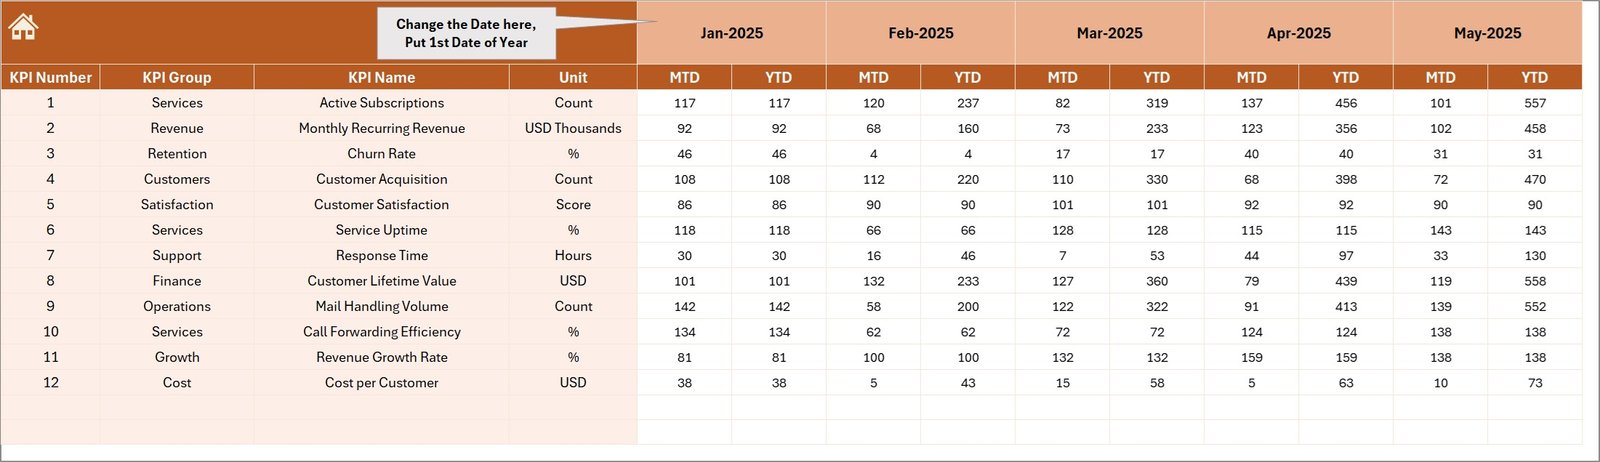
Actual Numbers Input sheet
5. Target Number Input Sheet
Input target KPI values for each month, including MTD and YTD targets to measure performance goals against actual outcomes.
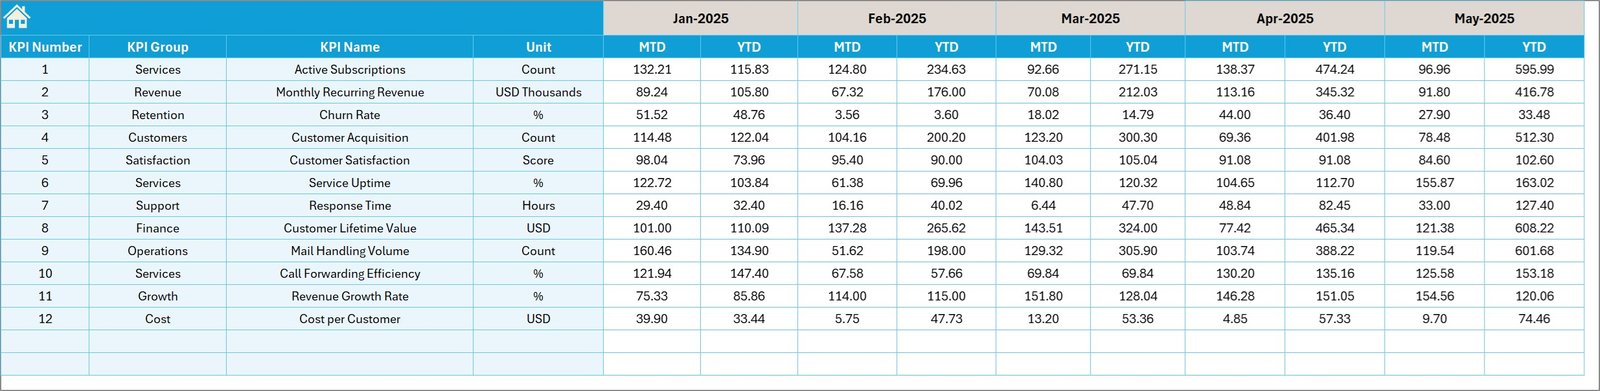
Target Number Input sheet
6. Previous Year Number Input Sheet
Here, enter the KPI data from the previous year to enable valuable year-over-year comparison throughout the dashboard.
Previous Year Number Input sheet
7. KPI Definition Sheet
Maintain all relevant KPI information here including:
- KPI Name
- KPI Group
- Unit of measurement
- Formula used to calculate the KPI
- KPI definition for clarity
- KPI type designation as LTB (Lower the Better) or UTB (Upper the Better)
-
Click to Purchases Virtual Office Services KPI Dashboard in Excel
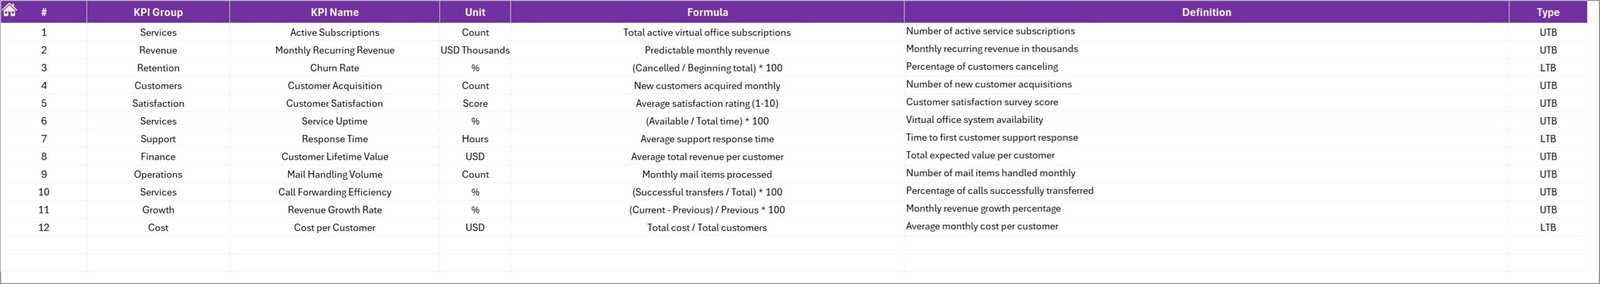
KPI Definition sheet
Advantages of Virtual Office Services KPI Dashboard
- Time-Saving: Pre-built formulas and interactivity save hours in manual KPI tracking.
- Data-Driven Decisions: Visual dashboards and trend analysis support informed decision making.
- Accuracy: Automated calculations reduce human error inherent in manual tracking.
- Customization: Easy to modify inputs and KPI definitions to suit specific organizational needs.
- Comprehensive Overview: Holistic insights combining current performance, targets, and historical data.
- User Friendly: Intuitive navigation and clear visual indicators enhance user experience.
Opportunities for Improvement
- Incorporate automated data imports from accounting software for real-time updates.
- Add predictive analytics features to forecast KPI trends and potential risks.
- Enhance mobile responsiveness for monitoring on the go.
- Integrate alert systems for KPI thresholds breaches via email or messaging apps.
- Include benchmarking features comparing KPIs against industry standards.
Best Practices
- Regularly update actual, target, and previous year data for accurate insights.
- Review KPI definitions with relevant stakeholders to ensure alignment.
- Use the trend charts to identify positive and negative performance patterns promptly.
- Leverage the dashboard’s conditional formatting to quickly spot critical variances.
- Train users on interpreting KPIs and navigating the dashboard effectively.
FAQs
What KPIs are included in this dashboard?
This dashboard tracks essential KPIs related to outsourced accounting and virtual office services such as billing efficiency, client satisfaction, and operational costs.
Can I customize the KPIs?
Yes, KPIs can be added or modified in the KPI Definition sheet to suit your business requirements.
Is the dashboard compatible with Excel versions?
The dashboard is optimized for Excel 2013 and above, featuring drop-downs, charts, and conditional formatting.
Can I use the dashboard for real-time data?
Currently, data must be updated manually, but planned enhancements may include automation.
Conclusion
The Virtual Office Services KPI Dashboard is an invaluable tool for businesses managing outsourced accounting services. Its robust features, user-friendly layout, and thorough KPI tracking enable companies to monitor performance effectively, make data-driven decisions, and identify improvement areas quickly. Investing time in implementing and maintaining this dashboard can significantly enhance operational transparency and organizational success.
For further learning and practical demonstrations, consider visiting Microsoft’s official resource on dashboards: Microsoft Excel Support.
Visit our YouTube channel to watch the demo: Youtube.com/@NextGenTemplates