Waste reduction has become a critical priority for organizations across industries. As regulations tighten and sustainability expectations rise, leaders must track waste-related performance clearly and consistently. However, many teams still depend on scattered Excel files, manual reports, and delayed summaries. As a result, they struggle to understand trends, measure progress, and take timely action.
That is exactly why a Waste Reduction KPI Dashboard in Power BI becomes an essential performance management tool.
In this comprehensive and SEO-friendly guide, you will learn what a Waste Reduction KPI Dashboard in Power BI is, why it matters, how it works, and how each page supports data-driven sustainability decisions. Moreover, this article explains advantages, best practices, and frequently asked questions so you can confidently use this dashboard in real-world waste reduction initiatives.
A Waste Reduction KPI Dashboard in Power BI is a ready-to-use, interactive reporting solution designed to track, analyze, and visualize waste-related performance indicators in one centralized place.
Instead of managing multiple spreadsheets for actuals, targets, and historical comparisons, teams can monitor everything through dynamic visuals, KPI tables, and trend charts. Because the dashboard uses Power BI, it delivers speed, clarity, and interactivity without complexity.
More importantly, this dashboard helps organizations:
-
Track waste reduction performance month-to-date (MTD) and year-to-date (YTD)
-
Compare actual results with targets and previous-year values
-
Identify underperforming KPIs quickly
-
Support sustainability goals with reliable data
Why Do Organizations Need a Waste Reduction KPI Dashboard?
Why Is Waste Reduction Tracking Important?
Waste reduction directly impacts cost savings, regulatory compliance, and environmental responsibility. However, without structured reporting, teams often miss warning signs.
A Waste Reduction KPI Dashboard in Power BI solves this problem by providing:
-
Clear visibility into waste performance
-
Faster identification of gaps against targets
-
Consistent reporting across departments
-
Data-driven insights for sustainability initiatives
Because the dashboard updates dynamically, leaders can act early instead of reacting late.
How Does the Waste Reduction KPI Dashboard in Power BI Work?
The dashboard works by combining structured Excel-based input data with interactive Power BI visuals. As users update actuals, targets, and KPI definitions in Excel, Power BI refreshes the dashboard instantly.
As a result, teams always work with up-to-date and reliable insights.
What Are the Key Features of the Waste Reduction KPI Dashboard in Power BI?
This ready-to-use dashboard includes three powerful pages, each designed to support a specific level of analysis.
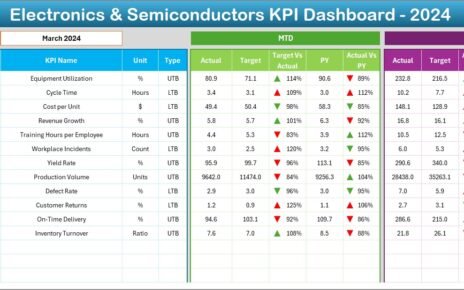
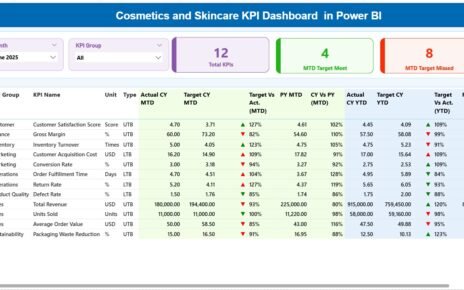
What Does the Summary Page Show?

The Summary Page serves as the main control center of the dashboard. From this page, users can review overall waste reduction performance at a glance.
Key Elements of the Summary Page
-
Month Slicer: Allows users to select the reporting month dynamically
-
KPI Group Slicer: Filters KPIs by category or group
KPI Cards on the Summary Page
At the top of the page, three KPI cards instantly highlight performance:
-
Total KPIs Count
-
MTD Target Meet Count
-
MTD Target Missed Count
These cards provide immediate clarity on how well waste reduction goals perform for the selected period.
Click to Purchases Waste Reduction KPI Dashboard Power BI
What Information Appears in the Detailed KPI Table?

Below the KPI cards, the dashboard displays a detailed table that shows comprehensive KPI-level performance.
KPI Table Columns Explained
-
KPI Number: Sequential number assigned to each KPI
-
KPI Group: Category or group of the KPI
-
KPI Name: Name of the waste reduction metric
-
Unit: Unit of measurement (e.g., kg, %, tons)
-
Type: KPI type such as LTB (Lower the Better) or UTB (Upper the Better)
How Does the Dashboard Track MTD Performance?
The dashboard tracks Month-to-Date performance with precision and clarity.
-
Actual CY MTD: Current year actual MTD value
-
Target CY MTD: Target MTD value for the current year
-
MTD Icon:
-
▲ Green arrow indicates target met
-
▼ Red arrow indicates target missed
-
-
Target vs Actual (MTD):
-
Calculated as:
Actual MTD / Target MTD
-
-
PY MTD: Previous year MTD value for the same period
-
CY vs PY (MTD):
-
Calculated as:
Current Year MTD / Previous Year MTD
-
How Does the Dashboard Track YTD Performance?
In addition to MTD metrics, the dashboard also provides Year-to-Date performance insights.
-
Actual CY YTD: Current year actual YTD value
-
Target CY YTD: Current year target YTD value
-
YTD Icon: Visual indicator showing target status
-
Target vs Actual (YTD):
-
Calculated as:
Actual YTD / Target YTD
-
-
PY YTD: Previous year YTD value
-
CY vs PY (YTD):
-
Calculated as:
Current Year YTD / Previous Year YTD
-
Because these calculations appear in one table, users can compare short-term and long-term performance instantly.
What Is the KPI Trend Page Used For?

The KPI Trend Page focuses on trend analysis over time. This page helps users understand how waste reduction KPIs evolve month by month.
Key Features of the KPI Trend Page
-
KPI Name Slicer: Select a specific KPI for analysis
-
Two Combo Charts:
-
MTD Trend Chart:
-
Actual Current Year
-
Actual Previous Year
-
Target
-
-
YTD Trend Chart:
-
Actual Current Year
-
Actual Previous Year
-
Target
-
-
These combo charts make trend comparisons clear and actionable.
Why Is Trend Analysis Important for Waste Reduction?
Trend analysis helps teams:
-
Detect performance improvement or decline early
-
Validate sustainability initiatives
-
Compare seasonal waste patterns
-
Support strategic planning with historical insights
Because visuals update dynamically, users can explore trends without manual recalculations.
What Is the KPI Definition Page?
The KPI Definition Page is a drill-through page designed for clarity and governance.
What Information Does the KPI Definition Page Show?
-
KPI Formula
-
KPI Definition
-
Unit of Measurement
-
KPI Type (LTB or UTB)
This page remains hidden by default to keep the dashboard clean. However, users can drill through from the Summary Page to access KPI details instantly.
To return to the main page, users simply click the Back button available on the top-left corner.
How Does the Excel Data Source Work?
The Waste Reduction KPI Dashboard in Power BI uses an Excel file as its data source. This approach ensures simplicity, flexibility, and ease of maintenance.
Excel File Structure
The Excel file includes three worksheets.
1. Input_Actual Sheet
In this sheet, users enter actual performance values.
Fields include:
-
KPI Name
-
Month (use the first date of the month)
-
MTD Actual Number
-
YTD Actual Number
2. Input_Target Sheet
In this sheet, users enter target values.
Fields include:
-
KPI Name
-
Month (use the first date of the month)
-
MTD Target Number
-
YTD Target Number
3. KPI Definition Sheet
This sheet defines KPI metadata.
Fields include:
-
KPI Number
-
KPI Group
-
KPI Name
-
Unit
-
Formula
-
Definition
-
Type (LTB or UTB)
Because these sheets remain structured, Power BI refreshes data accurately every time.
Advantages of Waste Reduction KPI Dashboard in Power BI
Click to Purchases Waste Reduction KPI Dashboard Power BI
A Waste Reduction KPI Dashboard in Power BI delivers multiple benefits for sustainability-driven organizations.
Key Advantages
-
📊 Centralized waste performance tracking
-
⚡ Faster decision-making with real-time visuals
-
🎯 Clear comparison of actuals vs targets
-
🔍 Improved transparency and accountability
-
🌱 Stronger alignment with sustainability goals
-
📈 Better trend analysis for long-term planning
Because the dashboard reduces manual work, teams can focus on improvement instead of reporting.
How Does This Dashboard Support Sustainability Goals?
This dashboard aligns operational data with sustainability objectives. As a result, organizations can measure progress, report outcomes, and demonstrate accountability to stakeholders.
Best Practices for the Waste Reduction KPI Dashboard in Power BI
To maximize value, teams should follow proven best practices.
Best Practices to Follow
-
✅ Define KPIs clearly in the KPI Definition sheet
-
✅ Use consistent units and formulas across periods
-
✅ Update Excel data regularly
-
✅ Review MTD and YTD trends together
-
✅ Focus on KPIs that drive action, not just reporting
-
✅ Train users on slicers and drill-through features
By following these practices, organizations ensure accuracy, adoption, and long-term success.
Who Can Use a Waste Reduction KPI Dashboard in Power BI?
This dashboard suits a wide range of users, including:
-
Sustainability managers
-
Environmental compliance teams
-
Operations managers
-
Manufacturing leaders
-
ESG reporting teams
-
Corporate strategy teams
Because the dashboard remains flexible, it adapts easily to different industries.
How Does This Dashboard Improve Decision-Making?
The dashboard transforms raw waste data into structured insights. As a result, leaders can identify issues early, validate initiatives, and allocate resources effectively.
Conclusion: Why Should You Use a Waste Reduction KPI Dashboard in Power BI?
A Waste Reduction KPI Dashboard in Power BI provides a powerful, structured, and visual approach to managing waste performance. Instead of relying on fragmented data, organizations gain a single source of truth for sustainability metrics.
By combining Excel-based inputs with Power BI analytics, this dashboard delivers clarity, speed, and confidence. Moreover, it supports both operational tracking and strategic sustainability goals.
If your organization aims to reduce waste effectively and transparently, this dashboard becomes an indispensable tool.
Frequently Asked Questions (FAQs)
What is a Waste Reduction KPI Dashboard in Power BI used for?
A Waste Reduction KPI Dashboard in Power BI tracks waste-related KPIs, compares actuals with targets, and supports sustainability decisions through visual analytics.
Can I customize KPIs in this dashboard?
Yes, you can add, modify, or remove KPIs by updating the KPI Definition sheet in Excel.
How often should I update the data?
You should update actual and target data monthly. However, you can refresh more frequently if required.
Does this dashboard support MTD and YTD analysis?
Yes, the dashboard tracks both Month-to-Date and Year-to-Date performance with detailed comparisons.
Do I need advanced Power BI skills to use this dashboard?
No, the dashboard uses simple slicers, tables, and charts. Basic Power BI knowledge is sufficient.
Can this dashboard support ESG reporting?
Yes, the dashboard supports ESG initiatives by providing reliable and structured waste performance data.
Visit our YouTube channel to learn step-by-step video tutorials