The watches and timepieces industry moves with precision. Trends change fast. Luxury demand rises during festive seasons. Smartwatch sales grow with technology launches. Meanwhile, inventory costs increase if you fail to plan properly.
Therefore, you must track performance daily, monthly, and yearly.
However, many watch retailers and manufacturers still use scattered spreadsheets. As a result, they miss seasonal sales spikes. They fail to monitor slow-moving models. They struggle to compare targets with actual performance.
So, how can you monitor sales growth, inventory turnover, profit margins, sell-through rates, and seasonal demand in one structured system?
The answer is simple.
Click to Purchases Watches and Timepieces KPI Dashboard in Excel
You need a Watches and Timepieces KPI Dashboard in Excel.
In this detailed guide, you will learn:
-
What a Watches and Timepieces KPI Dashboard in Excel is
-
Why watch businesses need it
-
Detailed explanation of all 7 worksheets
-
Important KPIs for watch retail and manufacturing
-
Advantages of Watches and Timepieces KPI Dashboard in Excel
-
Best Practices for the Watches and Timepieces KPI Dashboard
-
Frequently Asked Questions with Answers
Let’s explore everything step by step.
What Is a Watches and Timepieces KPI Dashboard in Excel?
A Watches and Timepieces KPI Dashboard in Excel is a ready-to-use performance tracking template designed specifically for watch retailers, distributors, wholesalers, and manufacturers.
It helps you:
-
Track Monthly (MTD) and Year-to-Date (YTD) performance
-
Compare Actual vs Target numbers
-
Analyze Previous Year (PY) performance
-
Identify slow-moving inventory
-
Monitor profit margins
-
Evaluate seasonal sales trends
Moreover, it gives you all insights in one interactive dashboard. Therefore, you do not need multiple files.
Instead, you get:
-
Clean layout
-
Automated calculations
-
Interactive drop-down filters
-
Conditional formatting indicators
-
Dynamic trend charts
As a result, you make faster and smarter decisions.
Why Do Watch and Timepiece Businesses Need a KPI Dashboard?
The watch industry depends on precision and timing. Therefore, your reporting system must also work with precision.
1️⃣ Sales Fluctuate with Seasons
Luxury watches sell more during wedding seasons and festivals. Smartwatches sell during product launches and promotional campaigns. Therefore, you must compare monthly trends.
2️⃣ Inventory Costs Can Kill Profits
If a premium watch model stays in stock for 180 days, your capital blocks. As a result, inventory turnover becomes critical.
3️⃣ High Competition
Many brands compete in the same price range. Therefore, you must track:
-
Market share
-
Average selling price
-
Discount percentage
4️⃣ Multi-Channel Sales
Click to Purchases Watches and Timepieces KPI Dashboard in Excel
You may sell through:
-
Retail stores
-
Online marketplaces
-
Brand website
-
Distributors
Therefore, you need centralized performance tracking.
A KPI Dashboard solves all these challenges.
What Are the 7 Worksheets in the Watches and Timepieces KPI Dashboard in Excel?
This dashboard contains 7 structured worksheets. Each sheet has a specific purpose.
1️⃣ Home Sheet – Easy Navigation Center
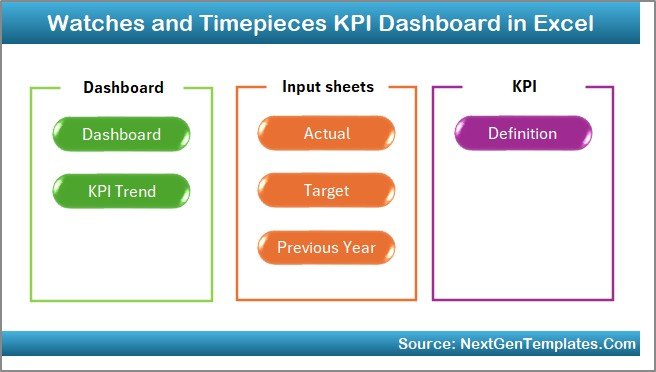
The Home Sheet acts as the index page.
Here, you get:
-
6 navigation buttons
-
Clean layout
-
One-click access to other sheets
Therefore, users can jump quickly between sheets without confusion.
This improves user experience and saves time.
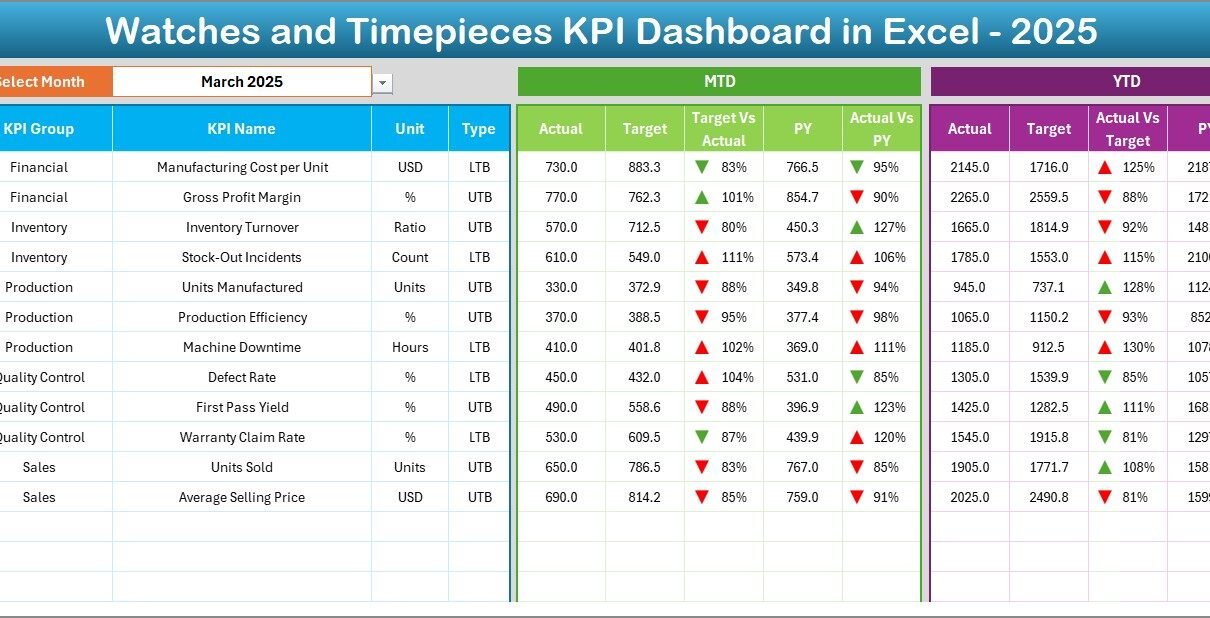
2️⃣ Dashboard Sheet – The Main Performance View
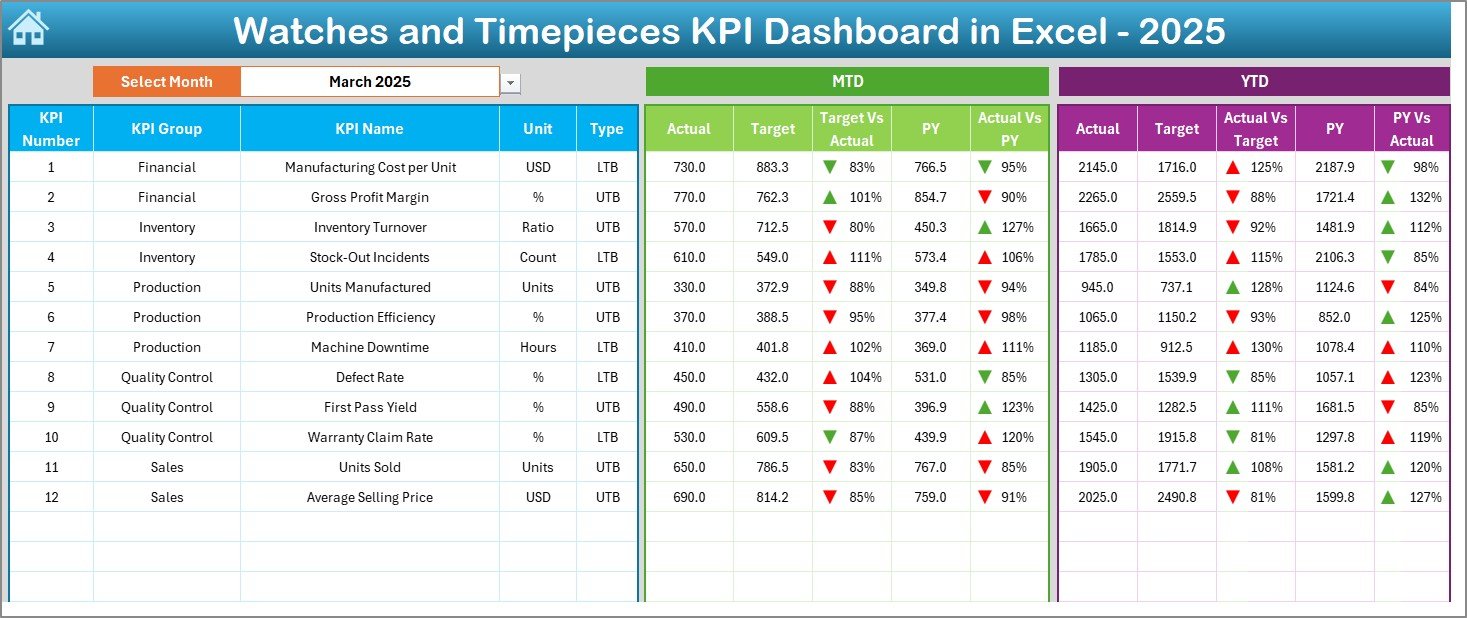
This is the most important sheet.
On cell D3, you can select the Month from the drop-down list. Once you select a month, the entire dashboard updates automatically.
Here, you see:
MTD Section:
-
MTD Actual
-
MTD Target
-
MTD Previous Year
-
Target vs Actual
-
PY vs Actual
-
Up/Down conditional arrows
YTD Section:
-
YTD Actual
-
YTD Target
-
YTD Previous Year
-
Target vs Actual
-
PY vs Actual
-
Conditional formatting indicators
Therefore, within seconds, you understand performance.
If profit margin shows a red arrow, you immediately know something needs attention.
Click to Purchases Watches and Timepieces KPI Dashboard in Excel
3️⃣ KPI Trend Sheet – Detailed KPI Analysis
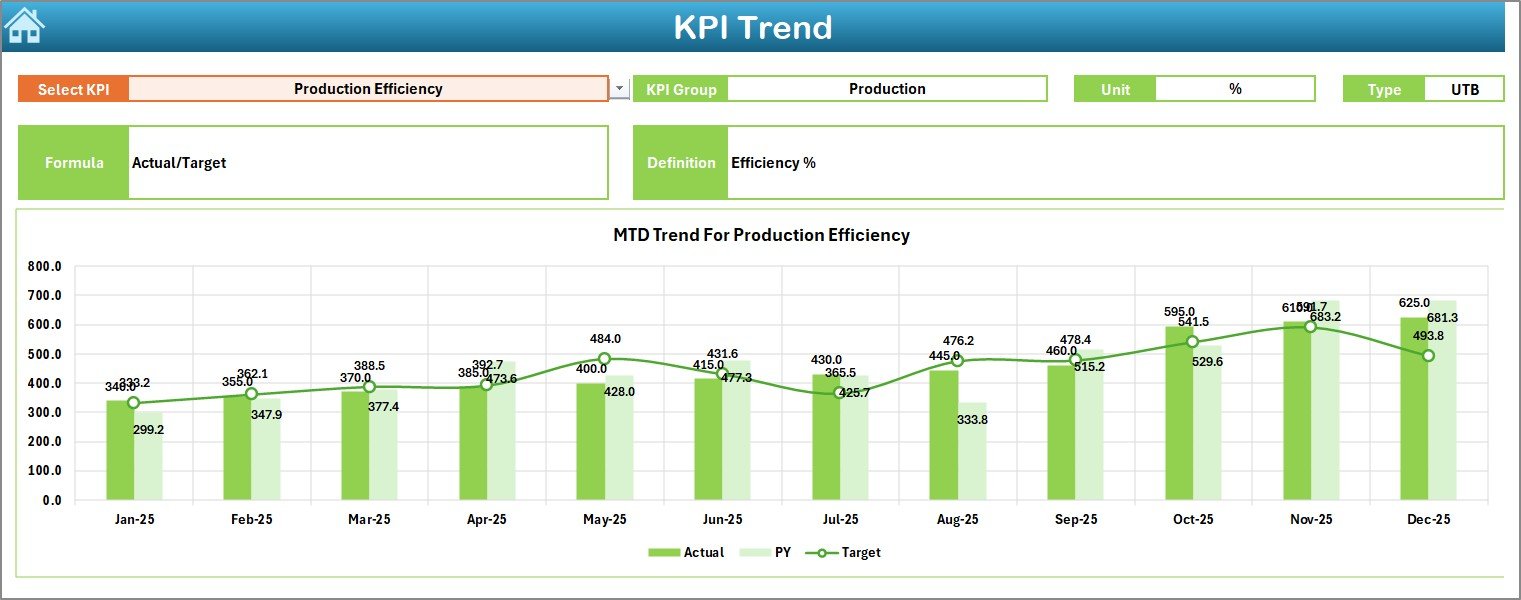
This sheet helps you analyze individual KPIs.
On cell C3, you can select the KPI name from the drop-down.
Once selected, you see:
-
KPI Group
-
Unit of KPI
-
Type (Lower the Better or Upper the Better)
-
Formula
-
Definition
Moreover, you see:
-
MTD Trend Chart
-
YTD Trend Chart
-
Actual vs Target vs PY comparison
Therefore, you can study performance month by month.
For example:
If “Inventory Turnover Ratio” drops from 5.2 to 3.8, you immediately investigate stock levels.
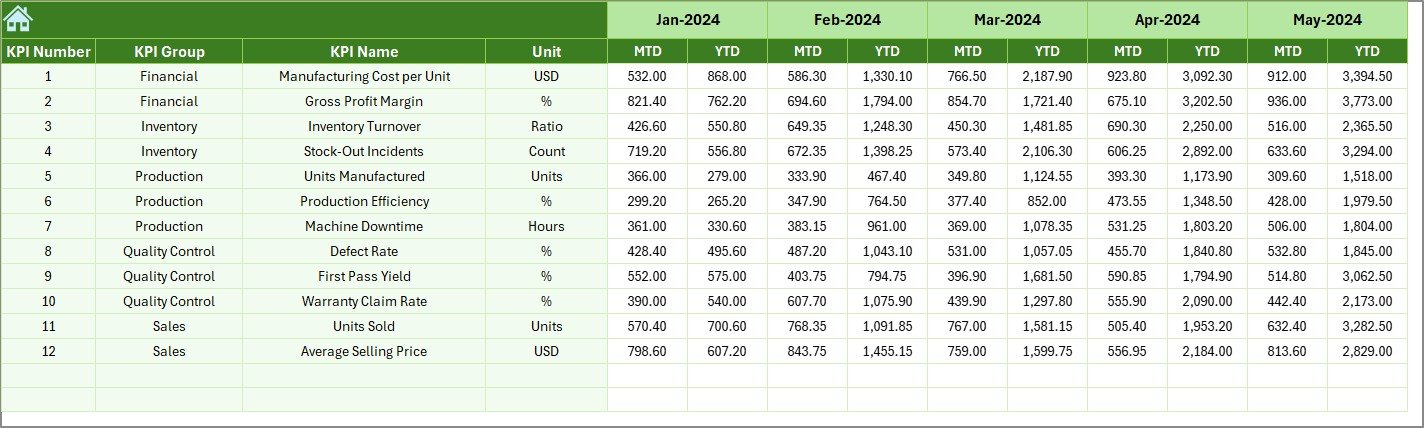
4️⃣ Actual Numbers Input Sheet – Data Entry Area
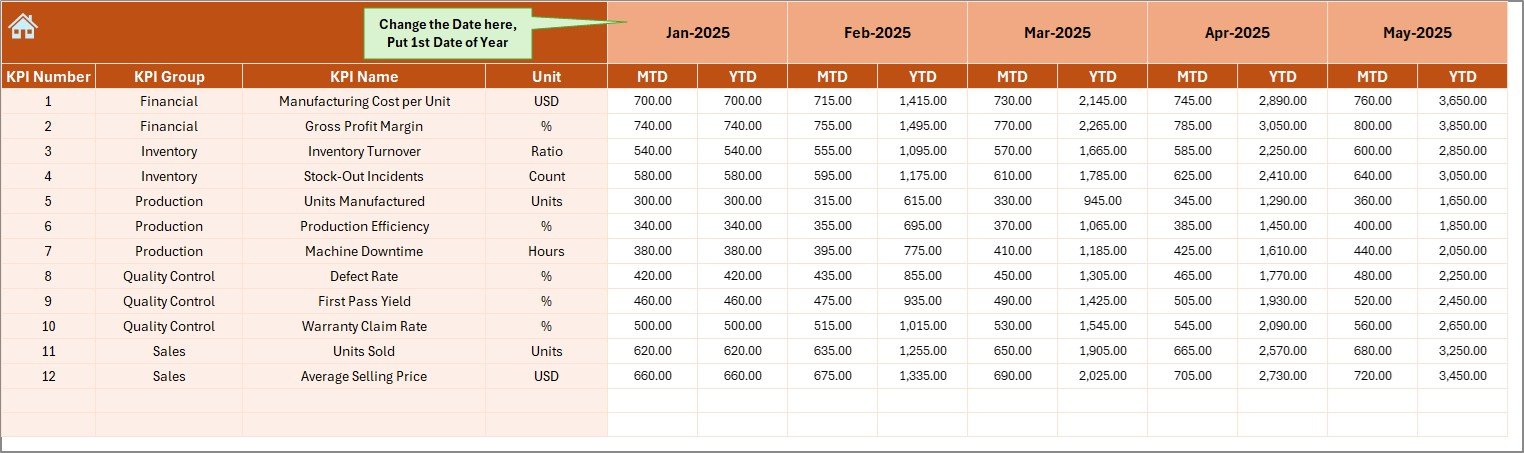
This sheet allows you to enter actual performance numbers.
In cell E1, you define the first month of the year.
After that, you enter:
-
MTD Actual values
-
YTD Actual values
Therefore, you maintain accurate data.
Because the dashboard pulls data from this sheet, you must update this sheet carefully.
5️⃣ Target Sheet – Monthly and Yearly Goals
In this sheet, you enter:
-
Monthly MTD Targets
-
YTD Targets
Targets guide performance. Therefore, without this sheet, comparison becomes impossible.
For example:
If sales target equals ₹50,00,000 and actual equals ₹47,00,000, the dashboard immediately shows variance.
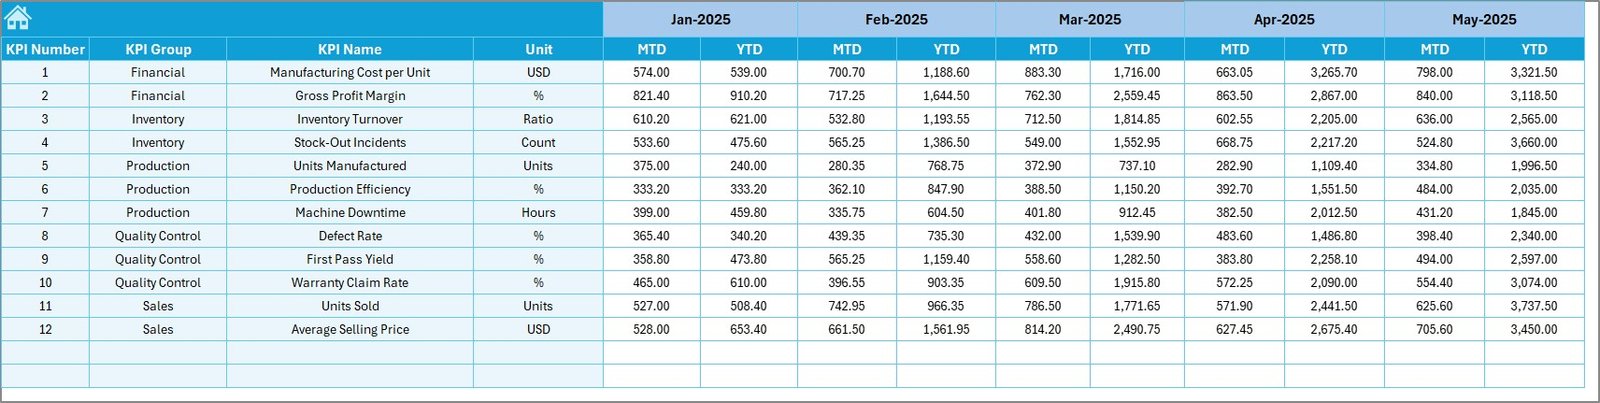
6️⃣ Previous Year Number Sheet – Historical Comparison
Here, you enter previous year numbers.
This helps you:
-
Compare growth percentage
-
Analyze seasonal patterns
-
Understand yearly improvement
For example:
If December 2023 sales were ₹60,00,000 and December 2024 sales are ₹72,00,000, you see clear growth.
Click to Purchases Watches and Timepieces KPI Dashboard in Excel
7️⃣ KPI Definition Sheet – KPI Master Database
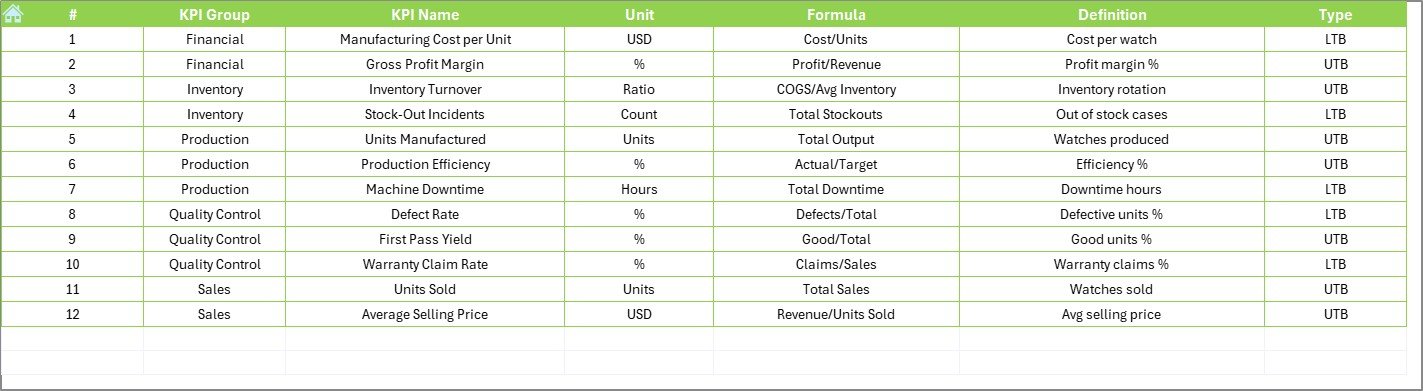
This sheet contains:
-
KPI Name
-
KPI Group
-
Unit
-
Formula
-
KPI Definition
-
KPI Type (LTB or UTB)
This sheet acts as the reference library.
Therefore, every user understands what each KPI means.
What Are the Important KPIs for Watches and Timepieces Businesses?
Let’s look at essential KPIs.
Sales KPIs
-
Total Sales Revenue
-
Gross Sales
-
Net Sales
-
Sales Growth %
-
Average Selling Price
Profitability KPIs
-
Gross Profit Margin
-
Net Profit Margin
-
Contribution Margin
Inventory KPIs
-
Inventory Turnover Ratio
-
Days Inventory Outstanding
-
Stock Aging %
Customer KPIs
-
Repeat Customer Rate
-
Conversion Rate
-
Customer Acquisition Cost
Operational KPIs
-
Order Fulfillment Time
-
Return Rate %
-
Warranty Claim Rate
Each KPI plays a critical role. Therefore, tracking them monthly improves performance.
How Does This Dashboard Improve Decision Making?
This dashboard improves decision making because:
-
It shows real-time comparison
-
It highlights underperforming KPIs
-
It displays visual trends
-
It simplifies complex data
For example:
If sell-through rate drops below 60%, you can immediately launch a discount campaign.
Therefore, action becomes faster.
Advantages of Watches and Timepieces KPI Dashboard in Excel
Using this dashboard offers several advantages.
1️⃣ Centralized Performance Tracking
You manage all KPIs in one file. Therefore, reporting becomes simple.
2️⃣ Easy to Use
Because it uses Excel, most businesses already know how to operate it.
3️⃣ Dynamic Month Selection
You can switch between months using a drop-down.
4️⃣ Clear Visual Indicators
Up and down arrows show performance instantly.
5️⃣ Year-on-Year Comparison
You can compare 2024 with 2023 easily.
6️⃣ Customizable Structure
You can add new KPIs anytime.
7️⃣ Cost-Effective Solution
You do not need expensive BI tools.
Best Practices for the Watches and Timepieces KPI Dashboard
To get maximum benefit, follow these best practices.
1️⃣ Update Data Regularly
Update actual numbers monthly. Therefore, the dashboard remains accurate.
2️⃣ Set Realistic Targets
Unrealistic targets reduce team morale. Therefore, analyze past trends before setting goals.
3️⃣ Review Trends Monthly
Do not check KPIs only yearly. Instead, review them monthly.
4️⃣ Monitor Inventory Closely
Luxury watches carry high capital cost. Therefore, track stock aging strictly.
5️⃣ Train Your Team
Ensure managers understand KPI definitions.
6️⃣ Maintain Data Accuracy
Avoid manual errors while entering numbers.
7️⃣ Use Insights for Action
Do not only observe red arrows. Instead, take action immediately.
How to Use the Watches and Timepieces KPI Dashboard in Excel Step by Step?
Follow these steps:
-
Enter first month in cell E1 in Actual sheet
-
Input Actual numbers
-
Enter Target numbers
-
Input Previous Year numbers
-
Update KPI Definitions if needed
-
Go to Dashboard sheet
-
Select Month from cell D3
-
Analyze performance
Therefore, within minutes, you get complete insights.
Who Can Use This Dashboard?
This dashboard suits:
-
Watch Retail Stores
-
Luxury Timepiece Brands
-
Smartwatch Companies
-
Distributors
-
Manufacturers
-
E-commerce Watch Sellers
Whether you run one store or 50 outlets, this template works effectively.
Why Choose Excel Instead of Complex BI Software?
Click to Purchases Watches and Timepieces KPI Dashboard in Excel
Many businesses hesitate to adopt BI tools because:
-
High subscription cost
-
Complex implementation
-
Need for technical knowledge
However, Excel offers:
-
Flexibility
-
Familiar interface
-
Easy customization
-
Quick deployment
Therefore, Excel remains the most practical solution for small and mid-sized businesses.
How Does This Dashboard Support Growth Strategy?
Growth requires measurement.
This dashboard helps you:
-
Identify high-performing models
-
Eliminate slow-moving inventory
-
Increase profit margins
-
Optimize pricing strategy
-
Improve operational efficiency
When you track 15+ KPIs regularly, performance improves naturally.
Conclusion
The watches and timepieces industry demands precision. Therefore, your reporting system must also operate with accuracy.
A Watches and Timepieces KPI Dashboard in Excel gives you:
-
Complete performance visibility
-
Clear comparisons
-
Visual trend analysis
-
Strategic insights
Instead of relying on scattered spreadsheets, you can manage everything in one structured dashboard.
If you want to improve profitability, optimize inventory, and track sales performance effectively, this dashboard becomes your essential business tool.
Frequently Asked Questions (FAQs)
1️⃣ What is a Watches and Timepieces KPI Dashboard in Excel?
It is a ready-to-use Excel template that helps track sales, profit, inventory, and operational KPIs for watch businesses.
2️⃣ Can I customize the KPIs?
Yes. You can add or modify KPIs in the KPI Definition sheet.
3️⃣ Does the dashboard calculate MTD and YTD automatically?
Yes. Once you enter data correctly, the dashboard updates automatically.
4️⃣ Do I need advanced Excel skills?
No. Basic Excel knowledge is enough.
5️⃣ Can small retailers use this dashboard?
Yes. Even single-store retailers can use it effectively.
6️⃣ How often should I update the dashboard?
You should update it monthly. However, weekly updates improve control.
7️⃣ Is this dashboard suitable for luxury watch brands?
Yes. It works for both luxury and mid-range watch businesses.
Visit our YouTube channel to learn step-by-step video tutorials