Web development agencies operate in a fast-moving and highly competitive market. Clients expect fast delivery, clean code, strong UX, and measurable results. However, many agencies still depend on scattered spreadsheets and manual reports. As a result, leaders struggle to track revenue, project timelines, team performance, and client satisfaction in real time.So, how can a web development agency gain full control over performance?You need a Web Development Agencies KPI Dashboard in Power BI.This ready-to-use dashboard centralizes all important KPIs into one powerful reporting system. Moreover, it connects with an Excel data source, which makes it easy to update and manage. Therefore, agency owners, project managers, and operations teams can make faster and smarter decisions.
Click to buy Web Development Agencies KPI Dashboard in Power BI
What Is a Web Development Agencies KPI Dashboard in Power BI?
A Web Development Agencies KPI Dashboard in Power BI is an interactive business intelligence tool that tracks key performance indicators for web agencies. It transforms raw Excel data into visual insights. Consequently, decision-makers can monitor targets, compare trends, and improve results without wasting time.
Instead of reviewing long Excel sheets, you can:
- Track MTD and YTD performance instantly
- Compare current year vs previous year
- Identify target meets and target misses
- Drill down into KPI definitions and formulas
- Analyze trends using dynamic charts
Because Power BI updates visuals automatically, you always stay informed.
Why Do Web Development Agencies Need a KPI Dashboard?
Web agencies manage multiple projects, clients, developers, and deadlines. Therefore, they must monitor performance at different levels.
However, without a structured KPI system:
- You miss project delays
- You overlook revenue leakage
- You fail to track billable utilization
- You struggle to measure client retention
- You react late to performance issues
On the other hand, when you implement a KPI dashboard:
- You gain complete visibility
- You improve accountability
- You increase profitability
- You make proactive decisions
Therefore, a KPI dashboard becomes a strategic tool, not just a reporting file.
Overview of Web Development Agencies KPI Dashboard in Power BI
This dashboard includes 3 interactive pages inside the Power BI Desktop file:
- Summary Page
- KPI Trend Page
- KPI Definition Page (Drill Through – Hidden)
Additionally, the dashboard uses an Excel file as a data source. Therefore, you can manage data easily without complex systems.
Let us understand each page step by step.
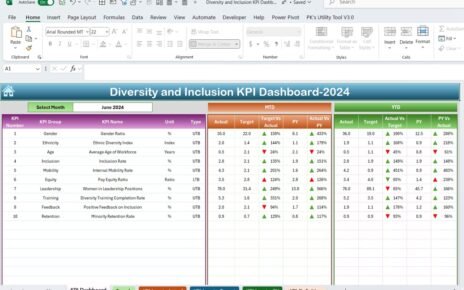
Summary Page
The Summary Page works as the main interface of the dashboard. It gives a complete performance overview in one glance.
Top Section – Smart Slicers
At the top, you see:
- Month Slicer
- KPI Group Slicer
Because of these slicers, you can filter performance by specific months or KPI categories. Therefore, you can focus on exactly what matters.
KPI Cards – Quick Performance Snapshot
Below the slicers, you see three important KPI cards:
- Total KPIs Count
- MTD Target Meet Count
- MTD Target Missed Count
These cards help you instantly understand overall performance. For example, if the Target Missed count increases, you can immediately investigate the issue.
Detailed KPI Table – Complete Performance Breakdown
Below the cards, you see a detailed performance table. This table contains the following columns:
KPI Number
Shows the sequence number of the KPI.
KPI Group
Shows the category such as:
- Financial
- Project Delivery
- Client Performance
- Operational
- Team Productivity
KPI Name
Displays the exact KPI title.
Unit
Indicates measurement units such as:
- %
- Hours
- USD
- Count
Type
Defines whether the KPI is:
- LTB (Lower the Better)
- UTB (Upper the Better)
This classification helps interpret results correctly.
MTD (Month-to-Date) Performance Columns
The dashboard tracks MTD performance clearly.
Actual CY MTD
Shows the actual value for the current year month-to-date.
Target CY MTD
Shows the target value for the same period.
MTD Icon
Displays:
- ▲ Green icon for positive performance
- ▼ Red icon for negative performance
Because of visual icons, you can identify issues quickly.
Target Vs Act. (MTD)
Calculated as:
Actual MTD / Target MTD
This percentage shows how close you are to achieving the target.
PY MTD
Displays previous year MTD value.
CY Vs PY (MTD)
Calculated as:
Current Year MTD / Previous Year MTD
Therefore, you can measure growth year over year.
YTD (Year-to-Date) Performance Columns
Similarly, the dashboard tracks YTD performance.
Actual CY YTD
Current year actual YTD value.
Target CY YTD
Current year YTD target.
YTD Icon
Shows ▲ or ▼ based on performance.
Target Vs Act. (YTD)
Calculated as:
Actual YTD / Target YTD
PY YTD
Previous year YTD value.
CY Vs PY (YTD)
Calculated as:
Current Year YTD / Previous Year YTD
Therefore, you can evaluate long-term performance trends.

Click to buy Web Development Agencies KPI Dashboard in Power BI
KPI Trend Page
The KPI Trend Page focuses on visual analysis.
On this page, you see:
- Two combo charts
- KPI selection slicer on the left
What Do the Combo Charts Show?
The charts display:
- Current Year Actual
- Previous Year Actual
- Target Values
For both:
- MTD
- YTD
Because combo charts combine bar and line visuals, you can compare trends clearly.
For example:
- You can check if revenue grows steadily.
- You can see if targets remain realistic.
- You can analyze seasonal performance.
Therefore, this page helps you take strategic decisions.

Click to buy Web Development Agencies KPI Dashboard in Power BI
KPI Definition
The KPI Definition Page works as a drill-through page.
Although the dashboard hides this page, you can access it from the Summary page.
On this page, you can see:
- KPI Formula
- KPI Definition
- KPI Type
- Unit of Measurement
Because of this feature, you maintain clarity and transparency. Moreover, new team members can understand KPIs easily.
To return to the main page, simply click the back button at the top left corner.

Click to buy Web Development Agencies KPI Dashboard in Power BI
Excel Data Structure – How to Maintain the Dashboard?
The dashboard uses an Excel file as the data source. Therefore, you can manage data without technical complexity.
You need to maintain three worksheets:
Input_Actual Sheet
Here, you fill:
- KPI Name
- Month (First date of month)
- MTD Value
- YTD Value
This sheet captures real performance data.

Click to buy Web Development Agencies KPI Dashboard in Power BI
Input_Target Sheet
Here, you fill:
- KPI Name
- Month (First date of month)
- MTD Target
- YTD Target
Because targets remain separate, you can update them without affecting actual data.
KPI Definition Sheet
Here, you fill:
- KPI Number
- KPI Group
- KPI Name
- Unit
- Formula
- Definition
- Type (LTB or UTB)
This structure keeps the dashboard organized.
Advantages of Web Development Agencies KPI Dashboard in Power BI
Now let us explore the major benefits.
Real-Time Visibility
You can monitor performance instantly. Therefore, you avoid surprises at month-end.
Improved Accountability
When everyone sees KPI performance, teams take ownership.
Better Client Management
You can track:
- Project deadlines
- Budget variance
- Client retention
- Revenue growth
As a result, you improve service quality.
Data-Driven Decisions
Instead of guessing, you use clear data trends.
Easy Excel Integration
Because the dashboard connects with Excel, you do not need complex databases.
Clear Visual Indicators
Green and red icons highlight performance instantly.
Best Practices for the Web Development Agencies KPI Dashboard in Power BI
To maximize value, follow these best practices:
Define Clear KPIs
Choose KPIs that align with agency goals such as:
- Revenue Growth %
- Billable Utilization %
- Project Completion Rate
- Client Retention Rate
Update Data Regularly
Update the Excel file monthly. Otherwise, the dashboard will not reflect true performance.
Review MTD and YTD Together
MTD shows short-term progress. However, YTD shows long-term direction. Therefore, analyze both.
Use KPI Groups Wisely
Categorize KPIs into groups. This approach improves clarity.
Monitor Target Missed KPIs First
Focus on red indicators. Then create corrective action plans.
Keep Targets Realistic
Unrealistic targets reduce motivation. Therefore, set achievable benchmarks.
Conduct Monthly Review Meetings
Use the dashboard during leadership meetings. Discuss performance and action plans.
How Can This Dashboard Improve Profitability?
This dashboard directly impacts profitability.
Because you track:
- Revenue targets
- Project efficiency
- Cost control
- Team productivity
You can identify weak areas quickly. Moreover, you can optimize pricing, improve resource allocation, and reduce delays.
As a result, your agency increases margins and strengthens growth.
Who Should Use This Dashboard?
This dashboard benefits:
- Agency Owners
- Project Managers
- Finance Teams
- Operations Heads
- Business Analysts
Whether your agency is small or large, this dashboard supports structured growth.
Conclusion
Web development agencies must track performance carefully. However, manual reports waste time and create confusion. Therefore, you need a structured and automated reporting solution.
The Web Development Agencies KPI Dashboard in Power BI offers:
- Clear KPI tracking
- MTD and YTD comparison
- Year-over-year analysis
- Drill-through definitions
- Excel-based data management
Because of its interactive design, you gain full performance control. Moreover, you improve accountability, efficiency, and profitability.
If you want smarter decisions and faster growth, this dashboard gives you the right foundation.
Frequently Asked Questions with Answers
What is a KPI Dashboard for Web Development Agencies?
A KPI dashboard is a reporting tool that tracks key performance indicators like revenue, project delivery, utilization, and growth using Power BI visuals.
Why should web agencies use Power BI instead of Excel alone?
Power BI provides interactive visuals, automatic calculations, slicers, and dynamic comparisons. Therefore, it offers deeper insights than static Excel reports.
What does LTB and UTB mean?
LTB means Lower the Better, such as project delay hours.
UTB means Upper the Better, such as revenue growth percentage.
How often should we update the dashboard?
You should update the Excel data monthly. However, weekly updates improve monitoring.
Can small agencies use this dashboard?
Yes. Small agencies benefit greatly because they gain structured visibility and performance control.
Does this dashboard require advanced technical skills?
No. You only need to update Excel sheets. Power BI automatically refreshes visuals.
What type of KPIs should web agencies track?
You should track:
- Revenue Growth
- Project Completion Rate
- Billable Utilization
- Client Retention
- Profit Margin
Visit our YouTube channel to learn step-by-step video tutorials
Watch the step-by-step video tutorial:
Click to buy Web Development Agencies KPI Dashboard in Power BI