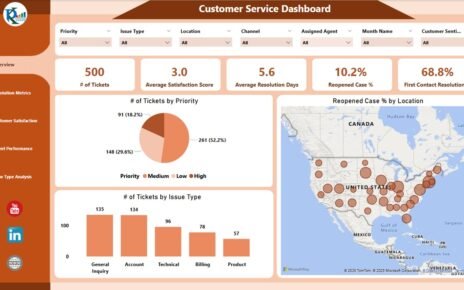
Effective customer service is crucial for ensuring customer satisfaction, loyalty, and business growth. The Customer Service Dashboard in Power BI
In today’s fast-paced work environment, keeping your workplace organized is more than just a good habit—it’s a necessity. A tidy,
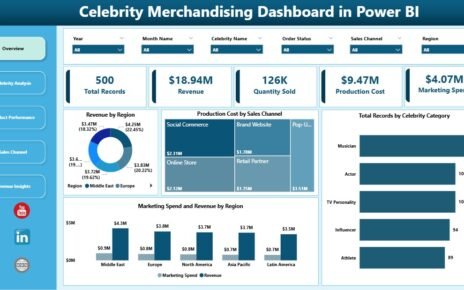
Celebrity merchandising is a fast-moving business. Trends change quickly, fan demand shifts overnight, and product performance can vary from one