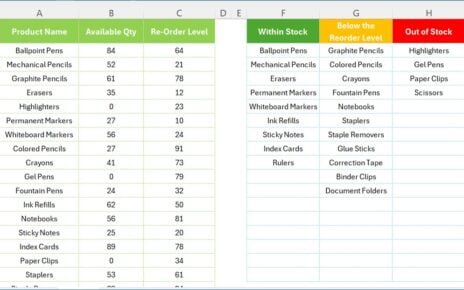
Managing inventory effectively is crucial for any business that deals with physical products. Keeping track of stock levels ensures that
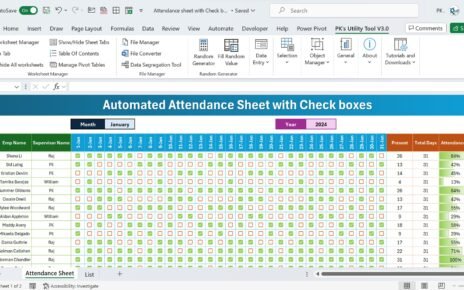
Introduction: Why Opt for Excel in Managing Attendance? Imagine a tool that simplifies attendance tracking – that's Excel for you!
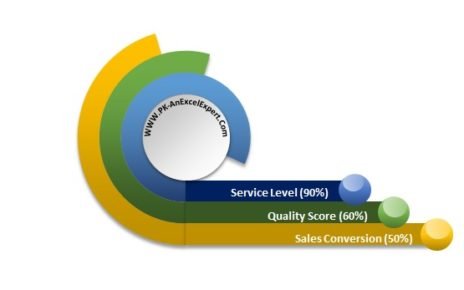
In this article you will learn how to create a beautiful multilayered Doughnut Chart for KPI metrics. In this chart