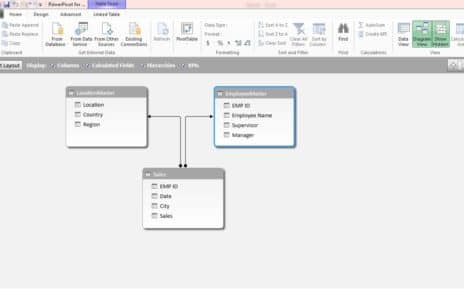
In this article, we have explained, how to create relationship in Power Pivot data model. We have taken 2 dimension
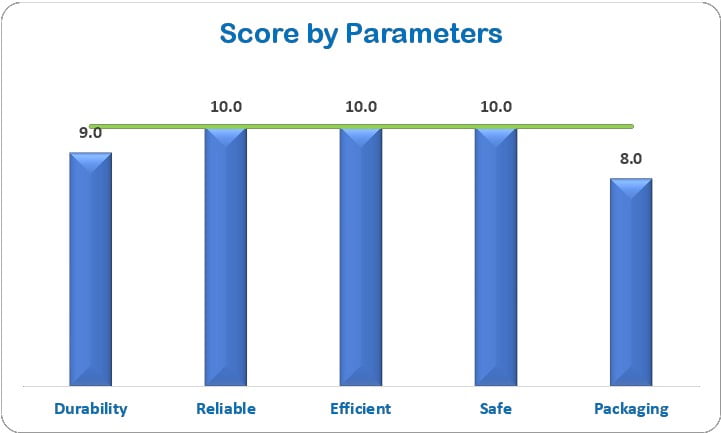
Data analysis is an essential aspect of any business. It helps to make informed decisions based on evidence and trends.
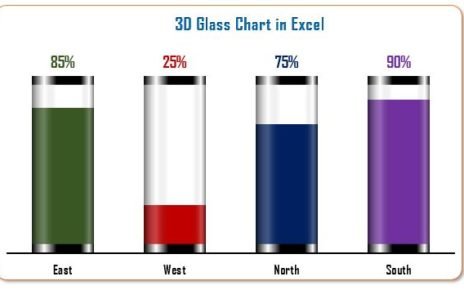
I am back with a very innovative and Informative chart that is 3D Glass Chart in Excel. This chart can