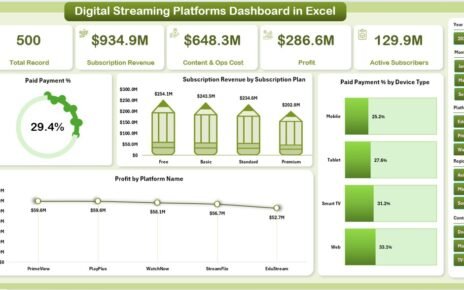
Wildlife conservation plays a critical role in maintaining ecological balance and ensuring the survival of endangered species. In today’s data-driven world, conservation efforts need more than passion and commitment; they require actionable insights backed by accurate data. This is where a Wildlife Conservation KPI Dashboard in Power BI becomes a powerful tool.
By using Power BI, conservationists, researchers, and organizations can analyze key performance indicators (KPIs) and make informed decisions. This article explores the features, advantages, best practices, and real-world applications of the Wildlife Conservation KPI Dashboard, providing a complete guide for anyone involved in conservation management.
Click to Purchases Wildlife Conservation KPI Dashboard in Power BI
What Is a Wildlife Conservation KPI Dashboard in Power BI?
A Wildlife Conservation KPI Dashboard in Power BI is a dynamic and interactive tool that consolidates conservation data into a single view. Instead of manually tracking numbers in spreadsheets, the dashboard provides clear visuals and insights into key conservation metrics. It helps teams monitor species population trends, resource allocation, habitat restoration efforts, and progress against conservation targets.
This dashboard is designed to be ready-to-use and connects to data stored in Excel files. Once the data is loaded, users can track monthly and yearly progress, compare actual results with targets, and identify areas that need attention.
Key Features of the Wildlife Conservation KPI Dashboard
This dashboard is structured with three powerful pages in the Power BI desktop application file. Each page offers unique insights and allows users to analyze data from different perspectives.
Summary Page

The Summary Page serves as the main hub of the dashboard. At the top, users find slicers to filter data by Month and KPI Group. This enables quick customization of the view without overwhelming the user with too much data at once.
Key highlights of the Summary Page:
KPI Cards:
- Total KPIs Count
- MTD (Month-to-Date) Target Met Count
- MTD Target Missed Count
Detailed KPI Table:
The table captures critical information including:
- KPI Number – Unique identifier for each KPI.
- KPI Group – Category such as Species Population, Habitat, or Anti-Poaching.
- KPI Name – Name of the metric (e.g., Number of Endangered Species Protected).
- Unit – Measurement unit such as %, number, or area (sq. km).
- Type – KPI type (UTB – Upper the Better, LTB – Lower the Better).
- Actual CY MTD – Current year’s actual performance for the month-to-date.
- Target CY MTD – Current year’s target for MTD.
- MTD Icon – Visual arrow icons in green/red to indicate progress.
- Target vs Actual (MTD) – Percentage comparison of MTD actuals vs targets.
- PY MTD – Previous year’s MTD value for the same period.
- CY vs PY (MTD) – Percentage comparison of current vs previous year.
- Actual CY YTD – Year-to-date actual values.
- Target CY YTD – Year-to-date target values.
- YTD Icon – Green/red arrow indicators for YTD performance.
- Target vs Actual (YTD) – Percentage comparison for YTD.
- PY YTD – Previous year’s YTD values.
- CY vs PY (YTD) – Comparison of current year vs previous year YTD.
This page provides a holistic view of both short-term and long-term conservation performance.
KPI Trend Page

The KPI Trend Page focuses on visualization. Instead of tables, this page uses combo charts to track trends.
-
Two combo charts display Actual Numbers for Current Year, Previous Year, and Targets for both MTD and YTD.
-
A slicer on the left allows users to filter by KPI name and examine trends for specific metrics.
This page is crucial for identifying whether conservation initiatives are moving in the right direction over time. For instance, users can see whether anti-poaching patrols have reduced illegal activities year after year or whether species populations are recovering.
Click to Purchases Wildlife Conservation KPI Dashboard in Power BI
KPI Definition Page

The KPI Definition Page is designed for deeper analysis.
-
It is a hidden drill-through page that users can access from the Summary Page.
-
It displays detailed definitions and formulas for each KPI, ensuring transparency.
-
Users can return to the main page by clicking the back button in the top-left corner.
This page is especially valuable for teams and stakeholders who need to understand the logic behind every metric.
Excel Data Structure for the Dashboard
The Wildlife Conservation KPI Dashboard uses Excel as the primary data source, making it easy for conservation teams to update and manage. The Excel file contains three key worksheets:
Input_Actual Sheet Tab
- Records actual performance data.
- Fields include KPI Name, Month (first date of the month), MTD numbers, and YTD numbers.
Input_Target Sheet Tab
- Records target values for each KPI.
- Fields include KPI Name, Month, MTD numbers, and YTD numbers.
KPI Definition Sheet Tab
- Contains metadata such as KPI Number, KPI Group, KPI Name, Unit, Formula, Definition, and KPI Type (UTB or LTB).
By separating actuals, targets, and definitions, the dashboard ensures clarity and consistency in reporting.
Why Use Power BI for Wildlife Conservation?
Wildlife conservation generates diverse data—from species population counts to anti-poaching patrol statistics. Managing this data manually can be overwhelming. Power BI solves this challenge by offering:
-
Interactive visuals that highlight trends and comparisons.
-
Custom slicers and filters for targeted analysis.
-
Automated updates when new Excel data is uploaded.
-
Drill-through functionality for detailed KPI exploration.
With Power BI, organizations can move from reactive tracking to proactive conservation planning.
Advantages of the Wildlife Conservation KPI Dashboard
The Wildlife Conservation KPI Dashboard offers numerous benefits to conservation teams and stakeholders:
✅ Centralized View of KPIs – Consolidates all conservation metrics in one place.
✅ Real-Time Monitoring – Tracks monthly and yearly progress effectively.
✅ Better Decision-Making – Provides actionable insights for resource allocation.
✅ Performance Comparison – Compares actuals with targets and previous year results.
✅ Enhanced Accountability – Assigns responsibility through KPI groups and definitions.
✅ User-Friendly – Easy to use with Excel as the input source.
Opportunities for Improvement
While the Wildlife Conservation KPI Dashboard is highly effective, there are areas where it can evolve further:
🔹 Integration with IoT Devices – Automated sensors in wildlife reserves can provide real-time updates.
🔹 Mobile Accessibility – Enhancing the dashboard for mobile devices would improve field usability.
🔹 Inclusion of GIS Mapping – Adding maps for habitat and patrol coverage would enrich the visuals.
🔹 Predictive Analytics – Leveraging AI to predict species population trends.
🔹 Collaboration Tools – Allowing multiple stakeholders to interact and comment directly on the dashboard.
Best Practices for Using the Wildlife Conservation KPI Dashboard
To get the most value from the dashboard, organizations should follow these best practices:
📊 Define Clear KPIs – Ensure that every KPI has a clear definition and measurable target.
🔄 Update Data Regularly – Keep the Excel data current for accurate reporting.
🎯 Align KPIs with Goals – Connect every KPI to conservation objectives such as species protection or habitat restoration.
🔍 Use Filters Effectively – Slice data by group or month to focus on specific areas.
📈 Review Trends Frequently – Monitor the KPI Trend Page to spot early warning signs.
👥 Engage Stakeholders – Share insights with field teams, donors, and policymakers.
⚙️ Expand Features Gradually – Start with basic metrics and add complexity as needed.
Real-World Applications of the Dashboard
The Wildlife Conservation KPI Dashboard can be applied in several contexts:
-
National Parks – Monitor poaching incidents, patrol frequency, and species population growth.
-
Wildlife NGOs – Track donor-funded projects and ensure accountability.
-
Research Institutions – Analyze long-term ecological trends for publications.
-
Government Agencies – Align conservation programs with policy and compliance goals.
-
Corporate CSR Programs – Showcase impact of corporate funding on conservation.
Conclusion
The Wildlife Conservation KPI Dashboard in Power BI transforms conservation data into actionable insights. By consolidating actuals, targets, and historical comparisons, it empowers organizations to monitor progress, allocate resources effectively, and strengthen conservation outcomes.
With continuous improvement and adoption of best practices, this dashboard can become the backbone of modern wildlife conservation strategies.
Frequently Asked Questions (FAQs)
1. What is a Wildlife Conservation KPI Dashboard?
A Wildlife Conservation KPI Dashboard is a reporting tool in Power BI that tracks and visualizes conservation metrics like species counts, habitat restoration, and anti-poaching efforts.
2. Can I update the dashboard with new data?
Yes. The dashboard uses Excel as a data source. By updating the Excel sheets with new actuals and targets, the dashboard refreshes automatically.
3. Who can benefit from this dashboard?
NGOs, research institutes, government agencies, and CSR teams involved in wildlife conservation can all benefit from using the dashboard.
4. How does it compare to traditional reporting?
Unlike static reports, the Power BI dashboard is interactive, visual, and real-time, making analysis faster and more accurate.
5. Can the dashboard work offline?
Yes, the Power BI desktop file can work offline. However, for sharing and collaboration, publishing to the Power BI Service is recommended.
6. Is the dashboard customizable?
Absolutely. You can add new KPIs, modify visuals, and even integrate advanced features like GIS mapping or AI forecasting.
Visit our YouTube channel to learn step-by-step video tutorials
Click to Purchases Wildlife Conservation KPI Dashboard in Power BI