Wind energy continues to grow rapidly across the world. Governments, private investors, and renewable energy companies invest heavily in wind farms to produce clean electricity and reduce carbon emissions. However, running a wind energy farm successfully requires more than installing turbines. Operators must continuously monitor performance, efficiency, costs, and operational reliability.
Many wind farm managers still rely on scattered reports, manual spreadsheets, or multiple software tools. As a result, teams struggle to identify performance issues quickly. Decision-making becomes slow, and operational efficiency drops.
Therefore, organizations increasingly adopt structured performance monitoring systems. One powerful solution is the Wind Energy Farms KPI Dashboard in Excel — a ready-to-use analytics tool that centralizes all operational metrics in one interactive environment.
In this detailed guide, you will learn:
-
What a Wind Energy Farms KPI Dashboard is
-
Why KPI tracking matters in renewable energy
-
Dashboard structure and worksheets explained
-
Key performance indicators for wind farms
-
Advantages and best practices
-
Implementation steps
-
Frequently asked questions
Let’s explore how this dashboard transforms wind farm performance management.
Click to Purchases Wind Energy Farms KPI Dashboard in Excel
What Is a Wind Energy Farms KPI Dashboard in Excel?
A Wind Energy Farms KPI Dashboard in Excel is a performance monitoring system designed to track operational, financial, and efficiency metrics of wind energy farms using structured Key Performance Indicators (KPIs).
Instead of reviewing multiple reports, managers analyze performance through a single dashboard interface.
The dashboard allows users to:
-
Compare Actual vs Target performance
-
Monitor Month-to-Date (MTD) and Year-to-Date (YTD) results
-
Analyze trends over time
-
Compare current performance with previous year results
-
Identify operational gaps quickly
Because the system runs entirely in Microsoft Excel, organizations implement it without expensive software investments.
Why Is KPI Monitoring Important for Wind Energy Farms?
Wind farms operate under complex conditions. Weather variability, turbine efficiency, maintenance schedules, and grid performance all affect energy output.
Without KPI tracking, organizations face several challenges:
-
Reduced turbine utilization
-
Higher downtime
-
Increased maintenance costs
-
Poor energy forecasting
-
Revenue loss
However, KPI dashboards provide clarity.
Key Benefits of KPI Monitoring
-
Improve operational visibility
-
Detect performance decline early
-
Optimize maintenance planning
-
Increase energy production efficiency
-
Support data-driven decisions
Therefore, KPI tracking becomes essential for sustainable wind energy operations.
Click to Purchases Wind Energy Farms KPI Dashboard in Excel
Overview of the Wind Energy Farms KPI Dashboard Structure
This ready-to-use dashboard contains 7 structured worksheets, each serving a specific purpose.
1️⃣ Home Sheet – Navigation Center
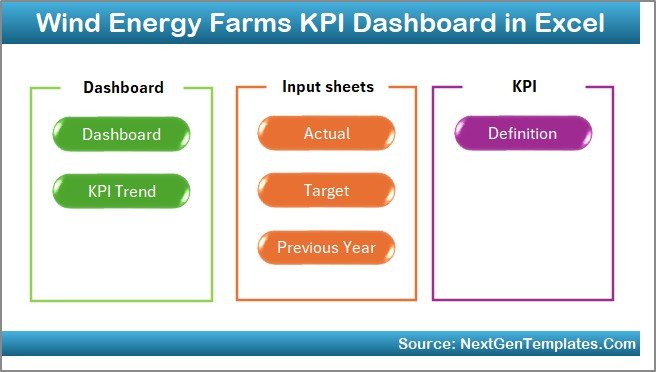
The Home Sheet works as an index page.
Key features include:
-
Six navigation buttons
-
Quick access to all sheets
-
User-friendly interface
-
Structured workflow navigation
Instead of searching manually, users jump directly to required analysis pages.
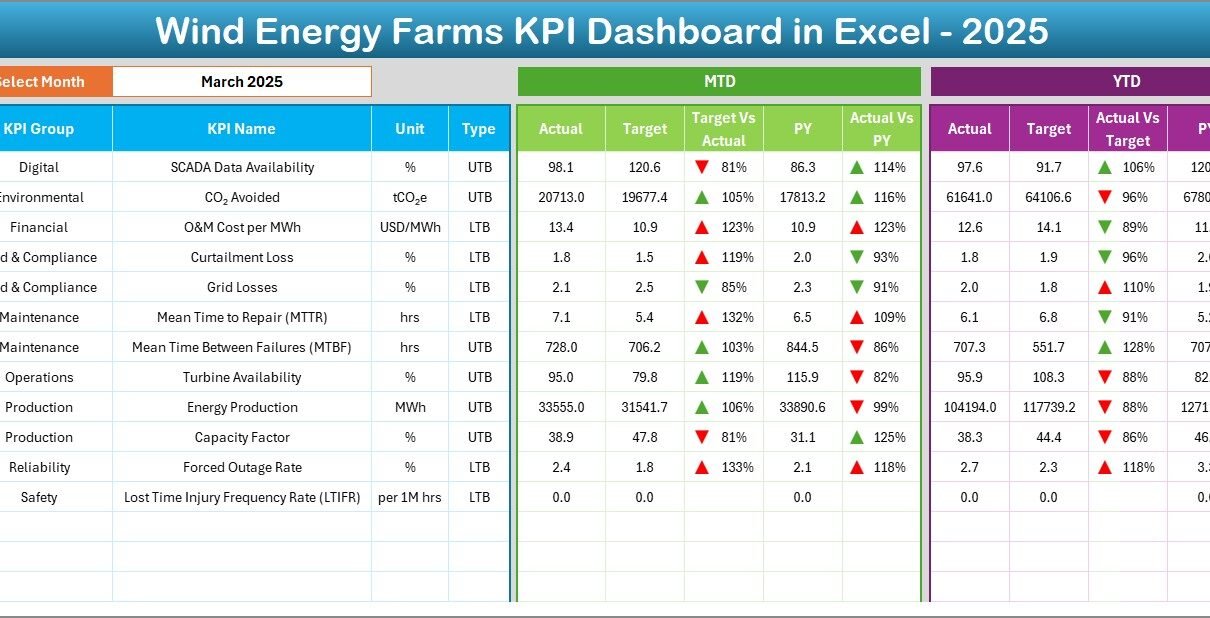
2️⃣ Dashboard Sheet – Main Performance View
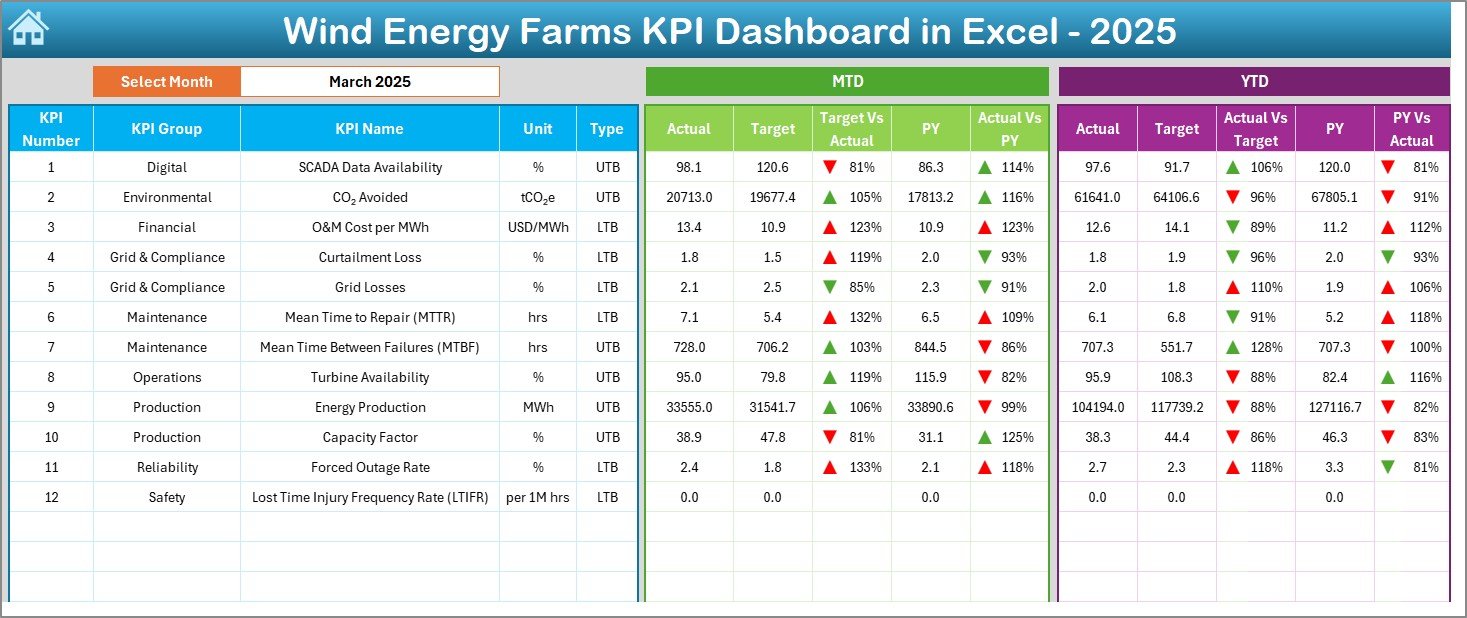
The Dashboard Sheet acts as the core analytics page.
Here, users see all KPIs in one view.
Main Features
-
Month selection dropdown (Cell D3)
-
Automatic dashboard updates
-
MTD performance tracking
-
YTD performance tracking
-
Actual vs Target comparison
-
Previous Year comparison
-
Conditional formatting indicators
Visual arrows instantly show performance direction:
-
🔼 Improvement
-
🔽 Decline
As a result, managers understand performance within seconds.
Click to Purchases Wind Energy Farms KPI Dashboard in Excel
3️⃣ KPI Trend Sheet – Performance Analysis
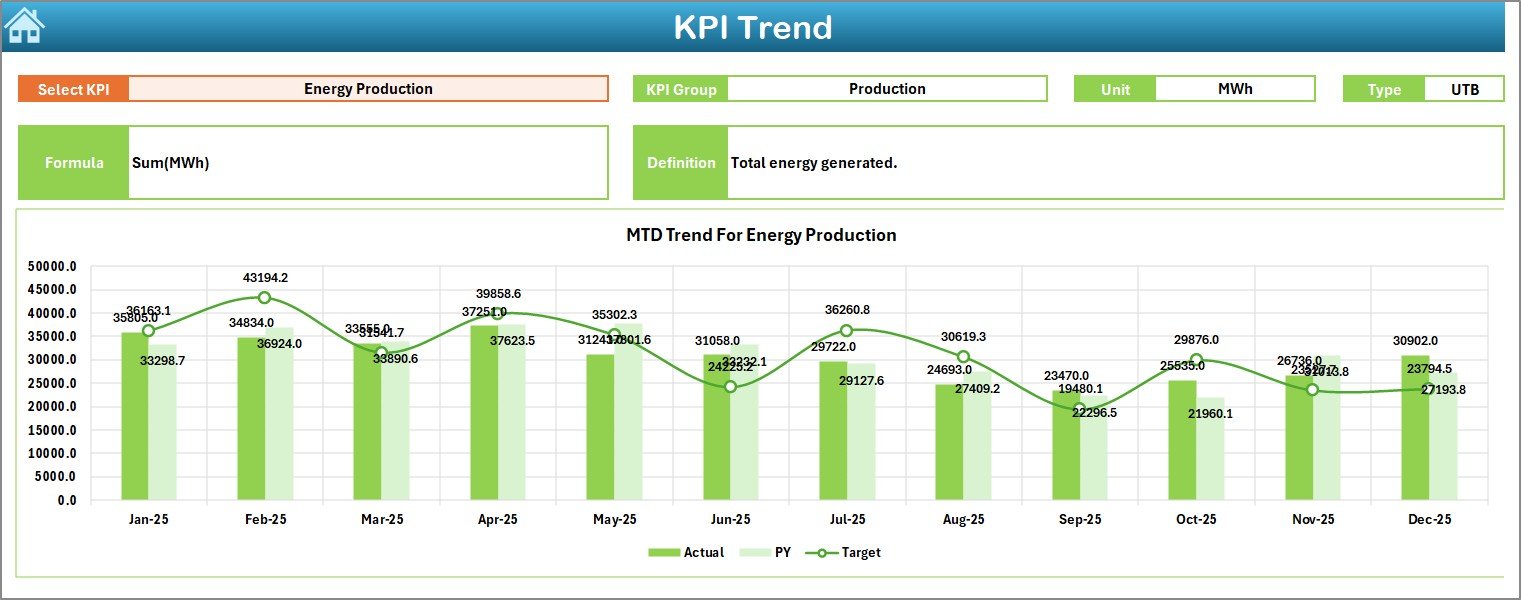
The KPI Trend Sheet focuses on detailed KPI evaluation.
Users select a KPI from the dropdown in cell C3.
The sheet displays:
-
KPI Group
-
Unit of Measurement
-
KPI Type (Lower or Higher is better)
-
KPI Formula
-
KPI Definition
Additionally, trend charts visualize:
-
MTD Actual vs Target vs Previous Year
-
YTD Actual vs Target vs Previous Year
Therefore, teams analyze performance patterns easily.
Click to Purchases Wind Energy Farms KPI Dashboard in Excel
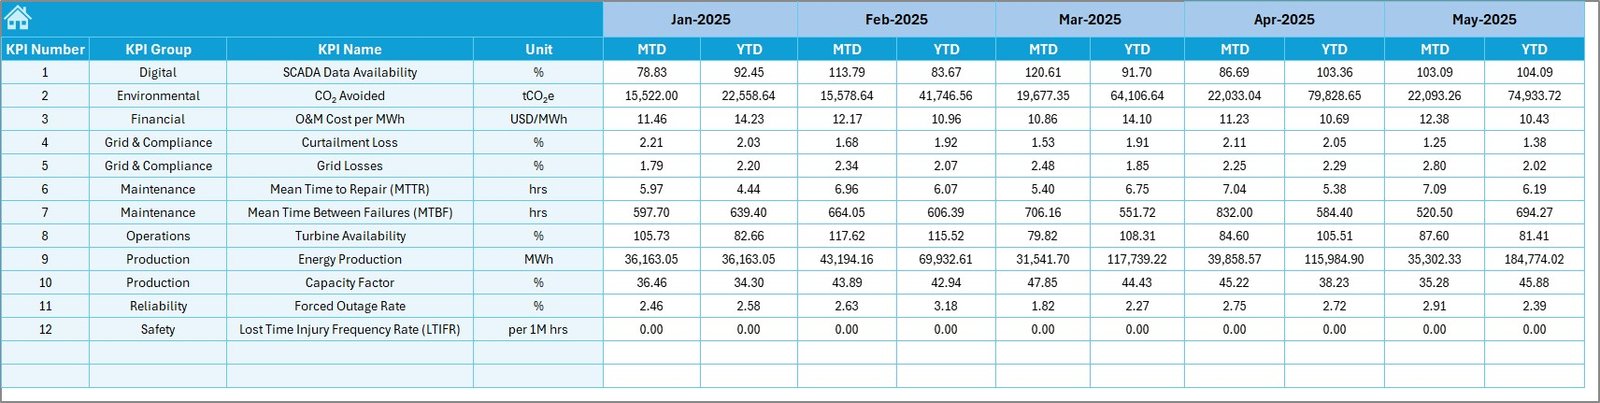
4️⃣ Actual Numbers Input Sheet – Data Entry
This sheet captures real operational data.
Users simply:
-
Enter monthly actual values
-
Select the first month of the year in cell E1
The dashboard automatically updates all calculations.
Because of structured input design, data errors reduce significantly.
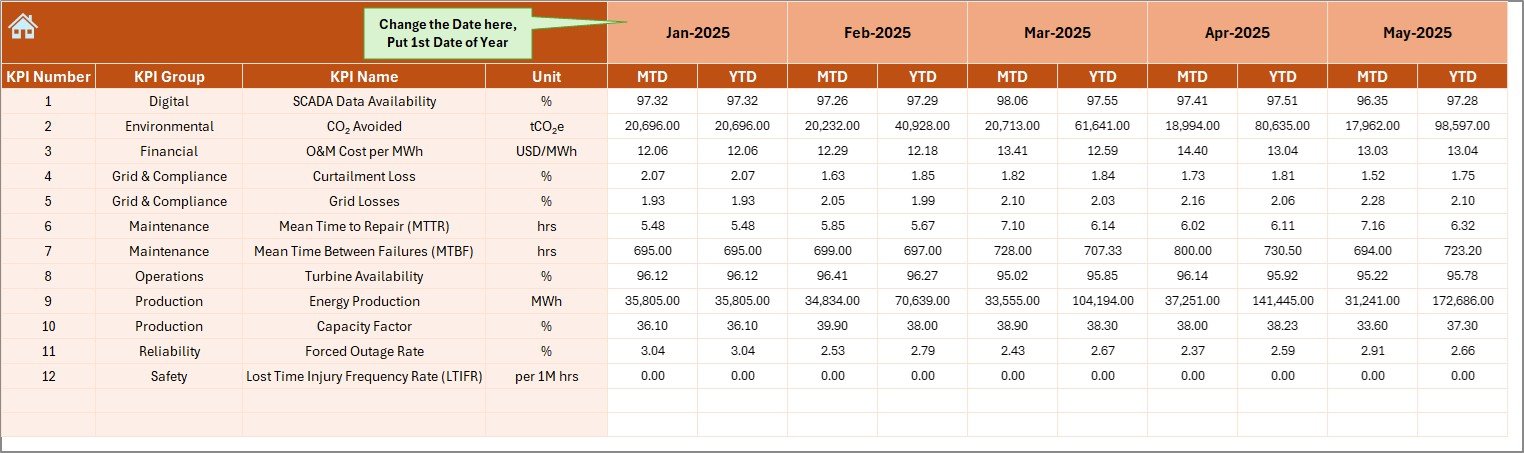
5️⃣ Target Sheet – Performance Goals
The Target Sheet stores planned KPI values.
Users enter:
-
Monthly targets
-
MTD targets
-
YTD targets
This structure enables accurate performance comparison.
Click to Purchases Wind Energy Farms KPI Dashboard in Excel
6️⃣ Previous Year Number Sheet – Historical Benchmarking
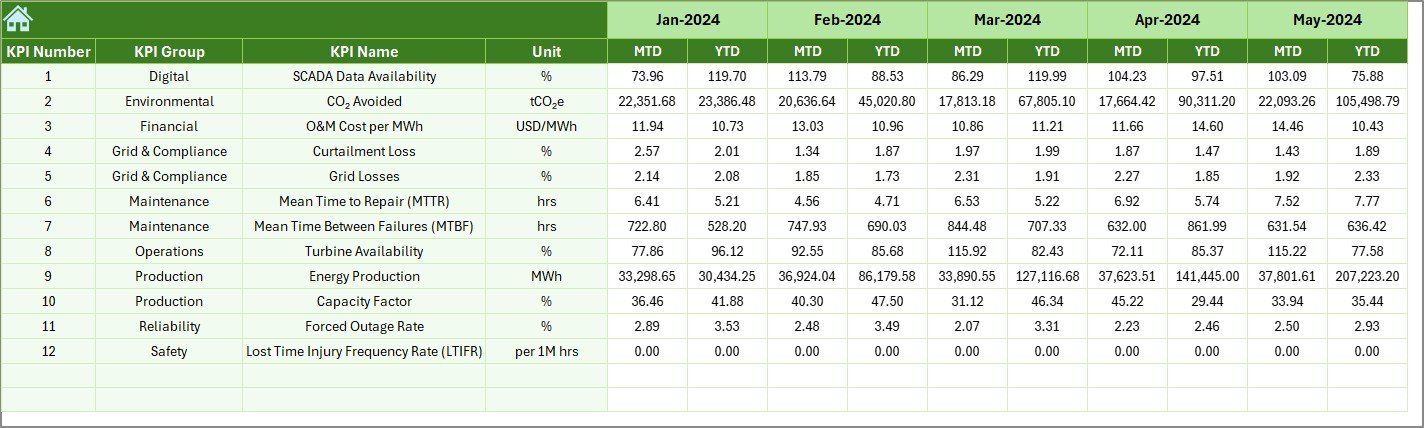
Historical comparison helps organizations measure improvement.
In this sheet, users input previous-year numbers similar to current-year data.
The dashboard then compares:
-
Current vs Historical performance
-
Growth trends
-
Operational progress
7️⃣ KPI Definition Sheet – KPI Documentation
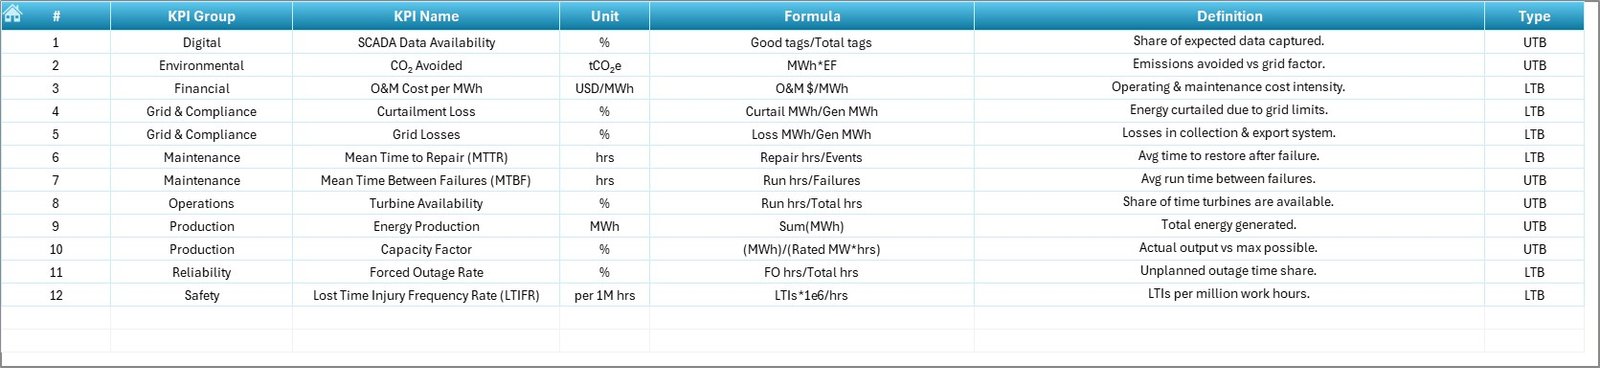
The KPI Definition Sheet acts as a knowledge repository.
Users define:
-
KPI Name
-
KPI Group
-
Unit
-
Formula
-
KPI Definition
This ensures consistency across teams and departments.
Click to Purchases Wind Energy Farms KPI Dashboard in Excel
Which KPIs Should Wind Energy Farms Track?
Wind farms measure multiple performance areas. Below are common KPI categories.
Operational KPIs
-
Turbine Availability (%)
-
Capacity Factor
-
Energy Output (MWh)
-
Downtime Hours
-
Grid Availability
Maintenance KPIs
-
Mean Time Between Failures (MTBF)
-
Maintenance Cost per Turbine
-
Repair Time
-
Scheduled Maintenance Compliance
Financial KPIs
-
Revenue per MW
-
Operating Cost per MWh
-
ROI of Wind Farm
-
Energy Sales Performance
Environmental KPIs
-
Carbon Emission Reduction
-
Renewable Energy Contribution
-
Energy Efficiency Ratio
Tracking these KPIs helps operators maintain optimal performance.
Click to Purchases Wind Energy Farms KPI Dashboard in Excel
How Does the Dashboard Improve Decision-Making?
A structured KPI dashboard transforms raw data into actionable insights.
Faster Decisions
Managers instantly identify underperforming KPIs.
Improved Forecasting
Historical comparisons support accurate energy predictions.
Better Resource Allocation
Teams prioritize maintenance activities based on KPI signals.
Enhanced Transparency
All stakeholders view consistent performance metrics.
Consequently, organizations operate more efficiently.
Click to Purchases Wind Energy Farms KPI Dashboard in Excel
Advantages of Wind Energy Farms KPI Dashboard in Excel
✅ Centralized Performance Monitoring
All KPIs appear in one unified dashboard.
✅ Easy to Use
Excel familiarity reduces training requirements.
✅ Real-Time Analysis
Month selection updates the entire dashboard instantly.
✅ Data Accuracy
Structured input sheets minimize manual errors.
✅ Cost Effective
No additional software investment required.
✅ Visual Insights
Conditional formatting highlights performance instantly.
✅ Historical Comparison
Previous-year benchmarking improves planning.
How to Implement the Wind Energy KPI Dashboard?
Follow these steps for smooth implementation.
Step 1: Define KPIs
Identify operational and financial KPIs relevant to your wind farm.
Step 2: Enter KPI Definitions
Populate the KPI Definition sheet.
Step 3: Input Target Values
Add monthly performance targets.
Step 4: Add Actual Data
Update actual performance numbers regularly.
Step 5: Input Previous Year Data
Add historical values for comparison.
Step 6: Analyze Dashboard
Use dropdown filters to review performance monthly.
Click to Purchases Wind Energy Farms KPI Dashboard in Excel
Best Practices for Wind Energy Farms KPI Dashboard in Excel
Maintain Data Consistency
Always follow the same data format.
Update Data Regularly
Enter data monthly or weekly for accurate analysis.
Focus on Critical KPIs
Avoid tracking too many metrics.
Use Trend Analysis
Study patterns rather than single-month results.
Review Targets Periodically
Adjust targets based on operational improvements.
Train Team Members
Ensure all users understand KPI definitions.
Validate Data Inputs
Check entries before analysis.
Common Challenges and How to Overcome Them
Data Entry Errors
Use validation rules and dropdowns.
KPI Overload
Select only actionable KPIs.
Lack of Adoption
Provide team training sessions.
Inconsistent Reporting
Standardize KPI definitions.
Who Can Use This Dashboard?
This dashboard benefits multiple stakeholders:
-
Wind farm operators
-
Renewable energy companies
-
Energy analysts
-
Operations managers
-
Maintenance teams
-
Sustainability consultants
-
Energy investors
Why Choose Excel for Renewable Energy Dashboards?
Many organizations wonder why Excel remains popular.
Flexibility
Users customize dashboards easily.
Accessibility
Almost every organization already uses Excel.
Integration
Excel connects with multiple data sources.
Scalability
Organizations expand dashboards as operations grow.
Therefore, Excel remains a practical analytics platform.
Click to Purchases Wind Energy Farms KPI Dashboard in Excel
Future of KPI Dashboards in Wind Energy
Wind energy analytics continues evolving.
Future dashboards may include:
-
IoT turbine integration
-
Automated data refresh
-
AI-based predictive maintenance
-
Real-time weather analytics
-
Cloud-based reporting
However, Excel dashboards still provide a strong foundation for performance monitoring.
Conclusion: Transform Wind Farm Performance with KPI Tracking
Wind energy farms must operate efficiently to remain profitable and sustainable. Without structured monitoring, organizations struggle to identify operational problems early.
The Wind Energy Farms KPI Dashboard in Excel simplifies performance tracking by combining operational, financial, and historical metrics into one powerful tool.
Because it offers interactive analysis, visual indicators, and structured data management, organizations gain clarity and control over wind farm performance.
Ultimately, this dashboard helps teams:
-
Improve energy production
-
Reduce downtime
-
Optimize maintenance
-
Enhance decision-making
As renewable energy continues expanding, KPI-driven management becomes essential for long-term success.
Click to Purchases Wind Energy Farms KPI Dashboard in Excel
Frequently Asked Questions (FAQs)
1. What is a Wind Energy KPI Dashboard?
It is an Excel-based tool that tracks performance metrics of wind farms using structured KPIs.
2. Can beginners use this dashboard?
Yes. Anyone familiar with Excel can operate it easily.
3. How often should I update the dashboard?
You should update it monthly or whenever new operational data becomes available.
4. Does the dashboard support historical comparison?
Yes. It compares current performance with previous-year data.
5. Can I customize KPIs?
Yes. You can modify KPI definitions and formulas.
6. Is Excel suitable for large wind farms?
Yes. Excel handles structured KPI monitoring effectively for many operations.
7. Does the dashboard require programming knowledge?
No. Users operate it without coding skills.
Click to Purchases Wind Energy Farms KPI Dashboard in Excel
Visit our YouTube channel to learn step-by-step video tutorials