Women empowerment NGOs work tirelessly to create opportunities, protect rights, and build stronger communities. They train women, support education, promote entrepreneurship, and improve healthcare access. However, while the mission drives passion, performance tracking often creates confusion.
Many NGOs still manage reports in separate Excel sheets. As a result, leaders spend hours consolidating data. Moreover, donors expect structured reporting. At the same time, boards demand measurable outcomes.
So, how can women empowerment NGOs track performance professionally, visually, and accurately?
The answer is simple.
You need a Women Empowerment NGOs KPI Dashboard in Power BI.
This ready-to-use Power BI dashboard transforms raw Excel data into powerful, interactive insights. Instead of manually compiling reports, you can monitor targets, actual performance, trends, and year-over-year comparisons in seconds.
In this complete guide, you will learn:
-
What a Women Empowerment NGOs KPI Dashboard in Power BI is
-
Why NGOs need it
-
A complete explanation of all 3 dashboard pages
-
How the Excel data structure works
-
Key KPIs you can track
-
Advantages of this dashboard
-
Best practices for implementation
-
Frequently Asked Questions
Let’s explore everything step by step.
Click to Purchases Women Empowerment NGOs KPI Dashboard in Power BI
What Is a Women Empowerment NGOs KPI Dashboard in Power BI?
A Women Empowerment NGOs KPI Dashboard in Power BI is an interactive reporting solution that helps NGOs track performance indicators visually and dynamically.
Instead of static reports, this dashboard provides:
-
Real-time KPI monitoring
-
MTD and YTD comparisons
-
Target vs Actual tracking
-
Previous Year comparison
-
Drill-through KPI details
-
Interactive slicers
Therefore, leadership teams gain instant clarity. Moreover, they identify performance gaps quickly.
Why Do Women Empowerment NGOs Need a Power BI Dashboard?
NGOs manage multiple programs, beneficiaries, funding streams, and awareness campaigns. However, without structured data visualization, performance tracking becomes slow and inefficient.
Here’s why Power BI makes a difference:
-
You centralize data in one place
-
You reduce manual reporting time
-
You improve donor transparency
-
You strengthen accountability
-
You make faster decisions
Furthermore, interactive dashboards increase presentation impact during board meetings and donor reviews.
As a result, your NGO operates like a data-driven organization.
Complete Explanation of All 3 Power BI Pages
Click to Purchases Women Empowerment NGOs KPI Dashboard in Power BI
Now let’s understand how this Women Empowerment NGOs KPI Dashboard works inside Power BI.
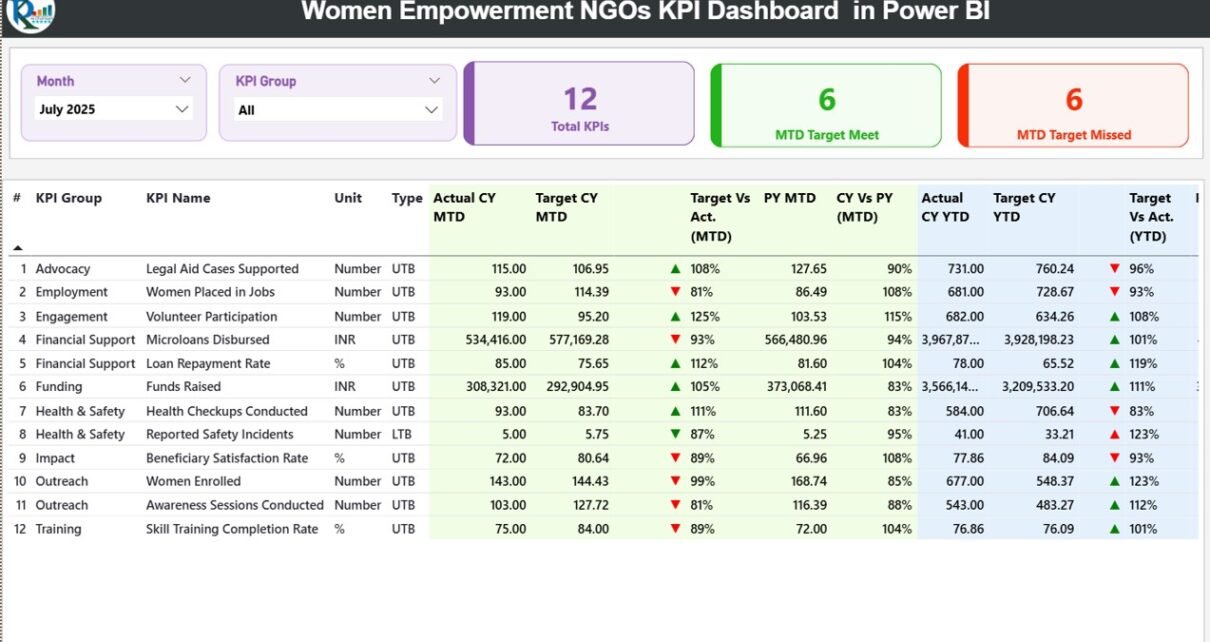
1️⃣ Summary Page – The Main Performance Overview
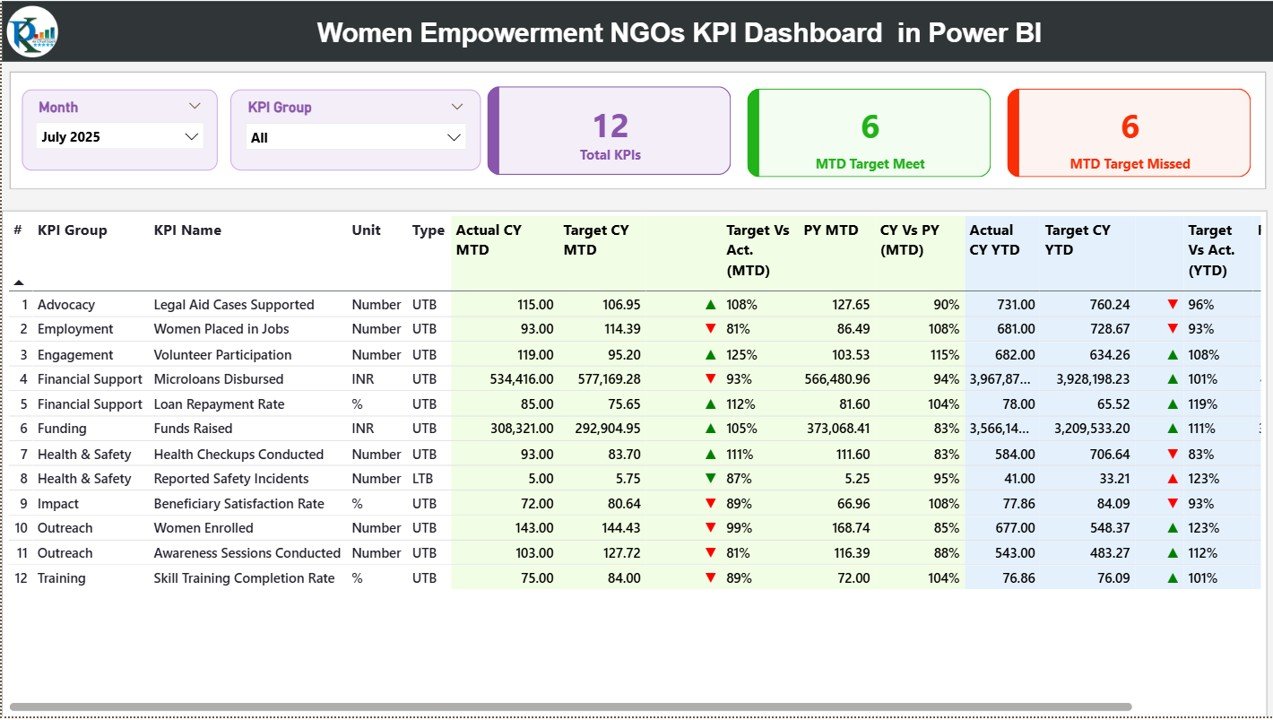
The Summary Page acts as the core control center of the dashboard.
What Do You See at the Top?
-
Month Slicer
-
KPI Group Slicer
-
3 KPI Cards:
-
Total KPI Count
-
MTD Target Meet Count
-
MTD Target Missed Count
-
Because of slicers, you can filter data instantly. Therefore, the dashboard updates automatically.
Detailed KPI Table – Complete Performance Breakdown
Below the KPI cards, you see a detailed performance table that includes:
KPI Information Columns:
-
KPI Number
-
KPI Group
-
KPI Name
-
Unit
-
Type (LTB – Lower the Better / UTB – Upper the Better)
MTD Performance Columns:
-
Actual CY MTD
-
Target CY MTD
-
MTD Icon (▲ Green / ▼ Red)
-
Target vs Act. (MTD %)
-
PY MTD
-
CY vs PY (MTD %)
YTD Performance Columns:
-
Actual CY YTD
-
Target CY YTD
-
YTD Icon (▲ Green / ▼ Red)
-
Target vs Act. (YTD %)
-
PY YTD
-
CY vs PY (YTD %)
Formula Logic Used:
-
Target vs Actual = Actual ÷ Target
-
CY vs PY = Current Year ÷ Previous Year
Because the dashboard uses icons and color coding, you instantly identify strong and weak KPIs.
As a result, you act quickly.
Click to Purchases Women Empowerment NGOs KPI Dashboard in Power BI
2️⃣ KPI Trend Page – Visualize Performance Movement
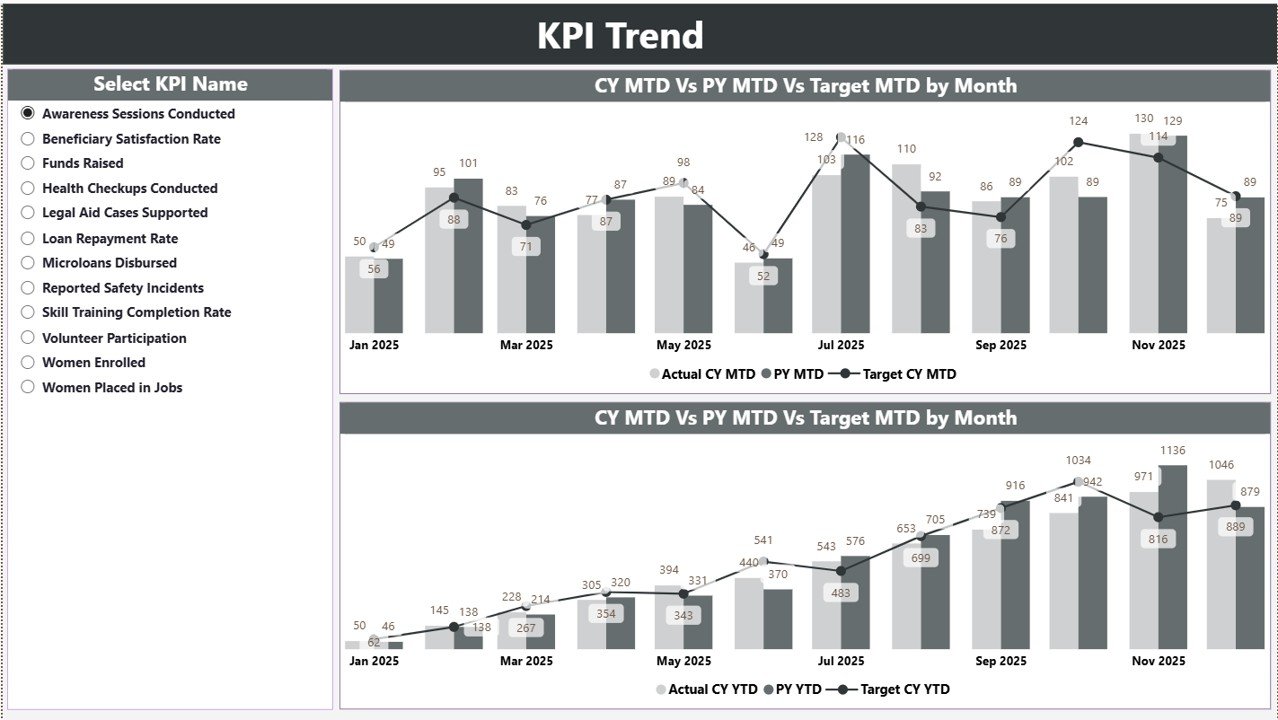
While the Summary Page shows snapshot performance, the KPI Trend page shows trends.
What Does This Page Include?
-
KPI Name slicer on the left
-
2 Combo Charts:
-
MTD Actual vs Target vs Previous Year
-
YTD Actual vs Target vs Previous Year
-
These combo charts help you:
-
Identify growth patterns
-
Spot declining performance
-
Compare targets visually
-
Analyze seasonal variations
For example:
-
Does employment placement increase after skill training programs?
-
Does beneficiary participation rise during certain months?
-
Do fundraising campaigns improve YTD results?
Because Power BI updates dynamically, every slicer selection refreshes visuals instantly.
3️⃣ KPI Definition Page – Drill-Through Details
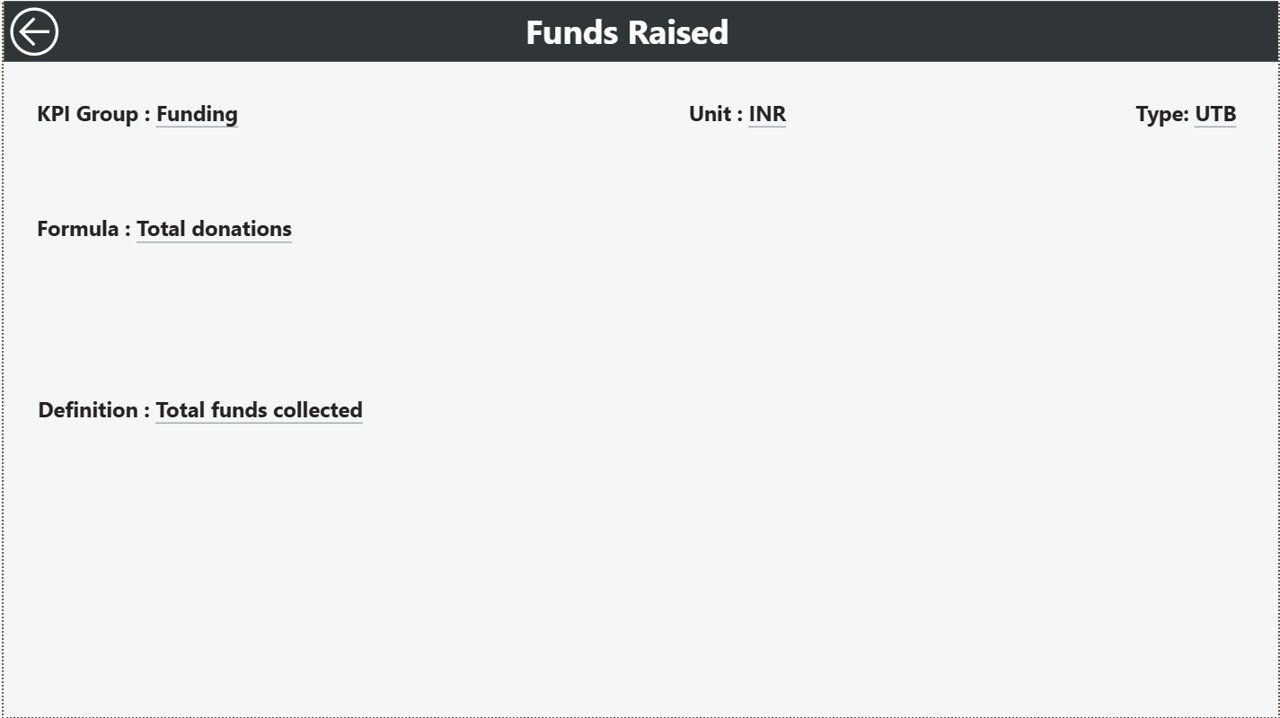
The KPI Definition page remains hidden by default. However, you can drill through from the Summary page.
This page shows:
-
KPI Formula
-
KPI Definition
-
KPI Group
-
Measurement Unit
-
KPI Type
Therefore, stakeholders understand calculation logic clearly.
To return to the main page, simply click the back button on the top left corner.
This design improves transparency and reduces confusion.
Click to Purchases Women Empowerment NGOs KPI Dashboard in Power BI
Excel Data Structure – The Foundation of the Dashboard
Although Power BI handles visualization, you must enter data in Excel properly.
The dashboard connects to an Excel file that includes 3 worksheets.
1️⃣ Input_Actual Sheet
Here, you enter:
-
KPI Name
-
Month (First date of month)
-
MTD Number
-
YTD Number
Because the dashboard reads this file directly, you must enter accurate data.
2️⃣ Input_Target Sheet
In this sheet, you enter:
-
KPI Name
-
Month
-
MTD Target
-
YTD Target
Clear targets improve accountability.
3️⃣ KPI Definition Sheet
Here, you define:
-
KPI Number
-
KPI Group
-
KPI Name
-
Unit
-
Formula
-
Definition
-
Type (LTB or UTB)
Because this sheet controls drill-through logic, you must maintain consistency.
What KPIs Can Women Empowerment NGOs Track?
Every NGO focuses on different objectives. However, most track KPIs across common impact categories.
Beneficiary Impact KPIs
-
Number of Women Beneficiaries
-
Literacy Improvement Rate
-
Skill Training Completion Rate
-
Employment Placement Rate
-
Income Growth Percentage
Program Efficiency KPIs
-
Dropout Rate
-
Program Completion Rate
-
Cost per Beneficiary
-
Volunteer Participation Rate
Financial KPIs
-
Fund Utilization Rate
-
Administrative Expense Ratio
-
Donation Growth Rate
-
Budget Variance
Community Engagement KPIs
-
Awareness Campaign Reach
-
Event Participation Rate
-
Satisfaction Score
When you track these KPIs visually, you strengthen performance management.
Click to Purchases Women Empowerment NGOs KPI Dashboard in Power BI
Advantages of Women Empowerment NGOs KPI Dashboard in Power BI
Now let’s explore the key benefits.
1️⃣ Real-Time Insights
Power BI refreshes visuals instantly. Therefore, leaders see updated data immediately.
2️⃣ Stronger Donor Reporting
Interactive visuals improve presentations. Moreover, donors trust structured data.
3️⃣ Faster Decision-Making
Because the dashboard highlights missed targets clearly, management takes quick action.
4️⃣ Improved Transparency
Drill-through functionality explains formulas and KPI definitions clearly.
5️⃣ Professional Visualization
Unlike static spreadsheets, Power BI creates modern and dynamic visuals.
6️⃣ Better Strategic Planning
Trend analysis helps leadership align programs with long-term goals.
Click to Purchases Women Empowerment NGOs KPI Dashboard in Power BI
Best Practices for the Women Empowerment NGOs KPI Dashboard in Power BI
Even though the dashboard works efficiently, you must follow best practices.
1️⃣ Maintain Clean Excel Data
Avoid inconsistent month formats. Always use the first date of the month.
2️⃣ Define Clear KPI Ownership
Assign responsibility for each KPI. This improves accountability.
3️⃣ Review Monthly and Quarterly
While monthly updates help operations, quarterly reviews support strategy.
4️⃣ Align KPIs with Mission Goals
Track metrics that directly support women empowerment outcomes.
5️⃣ Train Staff on Power BI Usage
Ensure leadership and program managers understand slicers and drill-through.
6️⃣ Use Dashboard in Donor Meetings
Visual insights increase credibility during funding discussions.
How Does This Dashboard Improve NGO Performance?
When NGOs implement structured KPI dashboards:
-
They focus on measurable impact
-
They reduce reporting delays
-
They improve program efficiency
-
They increase donor confidence
-
They strengthen long-term sustainability
Moreover, they shift from reactive reporting to proactive management.
Conclusion
Women empowerment NGOs create social transformation. However, impact without measurement limits growth. You must track, analyze, and communicate results clearly.
The Women Empowerment NGOs KPI Dashboard in Power BI provides:
-
Interactive KPI tracking
-
Target vs Actual comparison
-
MTD and YTD monitoring
-
Previous year analysis
-
Drill-through KPI explanations
As a result, your NGO operates with clarity, professionalism, and confidence.
If you want to enhance transparency, improve accountability, and present impact convincingly, this dashboard becomes your essential tool.
Click to Purchases Women Empowerment NGOs KPI Dashboard in Power BI
Frequently Asked Questions (FAQs)
1️⃣ What makes Power BI better than Excel dashboards for NGOs?
Power BI provides interactive visuals, dynamic slicers, and drill-through features that enhance reporting experience.
2️⃣ Do I need technical skills to use this dashboard?
No. You only need basic knowledge to update Excel data. Power BI handles visualization automatically.
3️⃣ Can small NGOs use this dashboard?
Yes. Both small and large NGOs can benefit from structured KPI tracking.
4️⃣ How often should NGOs update data?
You should update data monthly. However, frequent updates improve accuracy.
5️⃣ What does LTB and UTB mean?
LTB means Lower the Better. UTB means Upper the Better.
6️⃣ Why compare with previous year data?
Because historical comparison shows growth, improvement, and long-term impact.
7️⃣ Can this dashboard improve funding opportunities?
Yes. Structured reporting increases donor trust and credibility.
Click to Purchases Women Empowerment NGOs KPI Dashboard in Power BI
Visit our YouTube channel to learn step-by-step video tutorials