The wood and furniture manufacturing industry runs on precision, timing, and cost control. Every day, factories handle raw wood, manage production lines, monitor delivery schedules, and control expenses. However, many manufacturers still depend on scattered spreadsheets. As a result, managers struggle to track profitability, production efficiency, and on-time delivery performance.
So, how can you monitor everything in one place?
You need a Wood and Furniture Manufacturing Dashboard in Excel.
Click to Purchases Wood and Furniture Manufacturing Dashboard in Excel
This ready-to-use Excel dashboard gives you full control over production cost, revenue, profit margin, order tracking, and delivery performance. Moreover, it helps you make faster decisions because you can see trends clearly. Instead of wasting hours consolidating reports, you can analyze everything instantly.
In this detailed guide, you will learn:
-
What a Wood and Furniture Manufacturing Dashboard in Excel is
-
Why manufacturers need it
-
A complete explanation of all 5 dashboard pages
-
Advantages of using this dashboard
-
Best practices for implementation
-
Frequently Asked Questions with Answers
Let us explore everything step by step.
What Is a Wood and Furniture Manufacturing Dashboard in Excel?
A Wood and Furniture Manufacturing Dashboard in Excel is a structured performance monitoring tool designed specifically for furniture factories and wood processing units. It converts raw production data into meaningful charts, KPI cards, and visual insights.
Instead of manually calculating profit or delivery performance, you can:
-
Track Profit Margin %
-
Compare Production Cost vs Revenue
-
Monitor On-Time Delivery %
-
Analyze Orders by Product Type
-
Evaluate performance by Wood Type and Production Line
Furthermore, you can filter results using slicers on the right side of each page. Therefore, you gain control and flexibility at the same time.
How Does the Wood and Furniture Manufacturing Dashboard Work?
This dashboard works inside the Excel desktop application. Moreover, it uses Pivot Tables and Pivot Charts for dynamic reporting.
It contains:
-
A structured Data Sheet
-
A Support Sheet for calculations
-
5 interactive dashboard pages
-
Right-side slicers for filtering
-
KPI cards for quick summary
When you update the data sheet, the dashboard updates automatically. Consequently, you always see the latest numbers.
Click to Purchases Wood and Furniture Manufacturing Dashboard in Excel
What Are the 5 Pages of the Wood and Furniture Manufacturing Dashboard?
Now let us understand each page in detail.
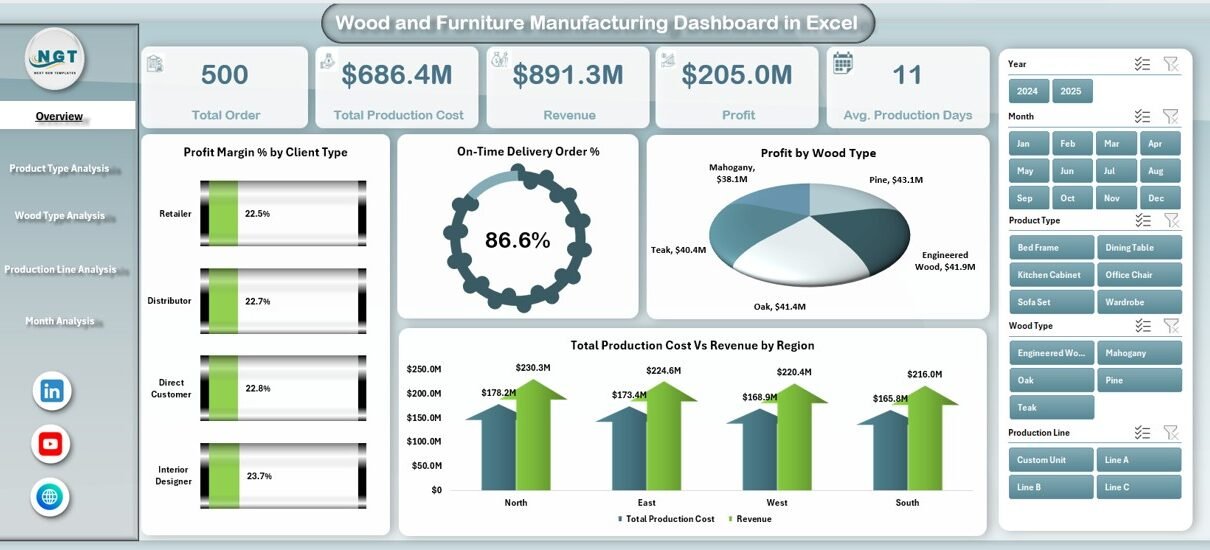
1️⃣ What Does the Overview Page Show?
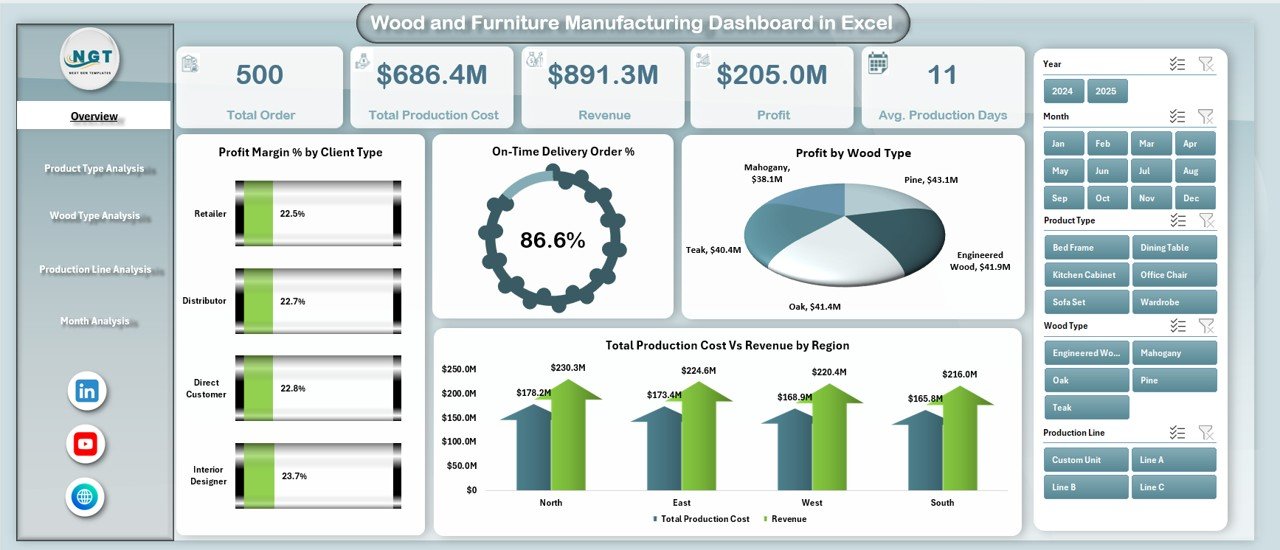
The Overview Page acts as the control center of the dashboard.
On this page, you will find:
-
A page navigator on the left side
-
Right-side slicers for filtering
-
4 KPI cards
-
4 key charts
KPI Cards on Overview Page
The dashboard displays 4 summary cards such as:
-
Total Orders
-
Total Revenue
-
Total Profit
-
On-Time Delivery %
These cards give you a quick performance snapshot. Therefore, you do not need to open multiple sheets.
Charts on Overview Page
The page includes 4 important charts:
-
On-Time Delivery Order %
-
Profit Margin % by Client Type
-
Total Orders by Product Type
-
Total Production Cost vs Revenue by Region
These charts help management understand performance at a glance. For example, if revenue increases but profit margin drops, you can immediately investigate production costs.
2️⃣ What Insights Can You Get from the Product Type Analysis Page?
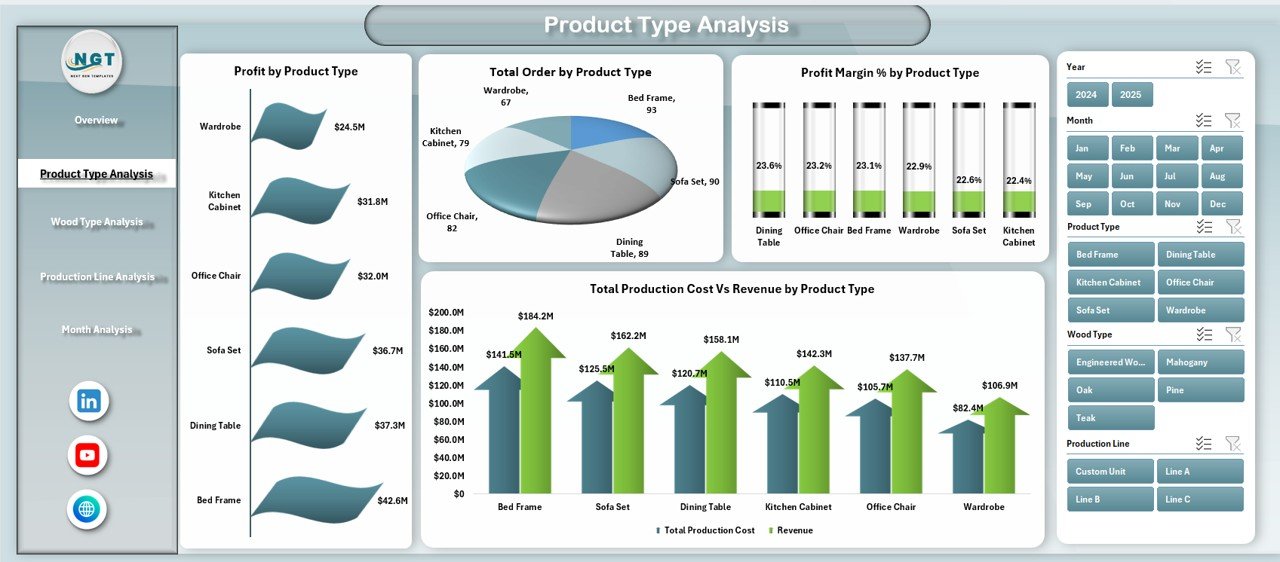
Furniture manufacturers produce multiple product types such as:
-
Chairs
-
Tables
-
Cabinets
-
Beds
-
Office Furniture
-
Custom Designs
Therefore, analyzing product-level performance becomes essential.
Charts in Product Type Analysis
This page includes:
-
Profit Margin % by Product Type
-
Profit by Product Type
-
Total Production Cost vs Revenue by Product Type
-
Total Orders by Product Type
With these visuals, you can identify:
-
Which product generates the highest profit
-
Which product has the lowest margin
-
Which product attracts more orders
As a result, you can adjust pricing, marketing focus, or production capacity.
3️⃣ How Does the Wood Type Analysis Page Help?
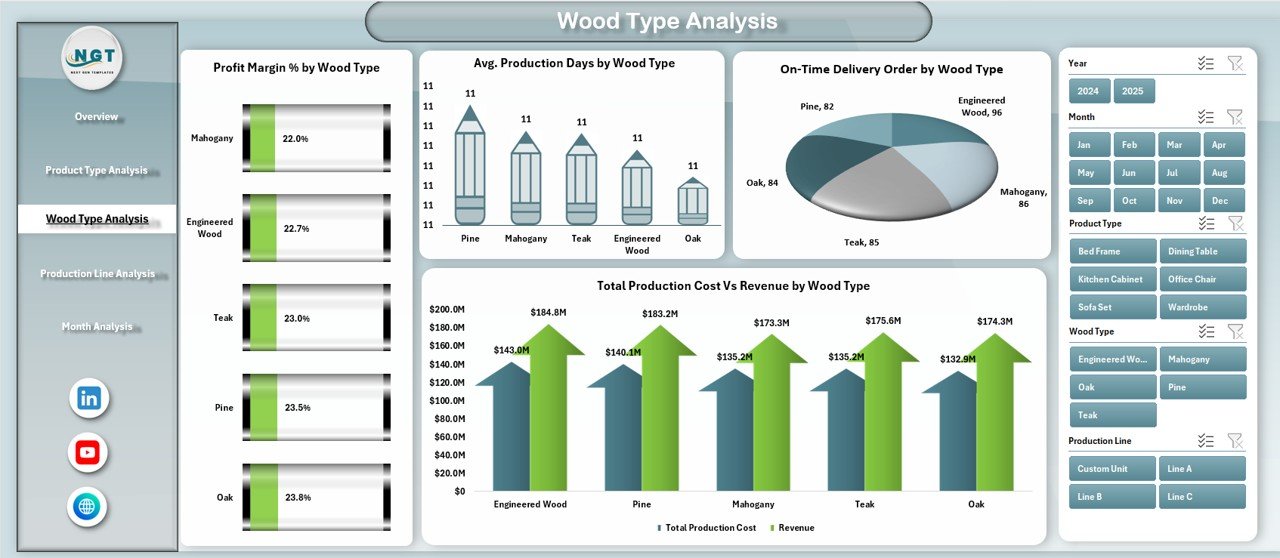
Different wood types have different costs and durability levels. For example:
-
Teak costs more but offers durability.
-
Pine costs less but may reduce margin.
-
Oak balances cost and strength.
Therefore, wood-level analysis becomes critical.
Charts in Wood Type Analysis
This page includes:
-
Profit Margin % by Wood Type
-
Avg. Production Days by Wood Type
-
Total Production Cost vs Revenue by Wood Type
-
On-Time Delivery % by Wood Type
Now you can answer questions like:
-
Does premium wood improve profit?
-
Does certain wood increase production time?
-
Does wood type affect delivery performance?
Consequently, you can optimize raw material selection.
4️⃣ Why Is Production Line Analysis Important?
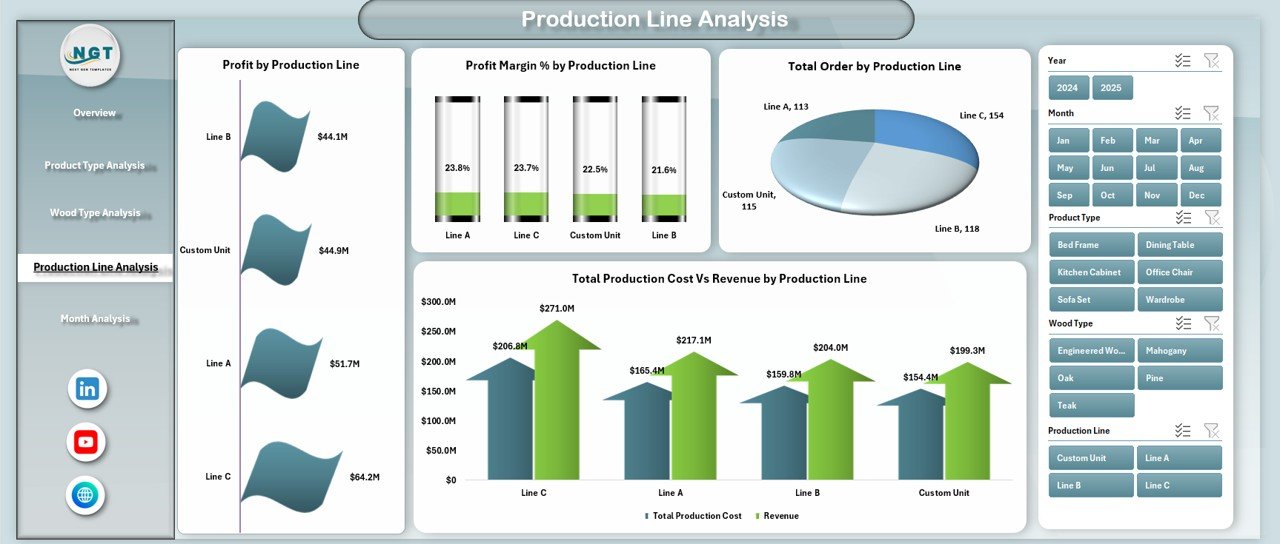
Production lines differ in speed, efficiency, and labor cost. Therefore, you must monitor them closely.
Charts in Production Line Analysis
This page contains:
-
Profit Margin % by Production Line
-
Profit by Production Line
-
Total Production Cost vs Revenue by Production Line
-
Total Orders by Production Line
These charts help you detect:
-
Underperforming lines
-
Cost-heavy production areas
-
High-profit manufacturing units
If one line shows lower margin, you can inspect machine downtime, labor efficiency, or raw material waste.
Click to Purchases Wood and Furniture Manufacturing Dashboard in Excel
5️⃣ What Does the Month Analysis Page Reveal?
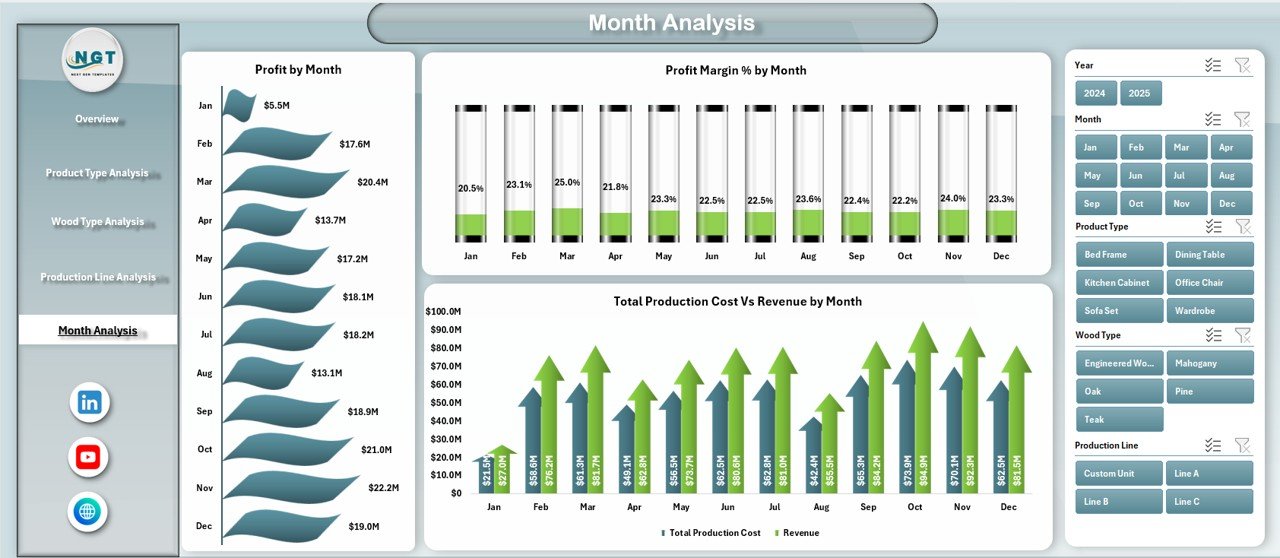
Seasonal trends influence furniture demand. For example:
-
Orders may rise before festive seasons.
-
Corporate orders may increase in financial year-end.
Therefore, month-wise analysis becomes crucial.
Charts in Month Analysis
This page shows:
-
Profit Margin % by Month
-
Profit by Month
-
Total Production Cost vs Revenue by Month
With this data, you can:
-
Detect seasonal demand
-
Plan inventory better
-
Allocate labor efficiently
-
Control monthly cost spikes
What Data Does This Dashboard Use?
The dashboard uses a structured Data Sheet. Typically, it includes:
-
Order ID
-
Order Date
-
Client Type
-
Region
-
Product Type
-
Wood Type
-
Production Line
-
Production Cost
-
Revenue
-
Delivery Date
-
On-Time Delivery Status
-
Production Days
Once you enter data in proper format, the dashboard works automatically.
Advantages of Wood and Furniture Manufacturing Dashboard in Excel
Now let us explore the key benefits.
1️⃣ Centralized Reporting
You can monitor everything in one file. Therefore, you save time and reduce confusion.
2️⃣ Cost Control
You can compare production cost vs revenue instantly. As a result, you detect margin issues early.
3️⃣ Profit Optimization
The dashboard highlights high-profit products and production lines. Consequently, you can focus on profitable segments.
4️⃣ Better Delivery Tracking
You can track On-Time Delivery %. Therefore, you improve customer satisfaction.
5️⃣ Improved Decision-Making
Since charts present visual insights, management can take action quickly.
6️⃣ No Expensive Software Required
You only need Microsoft Excel. Hence, you avoid costly BI tools.
Best Practices for the Wood and Furniture Manufacturing Dashboard
If you want maximum value, follow these best practices.
1️⃣ Maintain Clean Data
Use consistent formats for dates, numbers, and percentages. Moreover, avoid blank rows.
2️⃣ Update Data Regularly
Enter new orders weekly or daily. Therefore, the dashboard reflects real performance.
3️⃣ Use Slicers Smartly
Filter by region, product type, or wood type to uncover deeper insights.
4️⃣ Monitor KPIs Monthly
Review profit margin, production cost, and delivery performance every month.
5️⃣ Train Your Team
Ensure production and finance teams understand how to use the dashboard.
6️⃣ Set Clear Targets
Define realistic targets for profit margin and delivery performance.
How Can This Dashboard Improve Manufacturing Efficiency?
This dashboard improves efficiency in multiple ways.
-
It reduces manual reporting time.
-
It highlights cost-heavy production areas.
-
It reveals slow production lines.
-
It detects delivery issues early.
-
It supports strategic planning.
Therefore, you move from reactive management to proactive management.
Who Should Use the Wood and Furniture Manufacturing Dashboard?
This dashboard suits:
-
Furniture manufacturers
-
Wood processing units
-
Factory managers
-
Operations heads
-
Finance managers
-
Production supervisors
If you manage wood-based manufacturing, this tool will help you track performance clearly.
Why Choose Excel for Manufacturing Dashboards?
Excel offers several advantages:
-
Easy to customize
-
Widely available
-
Supports Pivot Tables
-
Supports slicers
-
Allows automated calculations
-
No additional subscription required
Therefore, Excel remains a powerful reporting tool for small and medium manufacturers.
Conclusion: Why Is the Wood and Furniture Manufacturing Dashboard Essential?
The wood and furniture manufacturing industry demands strong cost control and performance monitoring. However, manual spreadsheets create confusion. Therefore, you need a structured solution.
The Wood and Furniture Manufacturing Dashboard in Excel gives you:
-
Clear profitability insights
-
Delivery performance tracking
-
Product-level analysis
-
Production line monitoring
-
Monthly trend visibility
As a result, you can improve margins, reduce delays, and grow confidently.
If you want structured, visual, and actionable insights, this dashboard delivers exactly that.
Frequently Asked Questions with Answers
1️⃣ What is a Wood and Furniture Manufacturing Dashboard in Excel?
It is an interactive Excel file that tracks production, cost, revenue, profit, and delivery performance using Pivot Charts and slicers.
2️⃣ Can I customize the dashboard?
Yes, you can add new KPIs, charts, or product categories according to your factory needs.
3️⃣ Do I need advanced Excel skills to use it?
No. You only need basic Excel knowledge. Moreover, you can refresh Pivot Tables easily.
4️⃣ How often should I update the data?
You should update the data weekly or monthly. However, daily updates provide better accuracy.
5️⃣ Can this dashboard handle large data?
Yes. Excel can handle thousands of records efficiently if you structure the data properly.
6️⃣ Does it calculate Profit Margin automatically?
Yes. The dashboard uses formulas such as:
Profit Margin % = (Revenue – Production Cost) / Revenue
7️⃣ Can I track performance by region?
Yes. The Overview page includes Production Cost vs Revenue by Region chart.
8️⃣ Why is On-Time Delivery % important?
On-Time Delivery improves customer trust. Moreover, it reduces complaint rates.
9️⃣ Can small manufacturers use this dashboard?
Yes. Small and medium factories benefit greatly because Excel remains cost-effective.
What makes this dashboard different from normal spreadsheets?
Normal spreadsheets show raw numbers. However, this dashboard shows visual insights, comparisons, and trends. Therefore, decision-making becomes faster and smarter.
Visit our YouTube channel to learn step-by-step video tutorials