Managing work orders manually or across multiple spreadsheets quickly creates confusion, delays, and cost overruns. As organizations grow, maintenance teams struggle to track open jobs, control expenses, and measure performance accurately. Because of this, businesses now rely on analytics-driven solutions.
A Work Order Dashboard in Power BI solves this challenge by transforming raw maintenance data into clear, interactive, and actionable insights. Instead of guessing what is happening, decision-makers gain complete visibility into work orders, costs, departments, assets, and trends.
In this detailed guide, you will learn what a Work Order Dashboard in Power BI is, how it works, why it matters, its key pages, advantages, best practices, and FAQs—all explained in simple and clear language.
Click to buy Work Order Dashboard in Power BI
What Is a Work Order Dashboard in Power BI?
A Work Order Dashboard in Power BI is an interactive reporting solution that tracks, analyzes, and visualizes work order data in real time. It helps organizations monitor maintenance activities, costs, priorities, and performance from one centralized dashboard.
Instead of reviewing emails, paper logs, or static Excel files, users interact with live visuals, filters, and KPIs. As a result, maintenance teams respond faster, control costs better, and improve operational efficiency.
Because Power BI supports slicers, charts, and drill-downs, users explore data by:
- Department
- Asset category
- Work order type
- Priority
- Status
- Time period
Why Do Organizations Need a Work Order Dashboard in Power BI?
Many organizations still track work orders manually. However, this approach creates multiple problems over time.
Common challenges without a dashboard
- Delayed response to critical work orders
- Poor visibility into open and completed jobs
- No control over estimated vs actual costs
- Lack of accountability across departments
- Difficult monthly and management reporting
How Power BI fixes these issues
A Work Order Dashboard in Power BI:
- Centralizes all work order data
- Shows real-time status updates
- Highlights cost overruns instantly
- Improves decision-making through visuals
- Saves time spent on manual reporting
Because of these benefits, organizations move from reactive maintenance to proactive control.
How Does a Work Order Dashboard in Power BI Work?
The dashboard connects work order data from Excel, ERP systems, CMMS tools, or databases into Power BI. After data modeling, visuals display KPIs, trends, and comparisons.
Typical workflow
- Load work order data into Power BI
- Clean and transform data using Power Query
- Create measures for KPIs such as total work orders and costs
- Build interactive pages with slicers and charts
- Publish and share the dashboard securely
As data updates, visuals refresh automatically. Therefore, users always see the latest information.
What Are the Key Features of a Work Order Dashboard in Power BI?
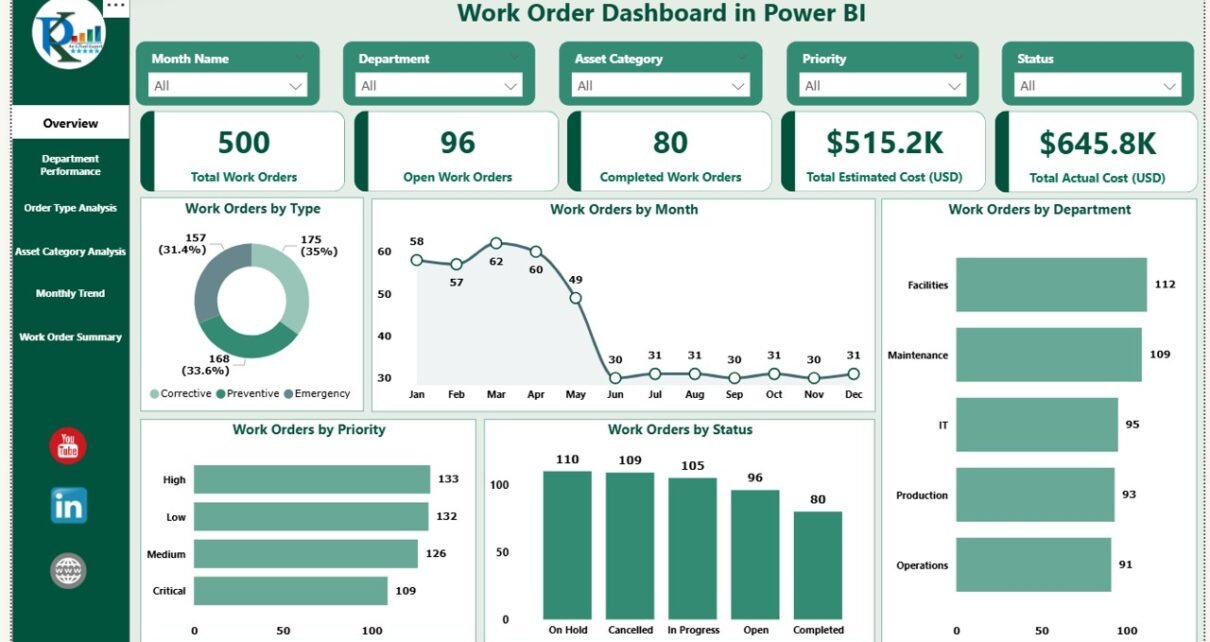
This Work Order Dashboard in Power BI includes 6 structured and interactive pages, each designed for a specific analytical purpose.
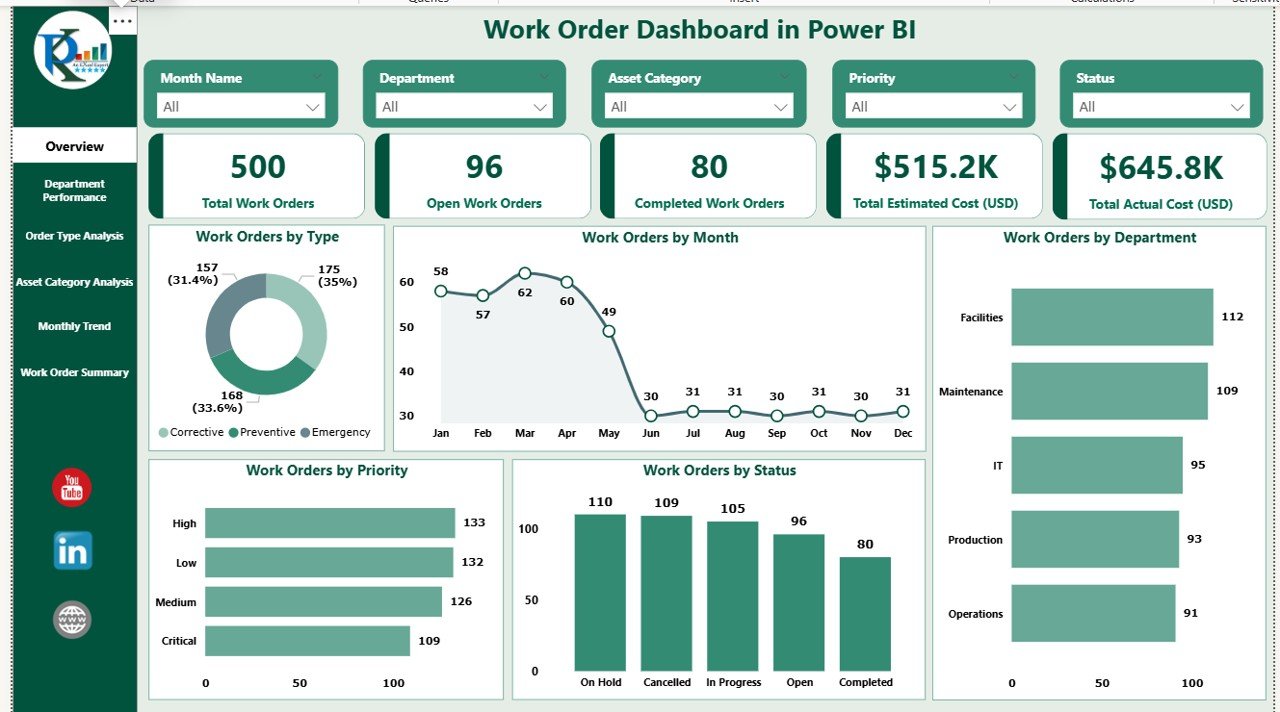
Overview Page: What Is Happening at a Glance?
The Overview Page acts as the control center of the dashboard. It gives instant visibility into overall maintenance performance.
Key KPIs on the Overview Page
- Total Work Orders
- Open Work Orders
- Completed Work Orders
- Total Estimated Cost (USD)
- Total Actual Cost (USD)
Visuals included
- Work Orders by Type
- Work Orders by Month
- Work Orders by Department
- Work Orders by Priority
- Work Orders by Status
Because slicers are available, users filter data by date, department, or priority. As a result, leadership understands the maintenance workload instantly.
Click to buy Work Order Dashboard in Power BI
Department Performance: Which Teams Perform Better?
The Department Performance Dashboard focuses on how different departments handle work orders and costs.
Charts on this page
- Completed vs Open Work Orders by Department
- Estimated Cost (USD) by Department
- Actual Cost (USD) by Department
This page helps managers compare departments quickly. If one department shows high actual costs or many open orders, corrective action becomes easier.

Click to buy Work Order Dashboard in Power BI
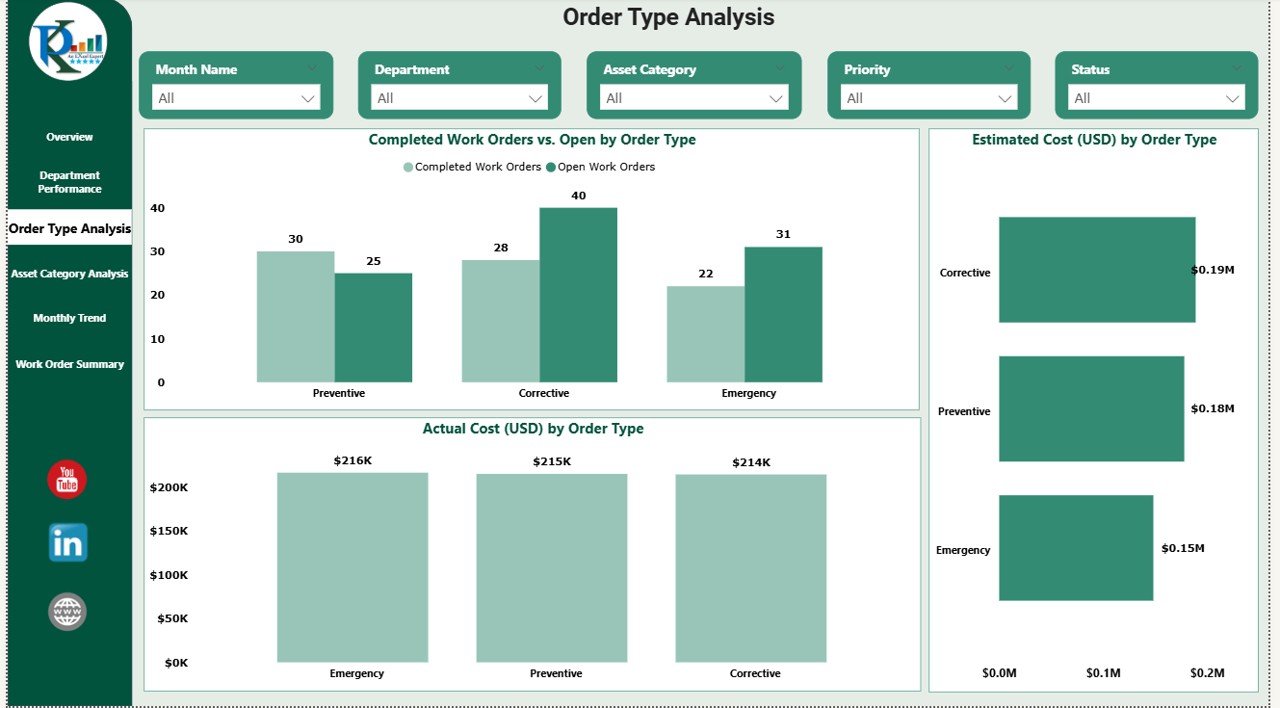
Order Type Analysis: Which Work Orders Drive Costs?
Not all work orders impact operations equally. Therefore, the Order Type Analysis Dashboard breaks data by work order type.
Key insights from this page
- Completed vs Open Work Orders by Order Type
- Estimated Cost by Order Type
- Actual Cost by Order Type
Because of this analysis, organizations identify whether corrective, preventive, or emergency orders consume more resources.
Click to buy Work Order Dashboard in Power BI
Asset Category Analysis: Which Assets Need Attention?
Assets play a critical role in maintenance planning. The Asset Category Analysis Dashboard highlights performance across different asset groups.
Visuals included
- Completed vs Open Work Orders by Asset Category
- Estimated Cost by Asset Category
- Actual Cost by Asset Category
With this page, maintenance teams quickly spot high-maintenance assets and plan replacements or preventive actions.
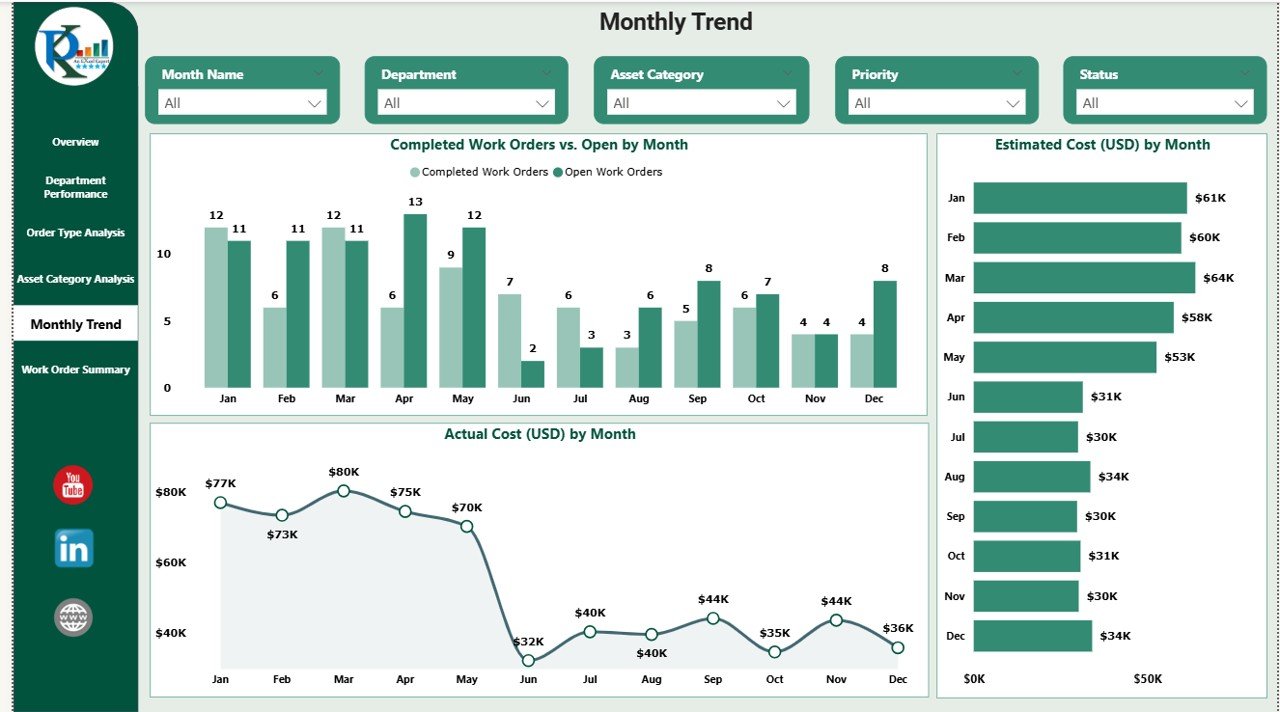
Monthly Trends: Are Work Orders Increasing Over Time?
The Monthly Trends Dashboard tracks how work orders and costs change month by month.
Charts on this page
- Completed vs Open Work Orders by Month
- Estimated Cost by Month
- Actual Cost by Month
This analysis helps identify seasonal patterns, workload spikes, and budget risks early.
Click to buy Work Order Dashboard in Power BI
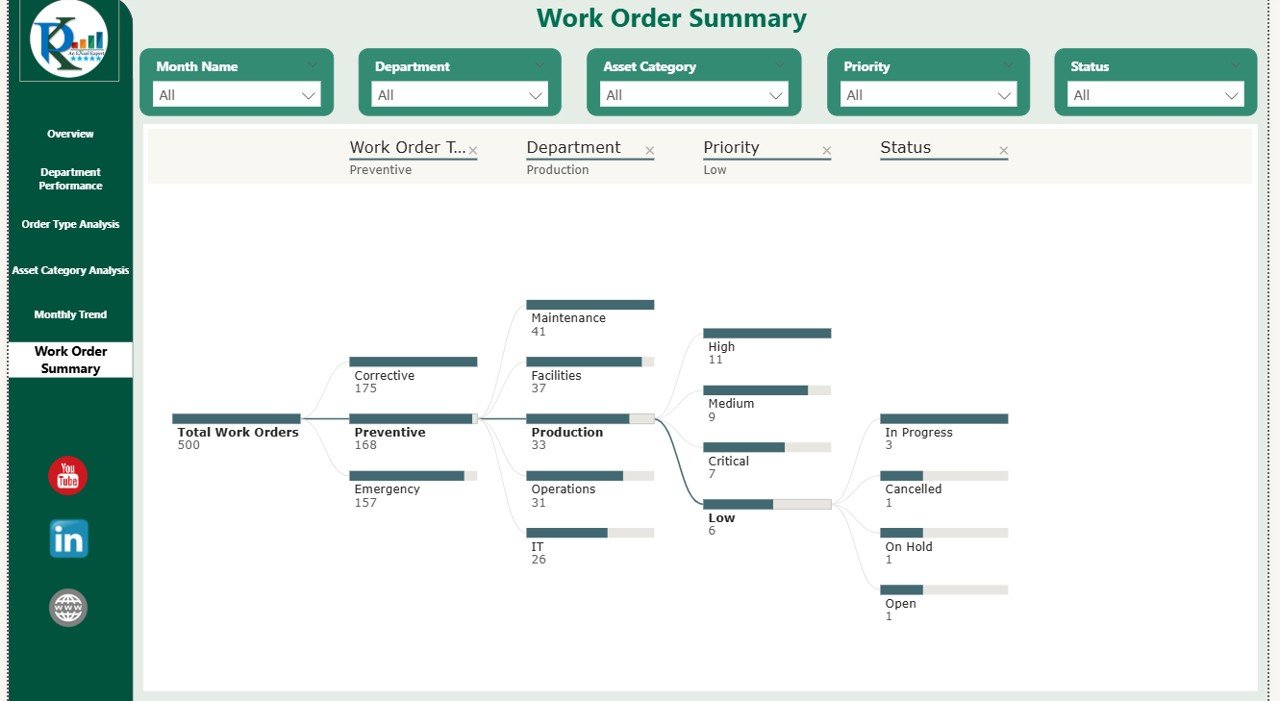
Work Order Summary: What Is the Final Snapshot?
The Work Order Summary Page presents a consolidated view of all insights.
This page helps stakeholders review:
- Overall work order performance
- Cost behavior
- Completion trends
- Key operational risks
Because everything appears in one place, management reviews become faster and more effective.
Click to buy Work Order Dashboard in Power BI
Advantages of Work Order Dashboard in Power BI
A Work Order Dashboard in Power BI delivers value across operations, finance, and leadership.
- Improves Operational Visibility
The dashboard shows open, completed, and pending work orders instantly. As a result, teams avoid delays and miscommunication.
- Enhances Cost Control
By comparing estimated and actual costs, organizations control overspending and improve budget accuracy.
- Saves Time on Reporting
Automated visuals replace manual Excel reports. Therefore, teams focus more on action and less on data preparation.
- Supports Better Decision-Making
Interactive visuals highlight trends, risks, and performance gaps. As a result, managers take faster and smarter decisions.
- Increases Accountability
Department-wise and asset-wise analysis ensures clear responsibility and performance tracking.
- Scales with Business Growth
Power BI dashboards handle growing data easily. Therefore, the solution remains effective as operations expand.
Best Practices for the Work Order Dashboard in Power BI
To get maximum value, organizations should follow proven best practices.
- Define Clear KPIs First
Always decide which metrics matter most. For example, focus on open orders, cost variance, and completion rates.
Keep Visuals Simple
Avoid cluttered charts. Instead, use clear visuals that highlight trends quickly.
Use Consistent Naming
Maintain consistent naming for departments, order types, and asset categories to avoid confusion.
Leverage Slicers Effectively
Use slicers for date, department, and priority to allow flexible analysis.
Monitor Data Quality Regularly
Ensure accurate data entry for work orders, costs, and dates. Clean data ensures reliable insights.
Review Dashboard Monthly
Schedule monthly reviews to identify trends, risks, and improvement areas early.
Who Can Use a Work Order Dashboard in Power BI?
This dashboard suits multiple roles and industries.
Ideal users
- Maintenance Managers
- Operations Heads
- Facility Managers
- Finance Teams
- Plant Managers
- Senior Leadership
Industries that benefit
- Manufacturing
- Facilities Management
- Healthcare
- Real Estate
- Utilities
- Transportation
How Does This Dashboard Improve Maintenance Strategy?
A Work Order Dashboard in Power BI shifts maintenance from reactive to proactive.
Because teams see trends early, they:
- Reduce emergency repairs
- Improve preventive maintenance planning
- Extend asset life
- Optimize maintenance budgets
As a result, overall operational efficiency improves.
Conclusion: Why Work Order Dashboard in Power BI Is a Must-Have Tool
A Work Order Dashboard in Power BI transforms maintenance management completely. Instead of scattered data and delayed decisions, organizations gain clarity, control, and confidence.
With six structured pages—Overview, Department Performance, Order Type Analysis, Asset Category Analysis, Monthly Trends, and Summary—the dashboard delivers end-to-end visibility. Moreover, interactive visuals, real-time updates, and cost tracking help businesses reduce downtime and improve performance.
In today’s data-driven environment, this dashboard is not optional. Instead, it becomes a strategic necessity for efficient maintenance operations.
Frequently Asked Questions (FAQs)
- What data is required for a Work Order Dashboard in Power BI?
You need work order ID, dates, department, asset category, order type, priority, status, estimated cost, and actual cost.
- Can this dashboard connect to Excel or ERP systems?
Yes. Power BI connects easily to Excel, databases, ERP, and CMMS systems.
- Does the dashboard update automatically?
Yes. Once data refresh is set, visuals update automatically.
- Can users filter data by month or department?
Yes. Slicers allow filtering by month, department, priority, and more.
- Is Power BI suitable for small organizations?
Yes. Power BI scales easily and works well for small and large organizations.
- Does this dashboard help reduce maintenance costs?
Yes. By tracking estimated vs actual costs, organizations control overspending effectively.
Visit our YouTube channel to learn step-by-step video tutorials
Watch the step-by-step video tutorial:
Click to buy Work Order Dashboard in Power BI